


InfoWARE AI Analyst Daily Market Report: 09-Dec-2025 | InfoWARE Finance
Get IDIA - the stock trading app for the modern investor


InfoWARE AI Analyst Daily Market Report: 09-Dec-2025
(Source: InfoWARE Terminal, Date: 09-Dec-2025)
Dear Investor,
NGX Daily Market Summary – Tuesday, December 9, 2025
Market Recap:
The Nigerian equity market ticked lower today with the NGX All Share Index (ASI) -0.33% to close at 147,427.95, despite robust trading activity: turnover surged by 58.74% over Monday to ₦20.59 billion and volumes jumped to 851.31 million shares (vs 535.03M yesterday). While market breadth remained negative, with more decliners than advancers (28 up vs 37 down; breadth ratio 0.76x), the trading session was dominated by outsized ETF moves, select profit-taking, and waves of institutional activity. Top gainer was MERISTEM VALUE ETF (+10.0%), hitting overbought RSI territory, while NEWGOLD ETF led the losers at -10.2%. The banking and ETF sectors remained heavily traded and under close scrutiny from both institutional and retail investors.
Market Breadth & Trading Trends
- Turnover: Value traded up 58.74% to ₦20.59B, led by ACCESSCORP, ZENITHBANK, and GTCO. Institutional trades dominated: 92.10% of value and 85.77% of volume despite making up just 37.18% of trade count.
- Market Breadth: More stocks declined than advanced (adv/dec: 28/37; breadth 0.76x), with 73 stocks seeing higher volumes and 69 lower—showing sectoral rotation and stock-specific moves.
- Unusual Volume Alerts: CORNERSTONE INSURANCE led with a 6,354% spike in volume, followed by ACCESSCORP (+303%) and FCMB (+209%). Watch for follow-through on unusually active stocks; often these foreshadow impending volatility or a sentiment shift.
Top Gainers & Losers: YTD Leaders & Laggards
| Gainer | YTD % Chg | Today's % Chg | RSI | Notable Technicals |
|---|---|---|---|---|
| MERISTEM VALUE ETF | 108.43% | 10.0% | 91.1 | MACD rising, RSI in overbought zone, sustained above 15DMA/50DMA |
| VETIVA INDUSTRIAL ETF | 68.87% | 9.99% | 58.54 | Price > 15DMA, positive 5/50 DMA crossover |
| MERISTEM GROWTH ETF | 39.44% | 9.99% | 77.25 | Bullish MACD, strong momentum |
| GREENWICH ASSET ETF | -38.20% | 10.0% | 37.19 | Volatile rebounds, watch carefully |
| LIVINGTRUST MB | -13.47% | 4.99% | 43.71 | Gradual recovery, possible value play |
| Loser | YTD % Chg | Today's % Chg | RSI | Notable Technicals |
|---|---|---|---|---|
| UNION DICON SALT | -16.67% | 0.0% | 31.78 | Barely above oversold; steady downtrend |
| AUSTIN LAZ | 14.36% | -10.0% | 17.44 | RSI deep oversold, momentum weak |
| ETERNA | -13.77% | -10.0% | 40.88 | Negative MACD, trend remains soft |
| ABCTRANS | 152.03% | 0.0% | 7.63 | RSI extreme oversold, contrarian interest? |
| VETIVA GRIFFIN 30 ETF | 44.37% | -9.39% | 51.09 | Approaching neutral RSI; volatility rising |
Momentum Analysis
-
Bullish Momentum Stocks:
- VETGOODS ETF (RSI 43.3): Price crossed above 15DMA; leading gainer today after lagging YTD. Potential momentum breakout confirmed by MACD.
- MERISTEM Value, MERISTEM Growth, VETINDETF: All with strong positive MACD histograms, prices staying above both 15/50 DMA, and RSI above 70 (overbought) on MERVALUE—suggesting overextension; caution on chasing rallies.
-
Bearish Momentum Stocks:
- AUSTIN LAZ (RSI 17.4): Deep in oversold, -10% move, multiple timeframe momentum negative—ripe for a technical bounce if volume picks up.
- PRESTIGE, NEWGOLD ETF: Both slipped below 15 DMA, negative MACD, signaling caution.
Contrarian Signals
- GREENWICH ASSET ETF: Despite YTD return -38.2%, showed a +10% pop today with RSI 37—possible short squeeze or reversal play, but overall remains risky unless positive trend repeats.
- VETGOODS ETF: Today's 10% gain and bullish MACD comes after a mixed YTD (+117%) but recent pullback; watch for failed rallies as ETF volatility surges.
- AUSTIN LAZ: Down -10% today but still positive YTD; extremely low RSI (17.4); may attract bargain hunters if sell-off exhausts.
Sector Heatmap / Institutional & Retail Activity
| Sector | Performance Today | Institutional Activity | Retail Activity | Technical Trend | |
|---|---|---|---|---|---|
| Banking | ACCESSCORP: -0.71% | ZENITHBANK: -0.77% | Dominant (ACCESSCORP 18.7% volume) | High (ACCESSCORP, ZENITHBANK top 2 retail) | Mixed—heavy volume, sideways |
| Insurance | CORNERST: -0.91% | CONHALLPLC: -4.29% | Inflows (unusual volumes) | Heightened retail activity | Bearish (volume spikes on red days) |
| ETF | MERVALUE: +10.0% | VETGOODS: +10.0% | Attracting institutional focus | Bouncing after prior weakness | Bullish but crowded; some overbought |
| Energy/Resources | JAPAULGOLD: +5.5% | ETERNA: -10.0% | Mixed; rotation flows | JAPAULGOLD especially active | Bullish for gold, oil soft |
Note: Institutional clustering observed in Access Holdings (ACCESSCORP), ZENITHBANK, and GTCO—each with a strong correlation between high trade value, unusual volume, and top institutional trades. This is indicative of block trades or smart money making sizable bets/adjustments.
Dividend-Beta Matrix: Defensive Stock Opportunities
| Stock | Dividend Yield (%) | Beta | Technical Signal | Commentary |
|---|---|---|---|---|
| PRESTIGE ASSURANCE | 2.50 | ~0.80 | Bearish (below 15DMA, low RSI) | High yield, but active selling—value trap? |
| ETERNA | 0.68 | 1.34 | Bearish (new low, RSI 40.9) | Yield offers some buffer but volatility high |
| LIVESTOCK FEEDS | 2.94 | 0.46 | Bearish (YTD weak, RSI midfield) | Defensive due to low beta, but trajectory is negative |
| LINKASSURE | 5.56 | 0.41 | Bullish (above 15DMA, rising volume) | High yield, less volatility; consider for yield seekers |
Institutional Clustering Alerts
- ACCESSCORP: Huge institutional trade volumes (18.7% of institutional value, 284 institutional trades for 177M shares). Institutional clustering combined with unusual volume is a classic flag for significant portfolio rebalancing.
- ZENITHBANK: 20.17% of institutional value trades. Focus here suggests banking sector rotations and/or block trades—often seen before earnings or regulatory changes.
Technical Snapshots
-
15DMA/50DMA crossovers:
- MERVALUE ETF: Prices well above both moving averages, RSI > 90—likely to draw short-term traders but momentum chase risk is high.
- LINKASSURE, VETGOODS: Both recently cleared their 15DMA; bullish but watch for overbought signals.
- NEWGOLD ETF, PRESTIGE, FTNCOCOA, GUINEAINS, JULIUS BERGER: Negative crossovers, soft MACD—potential short setups if broader market sentiment remains weak.
YTD Gainers & Losers Table (Top 5 each)
| Top 5 YTD Gainers | YTD % | Top 5 YTD Losers | YTD % |
|---|---|---|---|
| ABCTRANS | 152.03% | UNION DICON | -16.67% |
| MERVALUE ETF | 108.43% | ETERNA | -13.77% |
| VETGOODS ETF | 117.44% | AUSTIN LAZ | 14.36%* |
| LIVINGTRUST | -13.47% | VETGRIF30 ETF | 44.37%* |
| VETINDETF | 68.87% | LIVESTOCK FEEDS | 35.44%* |
*Note: Some "losers" have positive YTD due to short-term volatility spikes.
Market Activity / Trading Patterns: Retail vs Institutional
- Institutions: Only 37.18% of trade count, but 85.77% of volume and 92.10% of value—a day of big block trades and portfolio management. Most activity seen in ACCESSCORP, GTCO, ZENITHBANK, and MTNN (core financials/telecoms).
- Retail: 62.82% of trades but just 14.23% of volume and 7.90% of value. Retail remains active in ACCESSCORP, ZENITHBANK, MTNN, and GTCO, but institutions are setting price direction.
- Overlap: ACCESSCORP and ZENITHBANK are top for both groups—these are the market's current "control points."
- Correlation: Unusual volume in ACCESSCORP and FCMB coincides with increased institutional buy/sell, hinting at possible end-of-year portfolio rebalancing or index-related flows.
Trader Opportunities / Cautions
- Momentum traders should note the crowding in ETFs—their moves are attracting short-term bids, but overbought signals (RSI > 70 on MERVALUE) raise reversal risk. Take profits or use tighter stops.
- Bargain hunters: Stalk names like AUSTIN LAZ and PRESTIGE (deep oversold), but only with volume confirmation.
- Dividend/income seekers: Watch LINKASSURE and LIVESTOCK FEEDS for low beta/high yield setups—though technicals are mixed.
- Instituional focus: Banking names remain liquidity hubs—perfect for block trade or pair-trading strategies. Monitor for further clustering, especially on ACCESSCORP and ZENITHBANK.
- ETF traders: Tight stops are wise after today's explosive reversals—volatility is on the rise.
Hidden Insights & Summary
- ETF Leadership: ETFs not only swept the podium for top daily and YTD gains but also drew institutional flows—signaling shifting strategy among large AUM investors who are using these as proxies for sectoral exposure.
- Technicals diverging from fundamentals: Some high yield or "defensive" stocks are in technical downtrends (e.g., PRESTIGE)—be wary of "yield traps."
- Volume spikes in ACCESSCORP, CORNERSTONE, and FCMB together with increased institutional activity are historically precursors to sustained moves or regime changes—these should be closely monitored for confirmation signals in the days ahead.
Disclaimer: This summary is for informational purposes only and does not constitute investment advice. Always do your due diligence before acting on market data.
|
Top ASI Gainers Over Last 5 Trading Days
|
Top ASI Losers Over Last 5 Trading Days
|
For more detailed analysis, on InfoWARE Market Data Terminal <NSEPERF> <GO>
On InfoWARE Finance Mobile App (Android, iPhone & iPad, Windows Phone and Windows 8/10), "Top Gainers & Losers"
MERISTEM VALUE EXCHANGE TRADED FUND (MERVALUE) topped the advancers list closing at N416.24 with a gain of 10.00% followed by VETIVA CONSUMER GOODS ETF (VETGOODS) which closed at N37.40 with a gain of 10.00%.
On the flip side NEWGOLD EXCHANGE TRADED FUND (ETF) (NEWGOLD) and AUSTIN LAZ & COMPANY PLC (AUSTINLAZ) topped the decliners log with a loss of -10.17% at a close of N53,003.00, and -10.00% to close the day at N2.07 respectively.
| Symbol | LClose | %Chg |
|---|---|---|
| MERVALUE | 416.24 | 10.00 |
| VETGOODS | 37.40 | 10.00 |
| GREENWETF | 330.01 | 10.00 |
| MERGROWTH | 550.10 | 10.00 |
| VETINDETF | 70.67 | 9.99 |
| Symbol | LClose | %Chg |
|---|---|---|
| NEWGOLD | 53,003.00 | -10.17 |
| AUSTINLAZ | 2.07 | -10.00 |
| ETERNA | 31.95 | -10.00 |
| STANBICETF30 | 1,575.00 | -9.99 |
| TRANSCOHOT | 155.60 | -9.95 |
For more detailed analysis,
- On InfoWARE Market Data Terminal <TOPG> <GO>
- On InfoWARE Finance Mobile App ( Android, iPhone & iPad and Windows 10) , "Top Gainers & Losers"
Currency Market
In the currency market, the Naira was unchanged against the dollar at 1 to 1NSE: Bull Signal - Price crossed above 15 Day MA
This signal implies these stocks are under buying pressure and the price might continue to rise and therefore positions should be monitored closely. Further suggested analysis include looking at the overall market (ASI) to see if the uptrend is market wide, sector wide or specific to the stock. Portfolio managers tend to use this as a signal to do more research to add to their positions or lock in some profits. Typically further analysis should be done using commands like PC and RV on the InfoWARE Market Data Terminal. Another command is ALERTS to set price triggers for possible exit or entry as necessary
For more detailed analysis,
- On InfoWARE Market Data Terminal <NSEPERF> <GO>
- On InfoWARE Finance Mobile App ( Android , iPhone & iPad and Windows 10) , "Top Gainers & Losers"
| Symbol | Price | %Chg | 15DMA | PE | EPS | DivY | MktCap | Vol | Trades | Value | LstTradeTime |
|---|---|---|---|---|---|---|---|---|---|---|---|
| VETGOODS | 37.40 | 9.09 | 36.93 | 0.00 | 0.00 | 2.30K | 3.00 | 85.91K | 09-Dec-2025 14:31:14.760 | ||
| FGSUK2032S5 | 109.00 | 7.34 | 101.87 | 0.00 | 0.00 | 25.15K | 7.00 | 26.45M | 09-Dec-2025 14:31:23.797 | ||
| INTENEGINS | 2.45 | 6.12 | 2.36 | 0.52 | 2.85 | 3.40 | 3.15B | 135.52K | 18.00 | 331.10K | 09-Dec-2025 14:30:23.257 |
| LINKASSURE | 1.84 | 4.35 | 1.78 | 59.89 | 0.02 | 5.56 | 25.76B | 510.07K | 22.00 | 926.14K | 09-Dec-2025 14:30:23.567 |
| TIP | 11.65 | 4.29 | 11.22 | 0.00 | 10.37B | 4.39M | 197.00 | 48.77M | 09-Dec-2025 14:31:19.020 | ||
| TAJSUKS2 | 100.00 | 3.98 | 99.15 | 0.00 | 0.00 | 3.00 | 1.00 | 3.00K | 09-Dec-2025 14:31:23.993 | ||
| OMATEK | 1.18 | 2.54 | 1.17 | 6.82 | 0.10 | 0.00 | 3.47B | 2.00M | 51.00 | 2.37M | 09-Dec-2025 14:30:24.460 |
| FGS202789 | 90.10 | 0.00 | 90.10 | 0.00 | 0.00 | 0.00 | 0.00 | 0.00 | 09-Dec-2025 14:30:48.073 |
NSE: BEAR Signal - Price crossed below 15 Day MA
This signal implies these stocks are under selling pressure and the price might continue to slide and therefore positions should be monitored closely. Further suggested analysis include looking at the overall market (ASI) to see if the downtrend is market wide, sector wide or specific to the stock. If the overal market trend is upwards, then since these stocks are heading in the opposite direction, then further analysis should be done using commands like PC and RV on the InfoWARE Market Data Terminal. Another command is ALERTS to set price triggers for possible exit is necessar
For more detailed analysis,
- On InfoWARE Market Data Terminal <BEARM> <GO>
- On InfoWARE Finance Mobile App ( Android , iPhone & iPad and Windows 10)
| Symbol | Price | %Chg | 15DMA | PE | EPS | DivY | MktCap | Vol | Trades | Value | LstTradeTime |
|---|---|---|---|---|---|---|---|---|---|---|---|
| FGS202766 | 100.00 | 0.00 | 100.00 | 0.00 | 0.00 | 0.00 | 0.00 | 0.00 | 09-Dec-2025 14:30:46.930 | ||
| NGXSOVBND | 663.33 | -1.50 | 669.73 | 0.00 | 0.00 | 0.00 | 0.00 | 0.00 | 0.00 | 0.00 | 09-Dec-2025 14:30:49.817 |
| NGXINS | 1,101.77 | -1.55 | 1,102.29 | 10.41 | 2.09 | 0.00 | 0.00 | 159.23M | 1,527.00 | 772.89M | 09-Dec-2025 14:30:49.593 |
| NGXMERIGRW | 9,954.45 | -1.65 | 9,967.39 | 34.89 | 293.99 | 0.00 | 0.00 | 86.46M | 3,061.00 | 6.20B | 09-Dec-2025 14:30:49.647 |
| FTNCOCOA | 4.91 | -2.85 | 4.96 | 0.00 | 0.00 | 1.60 | 19.15B | 7.12M | 116.00 | 34.96M | 09-Dec-2025 14:30:23.020 |
| GUINEAINS | 1.15 | -4.35 | 1.17 | 66.79 | 0.01 | 1.96 | 7.06B | 657.16K | 45.00 | 769.29K | 09-Dec-2025 14:30:23.073 |
| FGSUK2031S4 | 89.80 | -5.68 | 92.20 | 0.00 | 0.00 | 46.00 | 1.00 | 41.31K | 09-Dec-2025 14:31:23.787 | ||
| JBERGER | 139.00 | -5.76 | 144.71 | 16.73 | 10.31 | 1.74 | 222.40B | 1.39M | 95.00 | 192.88M | 09-Dec-2025 14:30:23.293 |
| CILEASING | 5.20 | -5.77 | 5.30 | 6.50 | 0.64 | 1.20 | 4.06B | 472.70K | 27.00 | 2.51M | 09-Dec-2025 14:30:22.377 |
| ROYALEX | 1.85 | -5.95 | 1.92 | 0.00 | 0.00 | 7.81 | 9.52B | 2.23M | 60.00 | 4.13M | 09-Dec-2025 14:31:14.473 |
| FG202031S1 | 103.06 | -6.19 | 109.02 | 0.00 | 0.00 | 6.46K | 1.00 | 6.65M | 09-Dec-2025 14:30:43.217 | ||
| PRESTIGE | 1.49 | -7.38 | 1.56 | 10.49 | 0.08 | 2.50 | 19.75B | 3.29M | 46.00 | 5.01M | 09-Dec-2025 14:30:24.850 |
| FG202033S6 | 110.56 | -8.11 | 118.87 | 0.00 | 0.00 | 2.95K | 3.00 | 3.28M | 09-Dec-2025 14:30:43.317 | ||
| NEWGOLD | 53,003.00 | -11.32 | 56,025.66 | 0.00 | 0.00 | 0.00 | 0.00 | 5.00 | 4.00 | 268.01K | 09-Dec-2025 14:31:14.720 |
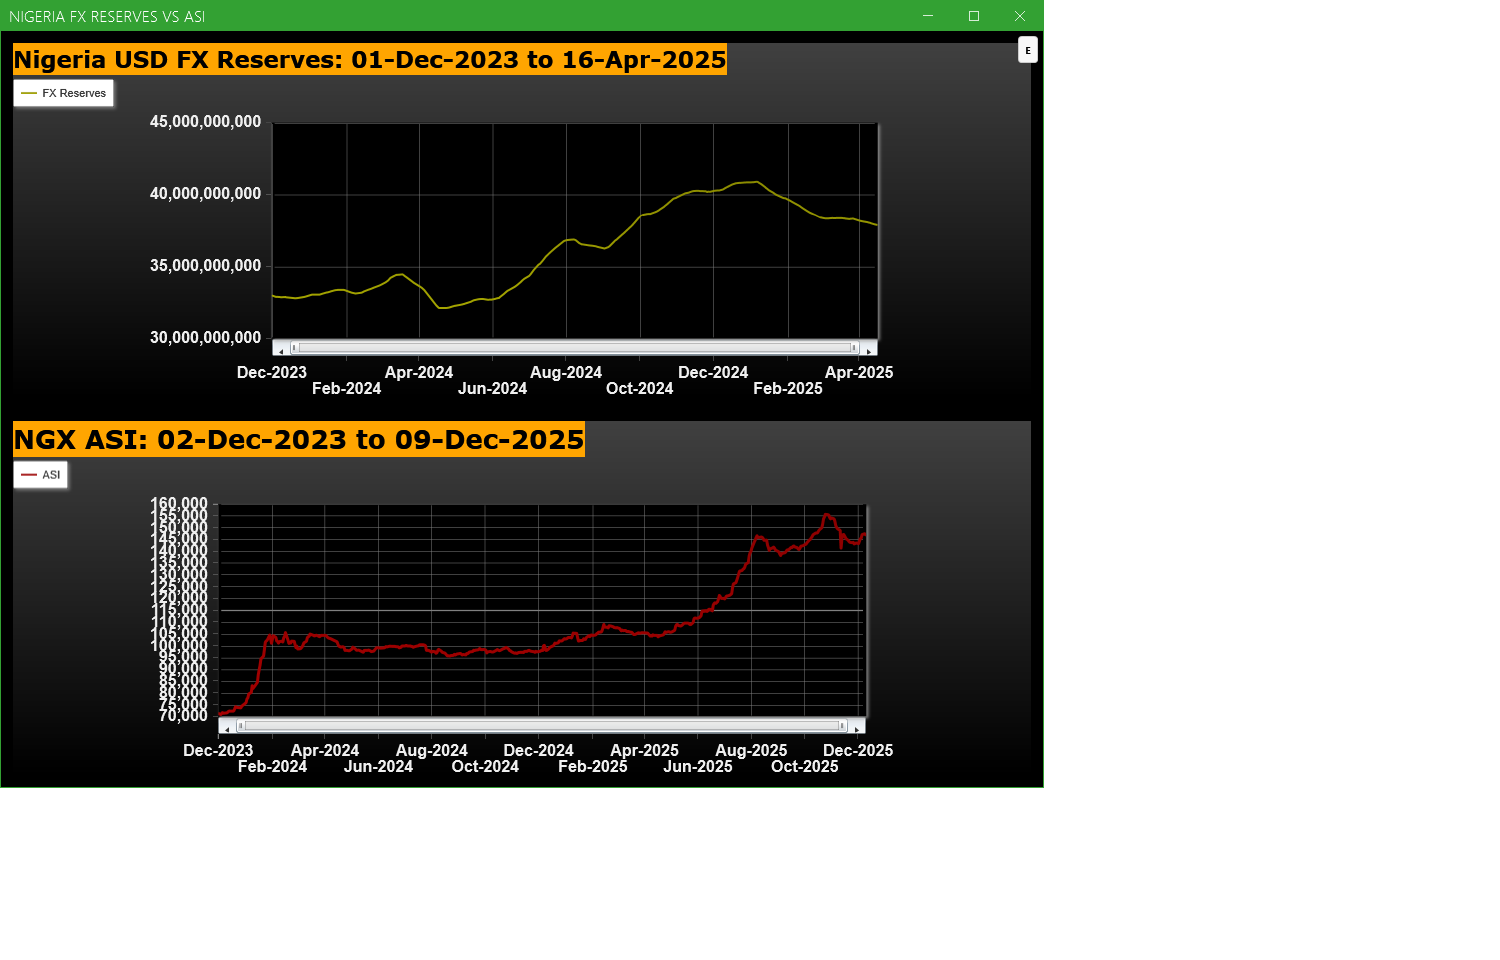
Economic Indicators - Nigeria FX Reserves Vs ASI Chart
Nigeria FX Reserves are assets held on reserve by CBN in foreign currencies. These reserves are used to back liabilities and influence monetary policy. Given the nature of the Nigeria economy, FX Reserves can appear to have an outsize influence on the economy and hence on the capital market. The chart below allows comparison of FX Reserves against the ASI to make investment decisions
For more detailed analysis,
- On InfoWARE Market Data Terminal <CI> <GO>
- On InfoWARE Finance Mobile App ( Android , iPhone & iPad and Windows 10) , "Research"
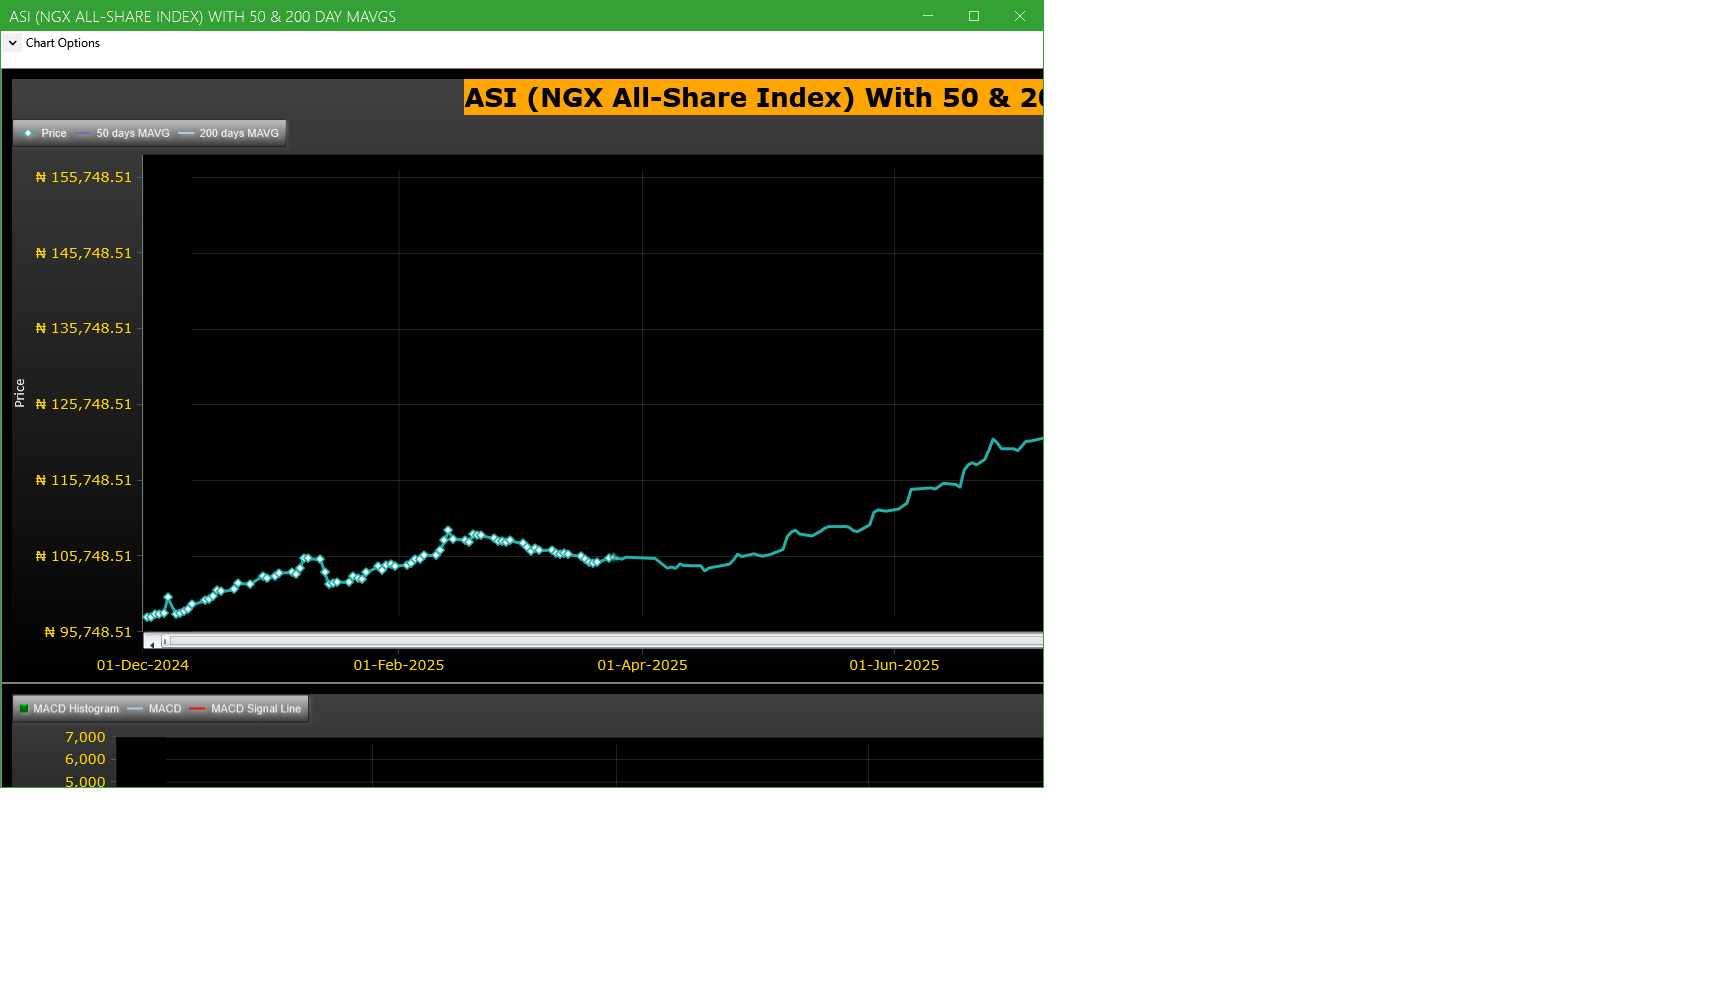
Market Trend - ASI (NGX All-Share-Index) With 50 & 200 Day MAvgs Chart
Technical traders typically use the 50 & 200 day moving averages to aid in choosing
where to enter or exit a position, which then causes these levels to act as strong
support or resistance. As a general guideline, if the price is above a moving average,
the trend is up. If the price is below a moving average, the trend is down.
It is important to note that critics of technical analysis say that moving averages act
as support and resistance because so many traders use these indicators to inform their
trading decisions. Also moving averages tend to work quite well in strong trending conditions
but poorly in choppy or ranging conditions.
Trading Strategies: Crossovers
Crossovers are one of the main moving average strategies. The first type is a price crossover,
which is when the price crosses above or below a moving average to signal a potential change
in trend. Another strategy is to apply two moving averages to a chart: one longer and one
shorter. When the shorter-term MA crosses above the longer-term MA, it is a buy signal, as
it indicates that the trend is shifting up. This is known as a golden cross. Meanwhile, when
the shorter-term MA crosses below the longer-term MA, it is a sell signal, as it indicates that
the trend is shifting down. This is known as a dead/death cross
For more detailed analysis,
- On InfoWARE Market Data Terminal <CI> <GO>
- On InfoWARE Finance Mobile App ( Android , iPhone & iPad and Windows 10) , "Research"
Unusual Volume: Volume traded is more than double the 90 day moving average (All exchanges; ASI & ASem). For more detailed analysis,
- On InfoWARE Market Data Terminal <UV> <GO>
- On InfoWARE Finance Mobile App ( Android , iPhone & iPad and Windows 10)
| Symbol | Name | Volume | 90DAvgVol | %VolChg | Price | LClose | %Chg | Trades | Value |
|---|---|---|---|---|---|---|---|---|---|
| ACCESSCORP | Access Holdings PLC | 183.56M | 45.55M | 302.96 | 20.90 | 21.05 | -0.71 | 1,625 | 3.77B |
| CORNERST | CORNERSTONE INSURANCE COMPANY PLC. | 115.98M | 1.80M | 6,353.69 | 5.45 | 5.50 | -0.91 | 82 | 609.38M |
| CONHALLPLC | CONSOLIDATED HALLMARK INSURANCE PLC | 79.42M | 20.17M | 293.81 | 4.02 | 4.20 | -4.29 | 39 | 319.32M |
| FCMB | FCMB GROUP PLC. | 78.09M | 25.31M | 208.54 | 10.95 | 11.05 | -0.90 | 482 | 850.56M |
| JAPAULGOLD | JAPAUL GOLD & VENTURES PLC | 62.08M | 18.89M | 228.63 | 2.30 | 2.18 | 5.50 | 184 | 136.40M |
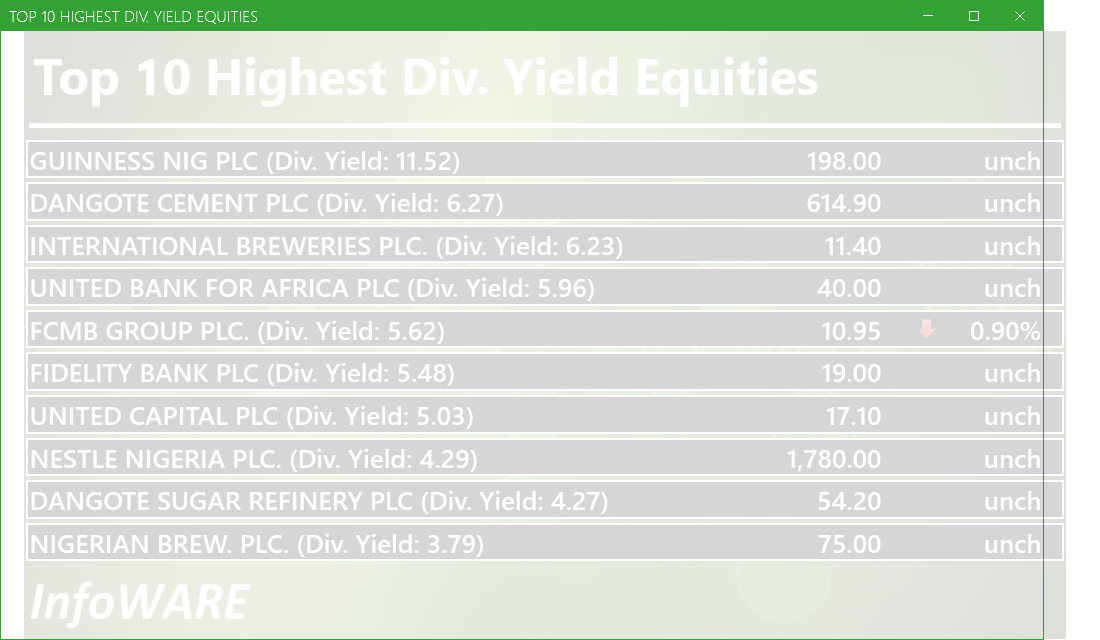
Investment Insights - High Div. Stocks
Dividend stocks distribute a portion of the company earnings to investors on a regular basis and they can a great choice for investors looking for regular income. As an investment or trading strategy, high dividend yield equities provide annual cash payments as against mostly capital gains in the price of a stock. The list in the table below represent the highest dividend paying stocks from the list of the most liquid stocks in the NSE top 30.
For more detailed analysis,
- On InfoWARE Market Data Terminal <HYIELD> <GO>
- On InfoWARE Finance Mobile App ( Android , iPhone & iPad and Windows 10) , "Research"
African Markets
| Name | LClose | Change | %Chg |
|---|---|---|---|
| BRVM Stock Exchange | 352.77 | -0.11 | -0.03 |
| Botswana Stock Exchange | 10,813.07 | 20.51 | 0.19 |
| Egyptian Exchange | 41,963.24 | 200.46 | 0.48 |
| Ghana Stock Exchange | 8,630.50 | 7.76 | 0.09 |
| Johannesburg Stock Exchange | 110,827.40 | -1,653.47 | -1.47 |
| Lusaka Stock Exchange | 25,311.72 | 22.76 | 0.09 |
| Casablanca Stock Exchange | 18,473.47 | 3.69 | 0.02 |
| Malawi Stock Exchange | 614,643.69 | -676.85 | -0.11 |
| Nigeria Stock Exchange | 147,427.95 | 382.32 | 0.26 |
| Nairobi Securities Exchange | 179.12 | -0.47 | -0.26 |
| Namibian Stock Exchange | 2,062.95 | -19.37 | -0.93 |
| Rwanda Stock Exchange | 180.53 | 0.00 | 0.00 |
| Tunis Stock Exchange | 13,220.36 | -47.77 | -0.36 |
| Uganda Securities Exchange | 1,509.62 | 3.31 | 0.22 |
Nigeria Market Indexes
| Symbol | LClose | %Chg | WTD% | MTD% | QTD% | YTD% | MktCap | Trades |
|---|---|---|---|---|---|---|---|---|
| ASI | 146,940.27 | -0.33 | -0.33 | 2.60 | 2.77 | 42.41 | 21,506 | |
| NGX30 | 5,378.31 | -0.24 | -0.24 | 2.70 | 3.07 | 40.98 | 11,863 | |
| NGXAFRBVI | 3,273.08 | 0.02 | 0.02 | 5.12 | -7.79 | 31.94 | 4,961 | |
| NGXAFRHDYI | 21,058.38 | -1.13 | -1.13 | 1.34 | -5.40 | 23.67 | 5,145 | |
| NGXASEM | 1,392.88 | 0.00 | 0.00 | 0.00 | -9.44 | -12.05 | 2 | |
| NGXBNK | 1,438.68 | -0.05 | -0.05 | 4.00 | -5.15 | 32.30 | 5,425 | |
| NGXCG | 3,975.44 | -0.11 | -0.11 | 3.56 | -1.86 | 40.51 | 11,563 | |
| NGXCNSMRGDS | 3,477.23 | 0.00 | 0.00 | 2.68 | 2.79 | 100.49 | 2,676 | |
| NGXCOMMDTY | 1,172.91 | -0.49 | -0.49 | -0.73 | 4.55 | 17.29 | ||
| NGXGROWTH | 15,874.88 | 7.22 | 7.22 | 7.37 | 5.33 | 104.50 | 326 | |
| NGXINDUSTR | 5,524.50 | -0.06 | -0.06 | 7.69 | 9.01 | 54.68 | 1,920 | |
| NGXINS | 1,101.77 | -1.53 | -1.53 | 1.66 | -7.89 | 40.14 | 1,527 | |
| NGXLOTUSISLM | 12,905.62 | -0.89 | -0.89 | 1.13 | 8.71 | 85.22 | 4,038 | |
| NGXMAINBOARD | 7,048.07 | -0.48 | -0.48 | 0.90 | 0.05 | 40.85 | 15,154 | |
| NGXMERIGRW | 9,954.45 | -1.63 | -1.63 | -0.09 | 0.52 | 52.60 | 3,061 | |
| NGXMERIVAL | 12,836.30 | -0.67 | -0.67 | 4.23 | -3.98 | 23.07 | 6,126 | |
| NGXOILGAS | 2,686.23 | 0.08 | 0.08 | -0.38 | 6.34 | -0.92 | 268 | |
| NGXPENBRD | 2,762.56 | -0.38 | -0.38 | 2.53 | 4.20 | 50.83 | 17,801 | |
| NGXPENSION | 6,780.54 | -0.38 | -0.38 | 2.41 | 0.63 | 49.55 | 13,410 | |
| NGXPREMIUM | 14,918.22 | -0.10 | -0.10 | 5.91 | 8.96 | 53.28 | 6,026 | |
| NGXSOVBND | 663.33 | -1.47 | -1.47 | -1.50 | 0.92 | 10.27 | 0 |
For more detailed analysis,
- On InfoWARE Market Data Terminal <MKTINS> <GO>
- On InfoWARE Finance Mobile App ( Android, iPhone & iPad and Windows 10) , "Market Indexes"
Find the topic interesting? Will like to comment? Contact Us at solutions@infowarelimited.com
Top News

Chart Of The Day - ASI Chart Vs ASI Advance Decline Line (YTD) (09-Dec-2025 15:07:20.154)
InfoWARE AI Analyst Daily Market Report: 09-Dec-2025

[XNSA]>> CORDROS MILESTONE FUNDS' BID & OFFER PRICES
[XNSA]]>> H2 2025 BC/DR TEST: ONBOARDING PROCESS TO NGX DR VPN
[VSPBONDETF]>> DAILY INDICATIVE PRICES
[LOTUSHAL15]>> DAILY INDICATIVE PRICES
[XNSA]>> H2 2025 BC/DR TEST
[XNSA]>> INTRODUCTION OF COMMERCIAL PAPER LISTING AND TRADING ON NGX
[XNSA]>> OFF MARKET TRADE
[SIAMLETF40]>> DAILY INDICATIVE PRICES
[XNSA]>> APPOINTMENT OF A DIRECTOR
[XNSA]>> CHAMPION BREWERIES PLC: ACTIVATION OF CODE FOR TRADING IN RIGHTS
Chart Of The Day - ASI Chart Vs ASI Advance Decline Line (YTD) (08-Dec-2025 15:16:49.745)
InfoWARE AI Analyst Daily Market Report: 08-Dec-2025
[XNSA]>> DAILY FUND PRICE SUBMISSION - FCMB ASSET MANAGEMENT LIMITED
[VETBANK]>> DAILY INDICATIVE PRICES
[XNSA]>> RECLASSIFICATION FROM LOW PRICE STOCK GROUP TO MEDIUM PRICE STOCK GROUP
[XNSA]>> RECLASSIFICATION FROM MEDIUM PRICE STOCK GROUP TO HIGH PRICE STOCK GROU
[XNSA]>> H2 2025 BC/DR TEST
[XNSA]>> INTRODUCTION OF COMMERCIAL PAPER LISTING AND TRADING ON NGX
[LOTUSHAL15]>> DAILY INDICATIVE PRICES
[XNSA]>> EMERGING AFRICA DAILY MUTUAL FUND PRICES
[XNSA]>> CORDROS MILESTONE FUNDS' BID & OFFER PRICES
[XNSA]>> CHAMPION BREWERIES PLC: ACTIVATION OF CODE FOR TRADING IN RIGHTS
InfoWARE AI Analyst Weekly Market Report: 05-Dec-2025
Chart Of The Day - ASI Chart Vs ASI Advance Decline Line (YTD) (05-Dec-2025 15:06:53.831)
InfoWARE AI Analyst Daily Market Report: 05-Dec-2025
[XNSA]>> APPOINTMENT OF A DIRECTOR
[LOTUSHAL15]>> DAILY INDICATIVE PRICES
[VETINDETF]>> DAILY INDICATIVE PRICES
Get IDIA - the stock trading app for the modern investor
Solutions by Business
Product Suites
Company
Contacts
- 8th Floor,
- South Atlantic Petroleum Towers,
- 1 Adeola Odeku Street,
- Victoria Island,
- Lagos, Nigeria.
- Email: solutions@infowarelimited.com
Follow Us
 |
 |
 |
 |