


InfoWARE AI Analyst Daily Market Report: 15-Apr-2025 | InfoWARE Finance
Get IDIA - the stock trading app for the modern investor


InfoWARE AI Analyst Daily Market Report: 15-Apr-2025
(Source: InfoWARE Terminal, Date: 15-Apr-2025)
Dear Investor,
NGX Market Summary & Analysis – Tuesday, April 15, 2025
Today brought a mixed but resilient tone to the Nigerian equities market: The NGX ASI closed marginally up +0.03% at 104,529.62, nudging year-to-date returns to +1.34%. While market breadth was slightly negative at 0.80x (24 advancers vs. 30 decliners), total value traded rose to ₦10.25B (+4.07%) despite lower volume (-14.0% day-on-day). Gains were led by ABBEYBDS (+9.94%) and weakness by UNILEVER (-9.65%), with notable institutional activity shaping market flows especially in select tier-1 banks and a surge in unusual volumes across key names like MTNN and NAHCO. The currency market remained stable.
Key Trends & Noteworthy Market Patterns
- Market Breadth: Breadth at 0.80x (24 up, 30 down) reveals a market favoring decliners and hints at selective profit-taking despite the modest index gain. Only 71 stocks saw volume increase, while 66 declined.
- Turnover: Despite a drop in traded volume to 359.82M from 418.43M, the market value traded increased by 4.07%, suggesting larger deals/higher value transactions—often a sign of institutional rotation into quality names.
- Sector Dynamics: Banks and telecoms dominated trade value and volume, but sector indices were mixed (see heatmap below).
- Unusual Volume: MTNN saw a +428% surge vs. 90D avg; NAHCO (+594%), CHAMS (+154%), TANTALIZER (+121%), WAPCO (+107%)—all attracted price action that could portend trend reversals or large players repositioning.
Top Daily Gainers & Losers
| Stock | % Change | RSI | MACD | 15/50DMA | YTD % |
|---|---|---|---|---|---|
| ABBEYBDS | +9.94% | 99.6 (extreme overbought) | 0.66 (bullish) | 15DMA (5.20) > 50DMA (3.95) | +147% |
| LEARNAFRCA | +8.33% | 36.5 | -0.16 | 15DMA (3.12) > 50DMA (3.61) | -27.8% |
| UNILEVER | -9.65% | 20.4 (oversold) | -0.89 (bearish) | 15DMA (37.4) > 50DMA (38.5) | +5.7% |
| NNFM | -9.97% | 89.7 | 3.88 | 15DMA (85.05) < 50DMA (78.43) | +79.9% |
| TIP | -9.57% | 70.1 | 0.15 | 15DMA (4.14) > 50DMA (3.91) | N/A |
Highlight: ABBEYBDS is exceptionally overbought (RSI 99.6), with positive momentum AND as the YTD top gainer—risk of profit-taking is high per technical exhaustion. UNILEVER features on both gainer list and bullish momentum table, but with deep oversold/contrarian signals.
Momentum Insights: Bullish & Bearish
| Bullish (Above 15DMA) | Bearish (Below 15DMA) | ||
|---|---|---|---|
| Stock | RSI | Stock | RSI |
| UNILEVER | 20.4 | NNFM | 89.7 |
| LEARNAFRCA | 36.5 | GUINEAINS | 50.5 |
| CHAMS | -- | WAPIC | 50.9 |
| -- | CAVERTON | 52.0 | |
- Extreme Bullish: ABBEYBDS shows classic bullish exhaustion (RSI 99.6 + price riding above both 15/50DMA). VFDGROUP (RSI 96.8, YTD +116%) also stands out.
- Bullish cross above 15DMA: Stocks like UNILEVER and LEARNAFRCA indicate potential relief rallies but need caution due to low RSI and weak price history.
- Bearish cross below 15DMA: Stocks like MBENEFIT, NNFM and CAVERTON signal downside volatility and are backed by negative 5D/MTD moves.
Contrarian Signals
- UNILEVER: Despite a +9.65% daily jump and a "bullish" cross above 15DMA, its RSI is deeply oversold (20.4) and MACD is negative—raising questions about the sustainability of the bounce. Momentum traders beware: this is not a classic breakout, more likely a dead cat bounce fueled by short covering.
- NNFM: Plunged -9.97% today and +79.95% YTD, but RSI now at 89.6 (extreme overbought) even as price collapses below the short-term 15DMA. Such disparity suggests distribution after a parabolic run—likely smart money exiting.
- LEARNAFRCA: Rallied +8.33% on weak YTD (-27.8%), low RSI (36.5), and negative long-term trend—possible short-term reversal but medium-term caution.
Sector Heatmaps & Technical Trends
| Sector | Sample Stock | % Chg Today | Institutional Activity | Volume (Unusual?) | Technical Trend |
|---|---|---|---|---|---|
| Banking | GTCO | -1.47% | High (institutional: 10.5%) | Normal | Crossed above 50DMA, RSI 62.5 |
| Consumer Goods | UNILEVER | +9.65% | Modest | Normal | Above 15DMA, RSI oversold |
| Telecom | MTNN | -0.16% | Modest | Unusual (+428%) | Normal |
| Transport | NAHCO | 0.00% | High | Unusual (+594%) | Broke below 15DMA, risk of distribution |
| Insurance | WAPIC | -8.85% | Low | Normal | Below 15DMA; RSI neutral |
Dividend-Beta Matrix – Defensive Opportunities
| Stock | Dividend Yield (%) | Beta | Momentum | Comment |
|---|---|---|---|---|
| AIICO | 4.13 | 1.33 | Neutral | Income + moderate risk; quietly trending up |
| NAHCO | 6.66 | 0.65 | Bearish (below 15DMA) | High dividend, low beta, but short-term caution |
| VFDGROUP | 0 | 0.11 | Bullish | Very low beta, high YTD return—a momentum low-risk play |
| DEAPCAP | 13.76 | 0.89 | Bearish | Illiquid, but attractive for yield seekers with patience |
| NSLTECH | 15.87 | 0.68 | Bullish (above 15DMA) | High-yield, but volatile price action |
- Note: Defensive, high-yield, low-beta names like NAHCO and NSLTECH are potential shelters in volatility, though technicals urge caution (esp. if they cross below moving averages).
Institutional Clustering Alerts
- ZENITHBANK: 20.17% of total institutional trade value (₦1.05B) and 5.77% of institutional volume—a clear target of big-money positioning. Watch for potential price leadership.
- GTCO: Strong institutional flows (₦1.15B, 10.6% institutional value share), moderate price performance—indicates possible sector rotation or accumulation.
- NAHCO: Unusually high institutional volume and trade count (2.97% volume vs. 1.8% trade count), with price stalling. Can foreshadow a breakout or a reversal depending on broader flows.
Top YTD Gainers and Losers (Tuesday Spotlight)
| YTD Top 5 Gainers | YTD Top 5 Losers | ||||||||||
|---|---|---|---|---|---|---|---|---|---|---|---|
| Stock | YTD% | DivY% | RSI | 15DMA/50DMA | Beta | Stock | YTD% | DivY% | RSI | 15DMA/50DMA | Beta |
| ABBEYBDS | +147 | 1.43 | 99.6 | 5.2 / 3.9 | 0.70 | SIAMLETF40 | -64.9 | 0 | 18.7 | 299/437 | 1.58 |
| VFDGROUP | +116 | 0 | 96.9 | 63.8/53.9 | 0.11 | OANDO | -42.2 | 1.15 | 28.3 | 43.6/54.7 | 1.12 |
| NNFM | +79.9 | 1.44 | 89.7 | 85.0/78.4 | 0.27 | RTBRISCOE | -30.5 | 4.35 | 35.3 | 2.26/2.46 | -0.16 |
| NGXGROUP | +15.6 | 2.73 | 65.8 | 31.7/30.8 | 0.31 | INTENEGINS | -20.9 | 3.4 | 32.8 | 1.62/1.93 | 0.01 |
| AIICO | +1.9 | 4.13 | 51.6 | 1.51/1.61 | 1.33 | DEAPCAP | -25.0 | 13.8 | 42.8 | 0.94/0.96 | 0.89 |
- Extremes: ABBEYBDS’s +147% and RSI at 99.6 is rare—approaching blow-off.
- SIAMLETF40 and OANDO: deeply oversold (RSI < 30), high volatility—possible for contrarian bounces but risk remains high.
- Overlaps: ABBEYBDS & NNFM both top gainer & on bullish/bearish tables—ripe for profit-taking watch.
- High-Yield, Defensive Losers: DEAPCAP & RTBRISCOE offer elevated yields but with persistent drawdown—good only for high-risk, income-focused investors.
Market Activity/Trades Summary: Retail vs Institutional
| Type | TradeCount | Volume(M) | Value (₦B) | % Trade Count | % Volume | % Value |
|---|---|---|---|---|---|---|
| Retail | 11,506 | 125.32 | 1.23 | 86.85% | 33.98% | 11.35% |
| Institutional | 1,742 | 243.46 | 9.64 | 13.15% | 66.02% | 88.65% |
- Institutions dominated value (88.65%) and volume (66%) with just 13% of total trades, confirming block trades driving main index names.
- Retail drove quantity but little value, focusing more on speculative, lower-priced stocks.
- Patterns: Banking heavyweights (GTCO, ZENITHBANK, UBA, ACCESSCORP) are top for both segments, but with much higher institutional loadings, signaling smart money's sustained interest (likely part of Q2 positioning and risk-off in growth stocks).
Top 5 Most Traded Symbols
| Investor Type | Symbol | Volume | Major % of Trade Value |
|---|---|---|---|
| Institutional | GTCO | 16.96M | 10.57% |
| Institutional | NAHCO | 10.95M | 6.02% |
| Institutional | ZENITHBANK | 21.28M | 9.70% |
| Institutional | UBA | 19.35M | 5.59% |
| Institutional | ACCESSCORP | 22.57M | 4.38% |
| Retail | ACCESSCORP | 5.48M | 1.07% |
| Retail | UBA | 2.63M | 0.76% |
| Retail | GTCO | 1.32M | 0.82% |
| Retail | ZENITHBANK | 1.84M | 0.84% |
| Retail | OANDO | 1.26M | 0.43% |
- Correlations: Leading banking stocks are at the epicenter of institutional trades, reinforcing their status as market sentiment proxies and liquidity magnets. This could drive "safety rotation” if economic/policy risks rise.
- Tactical Note: Institutions are leaning more on large cap, dividend payers or market leaders. This hints that upcoming earnings, dividend timelines or regulatory cues are shaping positioning.
Investor-Focused Insights & Trade Ideas
- Extreme Overbought/Profit-Taking Alert: ABBEYBDS, VFDGROUP, and NNFM are in rare territory (RSI >90, huge YTD gains). Investors should consider trailing stops or gradual scaling out.
- Yield + Value Play: NSLTECH, DEAPCAP, and NAHCO mix high dividend yield with low beta and modest volumes—attractive if looking for downside protection, but validate fundamentals before betting on long-term recovery. Watch for technical confirmation above key averages.
- Contrarian Longshot: UNILEVER and OANDO have deeply negative RSI and are short-term oversold. Risk-tolerant traders may look for quick bounces, but only with defined stops.
- Institutional Movers: ZENITHBANK and GTCO—follow the money. Rising block-trade interest and sector resilience often precede periods of index leadership, especially heading into dividend or half-year reports.
- Unusual Volume Watch: MTNN and NAHCO—big trades hint at news, corporate action, or fundamental catalysts. These are often harbingers of price trend shifts—monitor closely.
- Avoid Chasing Parabolic Names: Once RSI soars above 90 and volumes explode, the risk of sharp reversals rises.
Key Hidden Insight: Market leadership remains in transition with institutional players increasingly dictating sector moves. Extreme technical readings on several YTD leaders suggest a coming rotation—watch for capital moving into more quietly trending, high-yield, and low-beta names.
Tip for Next Session: History shows days after large unusual institutional volumes often feature follow-through in direction or sharp reversals on profit taking—review the price action in NAHCO, CHAMS, and MTNN for clues.
|
Top ASI Gainers Over Last 5 Trading Days
|
Top ASI Losers Over Last 5 Trading Days
|
For more detailed analysis, on InfoWARE Market Data Terminal <NSEPERF> <GO>
On InfoWARE Finance Mobile App (Android, iPhone & iPad, Windows Phone and Windows 8/10), "Top Gainers & Losers"
ABBEY BUILDING SOCIETY PLC (ABBEYBDS) topped the advancers list closing at N7.41 with a gain of 9.94% followed by UNILEVER NIGERIA PLC. (UNILEVER) which closed at N38.05 with a gain of 9.65%.
On the flip side N NIG. FLOUR MILLS PLC. (NNFM) and THE INITIATES PLC (TIP) topped the decliners log with a loss of -9.97% at a close of N79.00, and -9.57% to close the day at N4.25 respectively.
| Symbol | LClose | %Chg |
|---|---|---|
| ABBEYBDS | 7.41 | 9.94 |
| UNILEVER | 38.05 | 9.65 |
| LEARNAFRCA | 3.25 | 8.33 |
| NSLTECH | 0.58 | 7.41 |
| CONHALLPLC | 2.95 | 7.27 |
For more detailed analysis,
- On InfoWARE Market Data Terminal <TOPG> <GO>
- On InfoWARE Finance Mobile App ( Android, iPhone & iPad and Windows 10) , "Top Gainers & Losers"
Currency Market
In the currency market, the Naira was unchanged against the dollar at 1 to 1NSE: Bull Signal - Price crossed above 15 Day MA
This signal implies these stocks are under buying pressure and the price might continue to rise and therefore positions should be monitored closely. Further suggested analysis include looking at the overall market (ASI) to see if the uptrend is market wide, sector wide or specific to the stock. Portfolio managers tend to use this as a signal to do more research to add to their positions or lock in some profits. Typically further analysis should be done using commands like PC and RV on the InfoWARE Market Data Terminal. Another command is ALERTS to set price triggers for possible exit or entry as necessary
For more detailed analysis,
- On InfoWARE Market Data Terminal <NSEPERF> <GO>
- On InfoWARE Finance Mobile App ( Android , iPhone & iPad and Windows 10) , "Top Gainers & Losers"
| Symbol | Price | %Chg | 15DMA | PE | EPS | DivY | MktCap | Vol | Trades | Value | LstTradeTime |
|---|---|---|---|---|---|---|---|---|---|---|---|
| UNILEVER | 38.05 | 8.80 | 37.42 | 67.09 | 0.40 | 2.81 | 218.60B | 1.23M | 64.00 | 44.09M | 15-Apr-2025 14:31:03.817 |
| FGSUK2032S5 | 100.00 | 7.99 | 97.76 | 0.00 | 0.00 | 8.00 | 4.00 | 8.00K | 15-Apr-2025 14:31:15.913 | ||
| LEARNAFRCA | 3.25 | 7.69 | 3.12 | 5.79 | 0.51 | 8.53 | 2.51B | 341.46K | 30.00 | 1.11M | 15-Apr-2025 14:30:59.190 |
| CHAMS | 2.10 | 4.76 | 2.05 | 27.02 | 0.07 | 1.56 | 9.86B | 17.45M | 145.00 | 34.94M | 15-Apr-2025 14:31:55.653 |
| NGXMERIVAL | 10,290.34 | 0.74 | 10,228.45 | 12.13 | 38.38 | 0.00 | 0.00 | 151.55M | 3,858.00 | 3.95B | 15-Apr-2025 14:31:18.737 |
| NGXCNSMRGDS | 1,802.69 | 0.71 | 1,799.79 | 30.19 | 55.24 | 0.00 | 0.00 | 11.18M | 927.00 | 645.94M | 15-Apr-2025 14:31:18.160 |
| DANGSUGAR | 33.70 | 0.00 | 33.61 | 11.48 | 3.06 | 4.27 | 409.35B | 1.13M | 178.00 | 36.64M | 15-Apr-2025 14:30:57.397 |
NSE: BEAR Signal - Price crossed below 15 Day MA
This signal implies these stocks are under selling pressure and the price might continue to slide and therefore positions should be monitored closely. Further suggested analysis include looking at the overall market (ASI) to see if the downtrend is market wide, sector wide or specific to the stock. If the overal market trend is upwards, then since these stocks are heading in the opposite direction, then further analysis should be done using commands like PC and RV on the InfoWARE Market Data Terminal. Another command is ALERTS to set price triggers for possible exit is necessar
For more detailed analysis,
- On InfoWARE Market Data Terminal <BEARM> <GO>
- On InfoWARE Finance Mobile App ( Android , iPhone & iPad and Windows 10)
| Symbol | Price | %Chg | 15DMA | PE | EPS | DivY | MktCap | Vol | Trades | Value | LstTradeTime |
|---|---|---|---|---|---|---|---|---|---|---|---|
| NAHCO | 65.50 | 0.00 | 65.60 | 92.98 | 0.41 | 6.66 | 127.66B | 11.30M | 354.00 | 675.65M | 15-Apr-2025 14:30:59.937 |
| NGXAFRHDYI | 16,283.92 | -0.88 | 16,422.48 | 7.46 | 39.30 | 0.00 | 0.00 | 91.60M | 3,105.00 | 3.35B | 15-Apr-2025 14:31:18.027 |
| FGSUK2027S3 | 76.00 | -5.26 | 79.66 | 0.00 | 0.00 | 3.00 | 2.00 | 2.28K | 15-Apr-2025 14:31:15.890 | ||
| MBENEFIT | 0.86 | -5.81 | 0.92 | 5.43 | 0.11 | 3.28 | 17.25B | 3.00M | 28.00 | 2.62M | 15-Apr-2025 14:30:59.533 |
| NGXGROUP | 31.50 | -9.37 | 31.71 | 0.00 | 0.00 | 2.73 | 61.87B | 1.34M | 65.00 | 42.58M | 15-Apr-2025 14:31:55.823 |
| GUINEAINS | 0.63 | -9.52 | 0.68 | 66.79 | 0.01 | 1.96 | 3.87B | 1.11M | 29.00 | 712.30K | 15-Apr-2025 14:30:58.380 |
| WAPIC | 2.06 | -9.71 | 2.13 | 72.55 | 0.02 | 2.56 | 49.42B | 3.19M | 76.00 | 7.08M | 15-Apr-2025 14:31:04.617 |
| CAVERTON | 2.31 | -9.96 | 2.40 | 1.15 | 1.57 | 5.52 | 7.74B | 758.28K | 58.00 | 1.85M | 15-Apr-2025 14:30:56.760 |
| NNFM | 79.00 | -11.08 | 85.05 | 63.46 | 0.55 | 1.44 | 14.08B | 1.19M | 31.00 | 93.74M | 15-Apr-2025 14:31:01.107 |
| LAB2031S4 | 80.00 | -24.95 | 98.63 | 0.00 | 0.00 | 3.00 | 1.00 | 2.40K | 15-Apr-2025 14:31:16.177 |
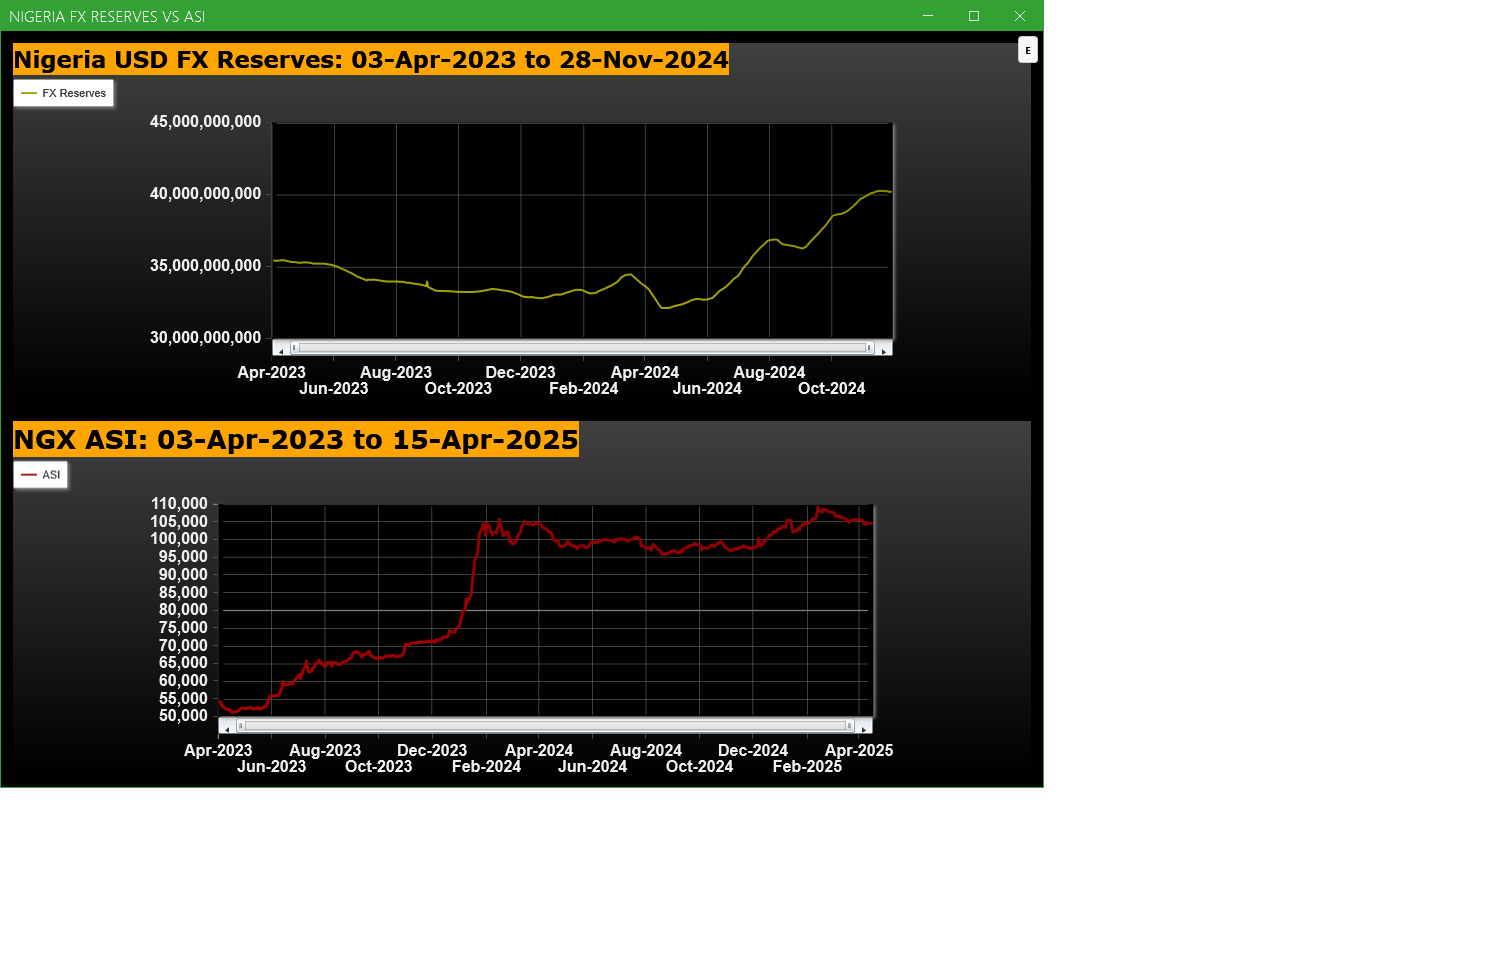
Economic Indicators - Nigeria FX Reserves Vs ASI Chart
Nigeria FX Reserves are assets held on reserve by CBN in foreign currencies. These reserves are used to back liabilities and influence monetary policy. Given the nature of the Nigeria economy, FX Reserves can appear to have an outsize influence on the economy and hence on the capital market. The chart below allows comparison of FX Reserves against the ASI to make investment decisions
For more detailed analysis,
- On InfoWARE Market Data Terminal <CI> <GO>
- On InfoWARE Finance Mobile App ( Android , iPhone & iPad and Windows 10) , "Research"
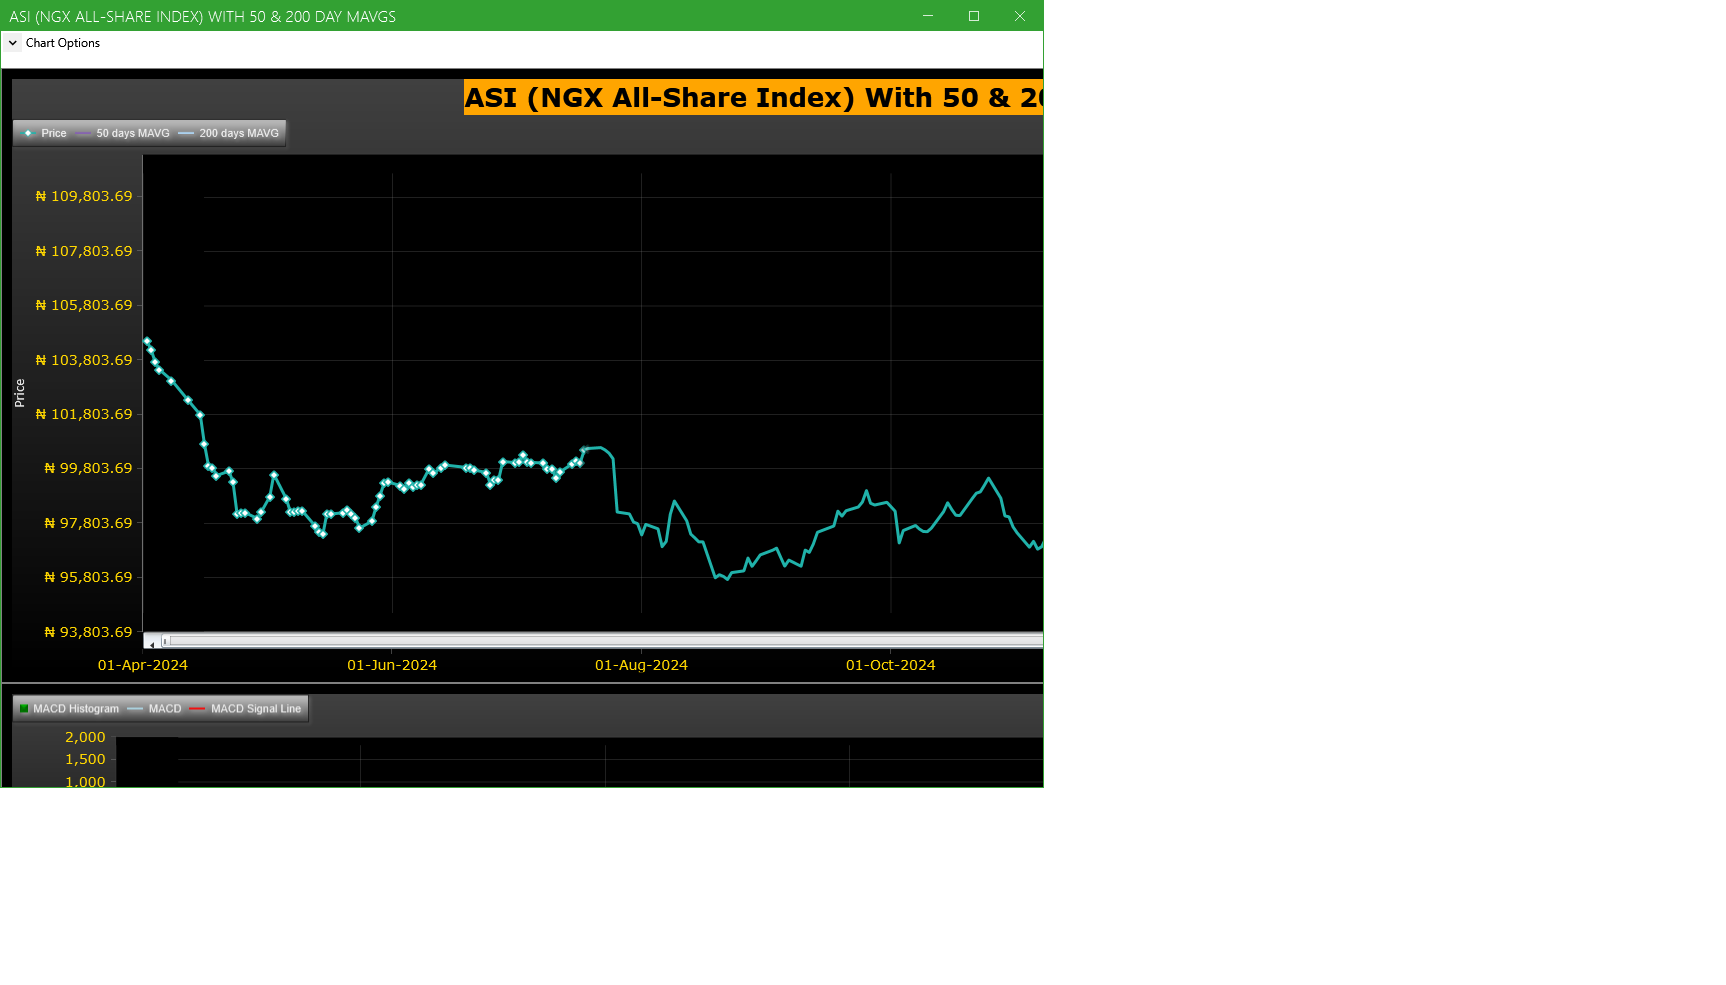
Market Trend - ASI (NGX All-Share-Index) With 50 & 200 Day MAvgs Chart
Technical traders typically use the 50 & 200 day moving averages to aid in choosing
where to enter or exit a position, which then causes these levels to act as strong
support or resistance. As a general guideline, if the price is above a moving average,
the trend is up. If the price is below a moving average, the trend is down.
It is important to note that critics of technical analysis say that moving averages act
as support and resistance because so many traders use these indicators to inform their
trading decisions. Also moving averages tend to work quite well in strong trending conditions
but poorly in choppy or ranging conditions.
Trading Strategies: Crossovers
Crossovers are one of the main moving average strategies. The first type is a price crossover,
which is when the price crosses above or below a moving average to signal a potential change
in trend. Another strategy is to apply two moving averages to a chart: one longer and one
shorter. When the shorter-term MA crosses above the longer-term MA, it is a buy signal, as
it indicates that the trend is shifting up. This is known as a golden cross. Meanwhile, when
the shorter-term MA crosses below the longer-term MA, it is a sell signal, as it indicates that
the trend is shifting down. This is known as a dead/death cross
For more detailed analysis,
- On InfoWARE Market Data Terminal <CI> <GO>
- On InfoWARE Finance Mobile App ( Android , iPhone & iPad and Windows 10) , "Research"
Unusual Volume: Volume traded is more than double the 90 day moving average (All exchanges; ASI & ASem). For more detailed analysis,
- On InfoWARE Market Data Terminal <UV> <GO>
- On InfoWARE Finance Mobile App ( Android , iPhone & iPad and Windows 10)
| Symbol | Name | Volume | 90DAvgVol | %VolChg | Price | LClose | %Chg | Trades | Value |
|---|---|---|---|---|---|---|---|---|---|
| CHAMS | CHAMS PLC | 17.45M | 6.86M | 154.21 | 2.10 | 2.00 | 5.00 | 145 | 34.94M |
| TANTALIZER | TANTALIZERS PLC | 17.24M | 7.82M | 120.61 | 2.50 | 2.65 | -5.66 | 141 | 43.36M |
| MTNN | MTN NIGERIA PLC | 11.30M | 2.14M | 428.18 | 243.00 | 243.40 | -0.16 | 398 | 2.74B |
| NAHCO | NIGERIAN AVIATION HANDLING COMPANY PLC | 11.30M | 1.63M | 594.79 | 65.50 | 65.50 | 0.00 | 354 | 675.65M |
| WAPCO | LAFARGE WAPCO PLC. | 5.41M | 2.61M | 107.20 | 71.50 | 71.50 | 0.00 | 222 | 383.26M |
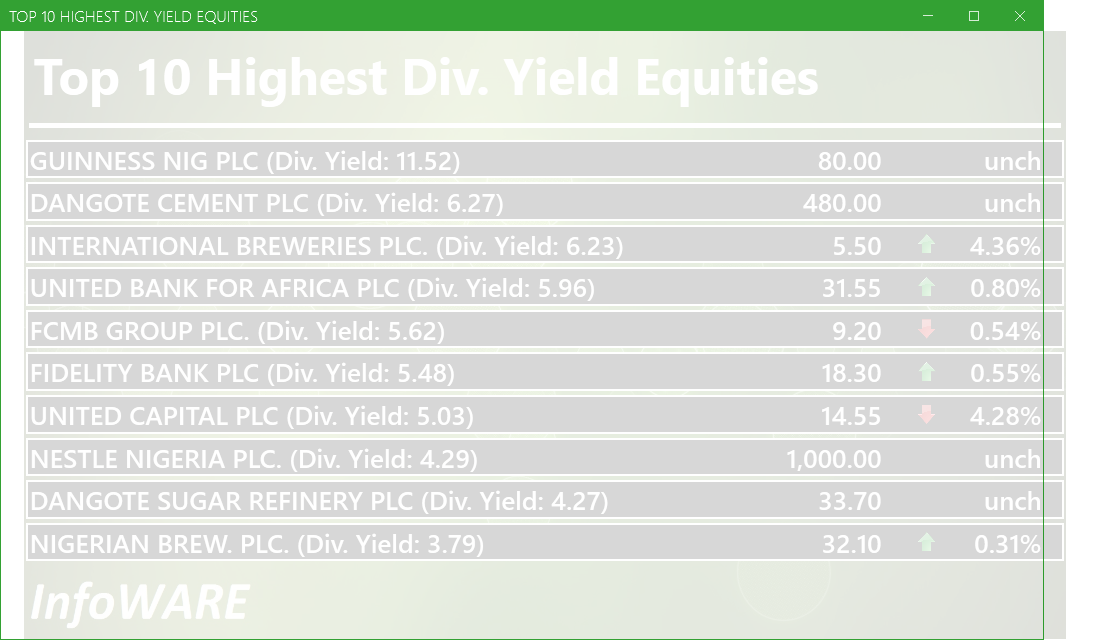
Investment Insights - High Div. Stocks
Dividend stocks distribute a portion of the company earnings to investors on a regular basis and they can a great choice for investors looking for regular income. As an investment or trading strategy, high dividend yield equities provide annual cash payments as against mostly capital gains in the price of a stock. The list in the table below represent the highest dividend paying stocks from the list of the most liquid stocks in the NSE top 30.
For more detailed analysis,
- On InfoWARE Market Data Terminal <HYIELD> <GO>
- On InfoWARE Finance Mobile App ( Android , iPhone & iPad and Windows 10) , "Research"
African Markets
| Name | LClose | Change | %Chg |
|---|---|---|---|
| BRVM Stock Exchange | 290.79 | 1.59 | 0.55 |
| Botswana Stock Exchange | 10,113.04 | 0.00 | 0.00 |
| Egyptian Exchange | 30,810.70 | 730.94 | 2.43 |
| Ghana Stock Exchange | 6,100.93 | 1.22 | 0.02 |
| Casablanca Stock Exchange | 16,070.49 | -306.24 | -1.87 |
| Malawi Stock Exchange | 294,562.18 | -1,837.68 | -0.62 |
| Nigeria Stock Exchange | 104,563.34 | -220.05 | -0.21 |
| Nairobi Securities Exchange | 126.78 | 1.02 | 0.81 |
| Rwanda Stock Exchange | 148.96 | 0.00 | 0.00 |
| Uganda Securities Exchange | 1,262.37 | -32.37 | -2.50 |
Nigeria Market Indexes
| Symbol | LClose | %Chg | WTD% | MTD% | QTD% | YTD% | MktCap | Trades |
|---|---|---|---|---|---|---|---|---|
| ASI | 104,560.02 | 0.03 | 0.03 | -0.94 | -0.94 | 1.34 | 12,168 | |
| NGX30 | 3,876.86 | 0.00 | 0.00 | -1.08 | -1.08 | 1.63 | 6,646 | |
| NGXAFRBVI | 2,569.99 | 0.09 | 0.09 | -3.50 | -3.50 | 3.60 | 3,277 | |
| NGXAFRHDYI | 16,283.92 | -0.88 | -0.88 | -2.16 | -2.16 | -4.37 | 3,105 | |
| NGXASEM | 1,588.92 | 0.00 | 0.00 | 0.06 | 0.06 | 0.33 | 3 | |
| NGXBNK | 1,113.08 | -0.11 | -0.11 | -4.11 | -4.11 | 2.36 | 3,526 | |
| NGXCG | 2,909.17 | -0.12 | -0.12 | -3.36 | -3.36 | 2.83 | 6,994 | |
| NGXCNSMRGDS | 1,802.69 | 0.72 | 0.72 | -0.71 | -0.71 | 3.94 | 927 | |
| NGXCOMMDTY | 1,002.53 | 0.00 | 0.00 | -0.10 | -0.10 | 0.25 | ||
| NGXGROWTH | 7,405.89 | -0.50 | -0.50 | 0.19 | 0.19 | -4.60 | 53 | |
| NGXINDUSTR | 3,473.19 | 0.00 | 0.00 | -0.48 | -0.48 | -2.76 | 540 | |
| NGXINS | 637.81 | 0.15 | 0.15 | -6.24 | -6.24 | -18.87 | 1,334 | |
| NGXLOTUSISLM | 7,458.57 | 0.02 | 0.02 | -1.27 | -1.27 | 7.04 | 1,754 | |
| NGXMAINBOARD | 5,026.81 | 0.04 | 0.04 | -0.68 | -0.68 | 0.46 | 8,983 | |
| NGXMERIGRW | 6,645.07 | 0.01 | 0.01 | -3.13 | -3.13 | 1.87 | 1,721 | |
| NGXMERIVAL | 10,290.34 | 0.75 | 0.75 | -0.03 | -0.03 | -1.34 | 3,858 | |
| NGXOILGAS | 2,413.09 | 0.00 | 0.00 | -1.37 | -1.37 | -10.99 | 214 | |
| NGXPENBRD | 1,873.29 | -0.01 | -0.01 | -0.82 | -0.82 | 2.27 | 10,090 | |
| NGXPENSION | 4,702.30 | -0.30 | -0.30 | -1.76 | -1.76 | 3.71 | 7,124 | |
| NGXPREMIUM | 10,076.15 | 0.01 | 0.01 | -0.88 | -0.88 | 3.53 | 3,132 | |
| NGXSOVBND | 651.45 | 0.36 | 0.36 | 3.92 | 3.92 | 8.30 | 1 |
For more detailed analysis,
- On InfoWARE Market Data Terminal <MKTINS> <GO>
- On InfoWARE Finance Mobile App ( Android, iPhone & iPad and Windows 10) , "Market Indexes"
Find the topic interesting? Will like to comment? Contact Us at solutions@infowarelimited.com
Top News

Daily Business News Brief

Chart Of The Day - ASI Chart Vs ASI Advance Decline Line (YTD) (15-Apr-2025 15:07:47.274)
InfoWARE AI Analyst Daily Market Report: 15-Apr-2025

[MERVALUE]>> DAILY INDICATIVE PRICES
[XNSA]>> APPOINTMENT OF A DIRECTOR (AVA SECURITIES LIMITED)
Breaking News! Unusual Volume Alert (15-Apr-2025 13:32:57.918)
Breaking News! Bulls Momentum Alert (15-Apr-2025 13:32:54.080)
Breaking News! Bears Momentum Alert (15-Apr-2025 13:32:53.968)
[NPFMCRFBK]>>Notice of Meeting -<NPF MICROFINANCE BANK PLC>
Daily Business News Brief
[NEWGOLD]>> DAILY INDICATIVE PRICES
[XNSA]>> NGX FIXED INCOME INDICATIVE PRICE LIST FOR APR 15, 2025
[VETGOODS]>> DAILY INDICATIVE PRICES
[XNSA]>> WEMA BANK PLC: ACTIVATION OF CODE FOR TRADING IN RIGHTS
[AIRTELAFRI]>>Corporate Disclosures-<Airtel Africa Plc>
[CWG]>>Corporate Disclosures-<CWG PLC>
[XNSA]>> DAILY FUND PRICE SUBMISSION - FCMB ASSET MANAGEMENT LIMITED
[STANBICETF30]>> DAILY INDICATIVE PRICES
[XNSA]>> NOTIFICATION OF PRICE ADJUSTMENT
MARKET PERFORMANCE REPORT & DAILY PRICE LIST
Chart Of The Day - ASI Chart Vs ASI Advance Decline Line (YTD) (14-Apr-2025 15:13:49.861)
InfoWARE AI Analyst Daily Market Report: 14-Apr-2025
[BERGER]>>Corporate Disclosures-<BERGER PAINTS NIGERIA PLC>
[NEIMETH]>>Notice of Meeting -<NEIMETH INTERNATIONAL PHARMACEUTICALS PLC>
[XNSA]>> CORDROS MILESTONE FUNDS' BID & OFFER PRICES
[MERROWTH]>> DAILY INDICATIVE PRICES
[AFRIPRUD]>>Notice of Meeting -<AFRICA PRUDENTIAL PLC>
[TANTALIZER]>>Notice of Meeting -<TANTALIZERS PLC>
[GEREGU]>>Corporate Disclosures-<GEREGU POWER PLC>
[XNSA]>> NGX FIXED INCOME INDICATIVE PRICE LIST FOR APR 14, 2025
Get IDIA - the stock trading app for the modern investor
Solutions by Business
Product Suites
Company
Contacts
- 8th Floor,
- South Atlantic Petroleum Towers,
- 1 Adeola Odeku Street,
- Victoria Island,
- Lagos, Nigeria.
- Email: solutions@infowarelimited.com
Follow Us
 |
 |
 |
 |