


InfoWARE AI Analyst Daily Market Report: 22-Apr-2025 | InfoWARE Finance
Get IDIA - the stock trading app for the modern investor


InfoWARE AI Analyst Daily Market Report: 22-Apr-2025
(Source: InfoWARE Terminal, Date: 22-Apr-2025)
Dear Investor,
NGX Market Summary – Tuesday, April 22, 2025
The NGX All Share Index (ASI) closed today up by 0.49% to 104,233.81, modestly extending the YTD gains to 1.52%.
Market breadth was robust at 1.83x with advancers clearly outpacing decliners (44 vs. 24), and the day was marked by active trading in brewers and select insurance names.
However, overall market turnover tapered off by -14.70% to ₦6.33B, and trading volume slipped slightly to 340.60M shares.
Notably, sector rotation and clear divergences were evident in the banking and insurance sectors. Contrarian and momentum signals are flashing in several names, offering trading opportunities as well as caution flags.
Key Insights & Noteworthy Trends
- Market Breadth: Bullish bias continues with advancing stocks strongly outnumbering decliners (44:24). Insurance and breweries led upside moves.
- Turnover: The -14.7% dip in turnover, despite robust market breadth, signals some profit-taking and potential investor caution. Short-term volume cooling may precede directional moves.
-
YTD Top Gainers & Losers – Last 5 Trading Days
Symbol Name Price 5D% YTD% RSI Div Yield Beta Tech Outlook ABBEYBDS ABBEY BUILDING SOCIETY PLC 9.76 8.93% 225.33% 99.82 1.43% 0.70 Strong Overbought, Multi-month High TIP THE INITIATES PLC 4.55 9.89% 100.0% 61.52 0.00% 0.00 Momentum Positive NB NIGERIAN BREW. PLC. 39.80 9.94% 24.38% 72.06 3.79% 0.78 RSI Overbought, Unusual Volume INTBREW INTERNATIONAL BREWERIES PLC. 6.05 10.00% 10.00% 63.71 6.23% 1.04 MACD Bullish, Volume Spike JAPAULGOLD JAPAUL GOLD & VENTURES PLC 2.13 9.79% -0.47% 50.52 0.90% 1.92 Mixed: Price Rally, YTD Negative -
YTD Top Losers (5-Day Window)
Symbol Name Price 5D% YTD% RSI Div Yield Beta Tech Outlook INTENEGINS INTL ENERGY INSURANCE 1.34 -9.46% -28.34% 32.75 3.40% 0.01 Low RSI, Bearish NSLTECH SECURE ELEC TECH 0.51 -8.93% -26.09% 49.19 15.87% 0.67 Bearish, High Yield UPL UNIVERSITY PRESS 3.10 -8.82% -19.48% 13.45 0.60% 0.47 Oversold, Under Pressure VETGRIF30 VETIVA GRIFFIN 30 ETF 36.90 -8.21% -2.25% 46.74 0.00% 0.71 Neutral, Weak Support FTNCOCOA FTN COCOA PROCESSORS 1.75 -7.41% -6.91% 59.43 1.60% 0.78 Volatile, At Key Level -
Unusual Volume & Standout Trades
- CHAMS: Trades at 308% of 90DMA volume, price +1.47% → Possible institutional accumulation / breakout play.
- INTBREW: Volume more than doubled, price up 10% → Uptrend with improving sentiment.
- NB: Massive 9.94% price surge on 114% above average volume, RSI 72.06 (overbought) → Potential for short-term mean reversion or further run fueled by momentum.
- ABBEYBDS: Entered parabolic territory: 225% YTD gain, volume up over 2242% of 90DMA → Caution warranted.
-
Momentum Table Snapshots
- 15DMA Cross Above: SOVRENINS, NEM, CHAMPION, UACN, CHAMS, CUSTODIAN – insurance sector strength reinforced!
- Bullish RSI > 70: ABBEYBDS (99.82), NB (72.06) – extremely overbought, profit-taking risk rises.
- 15DMA Cross Below (Bearish): FIDELITYBK, STERLINGNG, WAPIC, NSLTECH, DEAPCAP → selective banking names under pressure.
- Bearish RSI < 30: UPL (13.45), CAP (2.34) – severe oversold conditions, potential for tactical bounce if volume reverses.
Sector Heatmap
| Sector | Key Performer | Change | Bullish/Bearish | Volume Trend |
|---|---|---|---|---|
| Brewers (Beverages) | INTBREW, NB (both with volume spikes) | +10.00%, +9.94% | Bullish breakouts, caution for NB (overbought) | Exceptional (both >2x 90DMA) |
| Insurance | NEM, SOVRENINS, CORNERST | +5.15% to +9.65% | Bullish momentum (15DMA cross above), high dividend yields | Active volumes, sector breadth positive |
| Banking | Fidelity, Sterling, Zenith, GTCO (mixed moves) |
FIDELITYBK -2.94% (15DMA cross below) UBA +2.80% (rebound) |
Mixed-to-Bearish (banks under pressure, yet select rebounds) | Mixed (some profit-taking detected, institutional focus remains) |
| Diversified / Others | CHAMS, UACN | +1.45%, +3.96% | Bullish, Unusual vol in CHAMS | Volume very strong in CHAMS |
Dividend-Beta Matrix: Defensive Stock Scan
| Stock | Dividend Yield | Beta | Technical Bias |
|---|---|---|---|
| NEM | 6.52% | 0.69 | Momentum positive, breakout on 15DMA |
| FIDELITYBK | 5.48% | 0.89 | Bounced off support, but short-term bearish |
| SOVRENINS | 3.75% | 1.11 | 15DMA crossover, sector tailwinds |
| NSLTECH | 15.87% | 0.67 | Bearing downtrend, but exceptional yield |
| PRESTIGE | 2.50% | -0.17 | Bearish technicals, low beta |
Institutional Clustering Alerts
-
ZENITHBANK – Holds 13.59% of institutional trade value share. Substantial institutional interest—traders should watch for spillover effects following large block trades.
ACCESSCORP, FIDELITYBK – Together with ZENITH, dominate top 3 for institutional volume. However, technicals in FIDELITY and ZENITHBANK are weakening; caution if institutional sell pressure intensifies.
Contrarian Signals
- NB (Nigerian Breweries): RSI above 70 (72.06), but price is at a 5-day high with exceptionally strong volume—momentum is peaking, but could quickly reverse if traders rotate out. Momentum chasers beware.
- CHAMPION: RSI is neutral (44.81), but MACD shows mild positive cross and price is above the 15DMA—stock is rising despite muted momentum readings.
- CORNERST (Cornerstone Ins.): Oversold RSI (26.85) yet strong 5-day price gain (+9.65%); may soon run out of steam, possible mean reversion snapback.
- NSLTECH: Extremely high dividend yield (15.87%), but bearish momentum (price below 15DMA, downtrend persists). Beware "yield traps."
- UPL: RSI deeply oversold (13.45) and sustained selloff may prompt value bargain hunting if volume stabilizes.
Market Activity and Trades Summary
-
Retail vs. Institutional:
- Retail dominated trade count (89.8%), but institutions accounted for 64.3% of volume and 83.2% of trade value.
- Top Institutional Traded: ACCESSCORP, ZENITHBANK, FIDELITYBK, GTCO, UBA – major banks, indicating institutions are tactically rotating capital among tier-1 names.
- Top Retail Traded: ACCESSCORP, ZENITHBANK, UBA, GTCO, FIRSTHOLDCO — substantial retail participation mirrors institutional activity in financials.
- Banking sector remains market anchor for both retail and institutional flows, but technical signals now mixed to negative.
- Patterns: High institutional concentration in ACCESSCORP and ZENITHBANK, but weakening technicals suggest watching for institutional risk-off moves, especially if sector leadership wobbles.
Trader Suggestions & Opportunities
- Momentum Long: NEM, SOVRENINS, INTBREW — all with positive 15DMA cross, solid dividend yields, and sector breadth. Trailing stops advised due to strong runups and possible overbought signals.
- Mean Reversion / Tactical Short: NB (overbought with RSI>70 and huge vol), ABBEYBDS (hyperextended), CORNERST (bull rally but RSI now oversold territory).
- Contrarian Potential Long: UPL (ultra-low RSI), FIDELITYBK (recent support), if volume stabilizes or reverses.
- Yield-focused Investors: NSLTECH, despite negative momentum, offers top yield for risk-tolerant balanced portfolios but is high risk; watch for base formation signals.
- Sector Rotation: Insurance names (NEM, SOVRENINS) are outperforming and have defensive profiles; monitor for follow-through.
- Caution on Banking Heavyweights: Technicals are weakening in major banks (ZENITH, GTCO, FIDELITYBK), though volume remains large from both institutional and retail participants. Watch for confirmation before aggressive positions.
Currency Market Note
The Naira continued to soften, falling -0.05% to 1,605/$; currency weakness could start to weigh on equities (especially import-heavy sectors) if trend accelerates.
|
Top ASI Gainers Over Last 5 Trading Days
|
Top ASI Losers Over Last 5 Trading Days
|
For more detailed analysis, on InfoWARE Market Data Terminal <NSEPERF> <GO>
On InfoWARE Finance Mobile App (Android, iPhone & iPad, Windows Phone and Windows 8/10), "Top Gainers & Losers"
INTERNATIONAL BREWERIES PLC. (INTBREW) topped the advancers list closing at N6.05 with a gain of 10.00% followed by NIGERIAN BREW. PLC. (NB) which closed at N39.80 with a gain of 9.94%.
On the flip side INTERNATIONAL ENERGY INSURANCE COMPANY PLC (INTENEGINS) and SECURE ELECTRONIC TECHNOLOGY PLC (NSLTECH) topped the decliners log with a loss of -9.46% at a close of N1.34, and -8.93% to close the day at N0.51 respectively.
| Symbol | LClose | %Chg |
|---|---|---|
| INTBREW | 6.05 | 10.00 |
| NB | 39.80 | 9.94 |
| TIP | 5.00 | 9.89 |
| JAPAULGOLD | 2.13 | 9.79 |
| CORNERST | 2.84 | 9.65 |
| Symbol | LClose | %Chg |
|---|---|---|
| INTENEGINS | 1.34 | -9.46 |
| NSLTECH | 0.51 | -8.93 |
| UPL | 3.10 | -8.82 |
| VETGRIF30 | 36.90 | -8.21 |
| FTNCOCOA | 1.75 | -7.41 |
For more detailed analysis,
- On InfoWARE Market Data Terminal <TOPG> <GO>
- On InfoWARE Finance Mobile App ( Android, iPhone & iPad and Windows 10) , "Top Gainers & Losers"
Currency Market
In the currency market, the Naira fell 0.05%(-0.87) against the Dollar to settle at 1 to 1NSE: Bull Signal - Price crossed above 15 Day MA
This signal implies these stocks are under buying pressure and the price might continue to rise and therefore positions should be monitored closely. Further suggested analysis include looking at the overall market (ASI) to see if the uptrend is market wide, sector wide or specific to the stock. Portfolio managers tend to use this as a signal to do more research to add to their positions or lock in some profits. Typically further analysis should be done using commands like PC and RV on the InfoWARE Market Data Terminal. Another command is ALERTS to set price triggers for possible exit or entry as necessary
For more detailed analysis,
- On InfoWARE Market Data Terminal <NSEPERF> <GO>
- On InfoWARE Finance Mobile App ( Android , iPhone & iPad and Windows 10) , "Top Gainers & Losers"
| Symbol | Price | %Chg | 15DMA | PE | EPS | DivY | MktCap | Vol | Trades | Value | LstTradeTime |
|---|---|---|---|---|---|---|---|---|---|---|---|
| SOVRENINS | 0.95 | 6.32 | 0.93 | 27.95 | 0.03 | 3.75 | 10.80B | 4.07M | 41.00 | 3.73M | 22-Apr-2025 14:31:00.820 |
| NEM | 13.60 | 5.15 | 13.12 | 24.99 | 0.37 | 6.52 | 68.22B | 2.35M | 81.00 | 30.21M | 22-Apr-2025 14:30:59.093 |
| CHAMPION | 3.95 | 5.06 | 3.86 | 412.83 | 0.01 | 0.41 | 30.93B | 1.23M | 31.00 | 4.78M | 22-Apr-2025 14:30:52.740 |
| UACN | 30.30 | 3.96 | 29.96 | 9.38 | 2.35 | 1.00 | 88.66B | 752.74K | 49.00 | 22.72M | 22-Apr-2025 14:31:01.963 |
| NGXAFRHDYI | 16,667.51 | 2.38 | 16,375.96 | 7.46 | 39.30 | 0.00 | 0.00 | 60.45M | 2,890.00 | 2.15B | 22-Apr-2025 14:31:12.733 |
| ELLAHLAKES | 3.11 | 1.93 | 3.07 | 0.00 | 0.00 | 0.00 | 6.22B | 3.51M | 113.00 | 10.82M | 22-Apr-2025 14:30:54.243 |
| NGXMERIVAL | 10,158.79 | 1.45 | 10,149.44 | 12.13 | 38.38 | 0.00 | 0.00 | 122.17M | 4,156.00 | 3.29B | 22-Apr-2025 14:31:13.057 |
| CHAMS | 2.07 | 1.45 | 2.04 | 27.02 | 0.07 | 1.56 | 9.72B | 29.70M | 176.00 | 63.57M | 22-Apr-2025 14:30:53.340 |
| NGXMAINBOARD | 5,054.71 | 0.58 | 5,034.33 | 12.90 | 225.05 | 0.00 | 0.00 | 261.85M | 9,096.00 | 3.69B | 22-Apr-2025 14:31:13.010 |
| CUSTODIAN | 18.00 | 0.56 | 17.93 | 3.80 | 3.29 | 1.20 | 105.87B | 1.37M | 72.00 | 24.75M | 22-Apr-2025 14:30:53.767 |
| NGXPREMIUM | 10,095.22 | 0.32 | 10,091.99 | 2,048.74 | 238.70 | 0.00 | 0.00 | 76.63M | 3,371.00 | 2.63B | 22-Apr-2025 14:31:13.360 |
| JOHNHOLT | 7.75 | 0.00 | 7.74 | 8.80 | 0.91 | 1.25 | 3.02B | 44.42K | 22.00 | 326.72K | 22-Apr-2025 14:30:57.970 |
NSE: BEAR Signal - Price crossed below 15 Day MA
This signal implies these stocks are under selling pressure and the price might continue to slide and therefore positions should be monitored closely. Further suggested analysis include looking at the overall market (ASI) to see if the downtrend is market wide, sector wide or specific to the stock. If the overal market trend is upwards, then since these stocks are heading in the opposite direction, then further analysis should be done using commands like PC and RV on the InfoWARE Market Data Terminal. Another command is ALERTS to set price triggers for possible exit is necessar
For more detailed analysis,
- On InfoWARE Market Data Terminal <BEARM> <GO>
- On InfoWARE Finance Mobile App ( Android , iPhone & iPad and Windows 10)
| Symbol | Price | %Chg | 15DMA | PE | EPS | DivY | MktCap | Vol | Trades | Value | LstTradeTime |
|---|---|---|---|---|---|---|---|---|---|---|---|
| DEAPCAP | 0.94 | -2.13 | 0.95 | 188.84 | 0.01 | 13.76 | 1.41B | 648.36K | 30.00 | 573.22K | 22-Apr-2025 14:30:54.070 |
| FIDELITYBK | 18.70 | -2.94 | 18.84 | 13.24 | 1.17 | 5.48 | 541.83B | 34.59M | 516.00 | 651.85M | 22-Apr-2025 14:31:43.900 |
| PRESTIGE | 0.95 | -4.21 | 0.97 | 10.49 | 0.08 | 2.50 | 12.59B | 650.66K | 31.00 | 620.15K | 22-Apr-2025 14:31:00.267 |
| STERLINGNG | 5.05 | -4.95 | 5.19 | 15.75 | 0.30 | 3.19 | 145.39B | 2.68M | 154.00 | 13.90M | 22-Apr-2025 14:31:01.060 |
| WAPIC | 2.06 | -5.83 | 2.10 | 72.55 | 0.02 | 2.56 | 49.42B | 946.61K | 63.00 | 1.98M | 22-Apr-2025 14:31:02.820 |
| NSLTECH | 0.51 | -9.80 | 0.53 | 0.00 | 0.00 | 15.87 | 2.87B | 2.38M | 37.00 | 1.23M | 22-Apr-2025 14:30:59.513 |
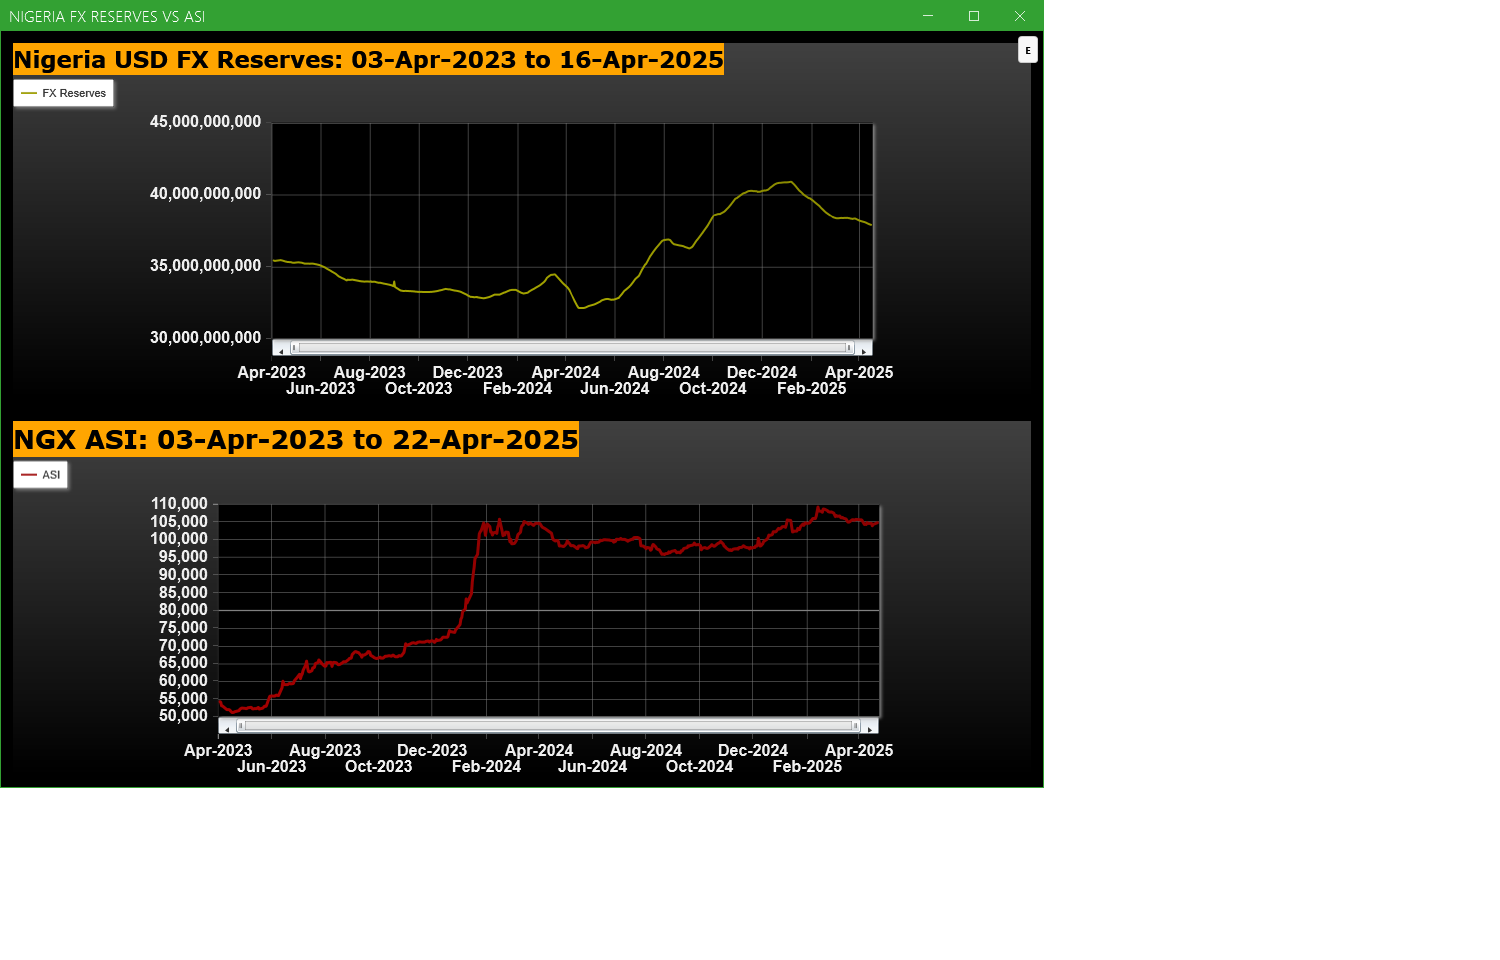
Economic Indicators - Nigeria FX Reserves Vs ASI Chart
Nigeria FX Reserves are assets held on reserve by CBN in foreign currencies. These reserves are used to back liabilities and influence monetary policy. Given the nature of the Nigeria economy, FX Reserves can appear to have an outsize influence on the economy and hence on the capital market. The chart below allows comparison of FX Reserves against the ASI to make investment decisions
For more detailed analysis,
- On InfoWARE Market Data Terminal <CI> <GO>
- On InfoWARE Finance Mobile App ( Android , iPhone & iPad and Windows 10) , "Research"
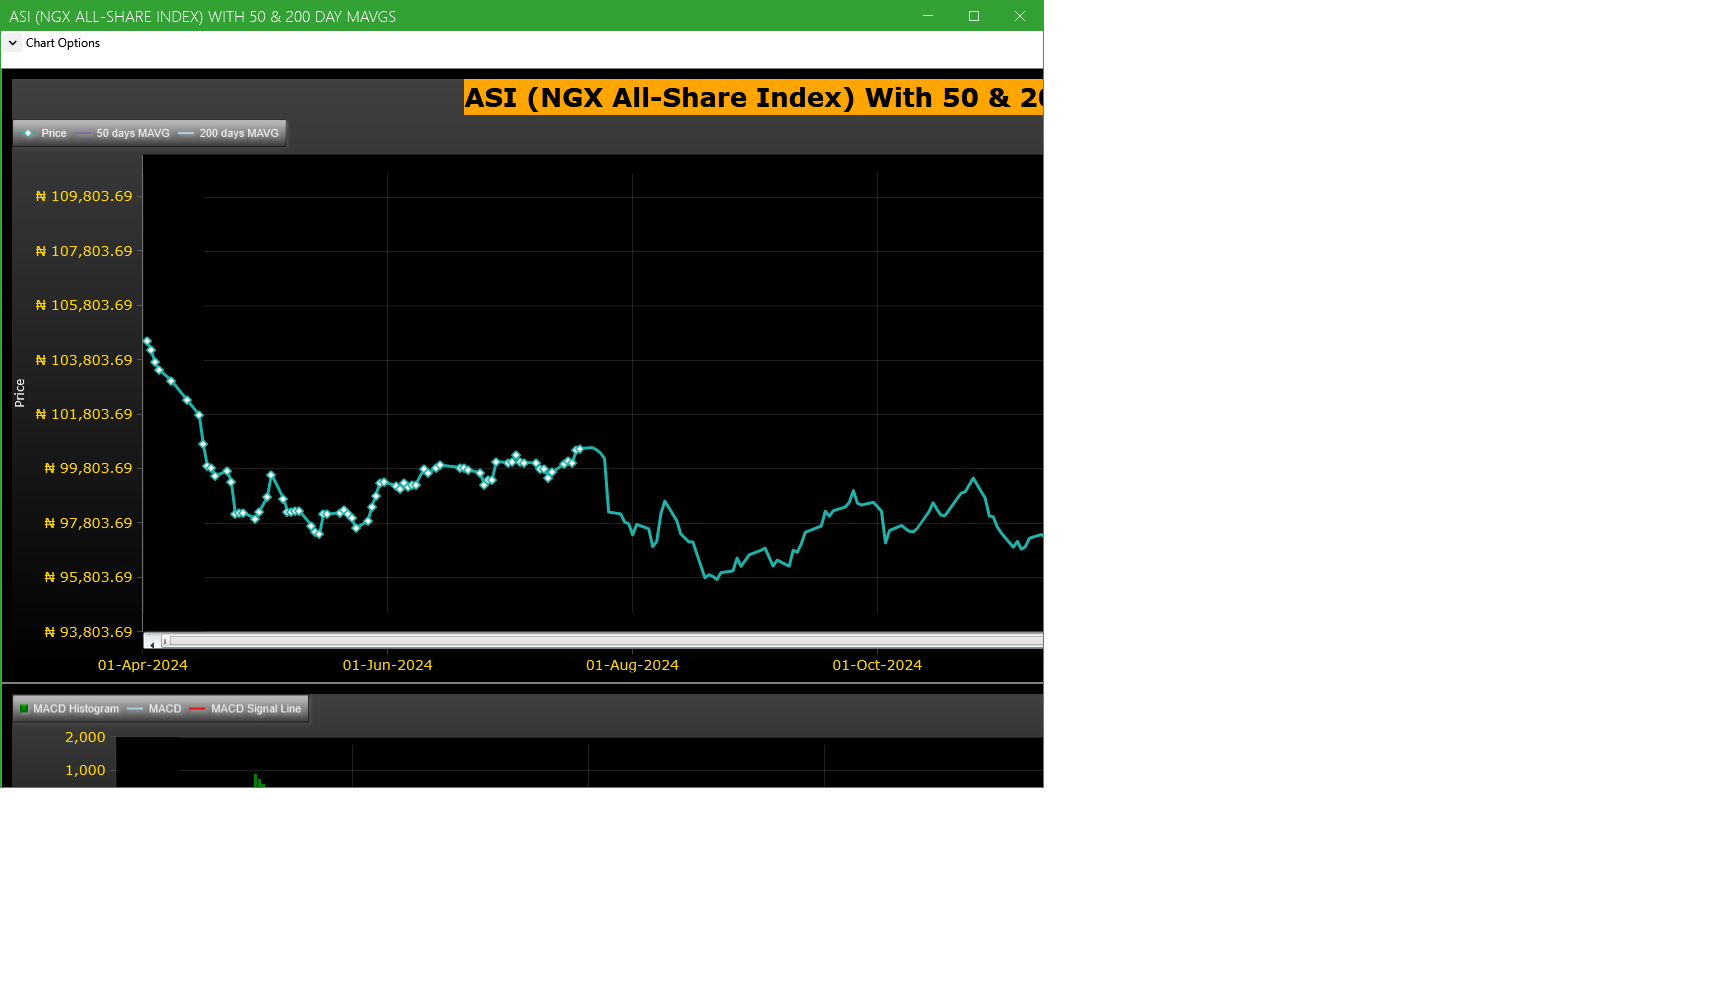
Market Trend - ASI (NGX All-Share-Index) With 50 & 200 Day MAvgs Chart
Technical traders typically use the 50 & 200 day moving averages to aid in choosing
where to enter or exit a position, which then causes these levels to act as strong
support or resistance. As a general guideline, if the price is above a moving average,
the trend is up. If the price is below a moving average, the trend is down.
It is important to note that critics of technical analysis say that moving averages act
as support and resistance because so many traders use these indicators to inform their
trading decisions. Also moving averages tend to work quite well in strong trending conditions
but poorly in choppy or ranging conditions.
Trading Strategies: Crossovers
Crossovers are one of the main moving average strategies. The first type is a price crossover,
which is when the price crosses above or below a moving average to signal a potential change
in trend. Another strategy is to apply two moving averages to a chart: one longer and one
shorter. When the shorter-term MA crosses above the longer-term MA, it is a buy signal, as
it indicates that the trend is shifting up. This is known as a golden cross. Meanwhile, when
the shorter-term MA crosses below the longer-term MA, it is a sell signal, as it indicates that
the trend is shifting down. This is known as a dead/death cross
For more detailed analysis,
- On InfoWARE Market Data Terminal <CI> <GO>
- On InfoWARE Finance Mobile App ( Android , iPhone & iPad and Windows 10) , "Research"
Unusual Volume: Volume traded is more than double the 90 day moving average (All exchanges; ASI & ASem). For more detailed analysis,
- On InfoWARE Market Data Terminal <UV> <GO>
- On InfoWARE Finance Mobile App ( Android , iPhone & iPad and Windows 10)
| Symbol | Name | Volume | 90DAvgVol | %VolChg | Price | LClose | %Chg | Trades | Value |
|---|---|---|---|---|---|---|---|---|---|
| CHAMS | CHAMS PLC | 29.70M | 7.27M | 308.43 | 2.07 | 2.04 | 1.47 | 176 | 63.57M |
| NB | NIGERIAN BREW. PLC. | 11.90M | 5.56M | 113.93 | 39.80 | 36.20 | 9.94 | 221 | 473.56M |
| INTBREW | INTERNATIONAL BREWERIES PLC. | 4.30M | 2.10M | 105.00 | 6.05 | 5.50 | 10.00 | 93 | 25.89M |
| ABBEYBDS | ABBEY BUILDING SOCIETY PLC | 3.93M | 167.85K | 2,242.86 | 9.76 | 8.96 | 8.93 | 123 | 38.50M |
| NGXGROUP | NIGERIAN EXCHANGE GROUP | 3.50M | 1.55M | 126.43 | 33.75 | 33.50 | 0.75 | 67 | 114.92M |
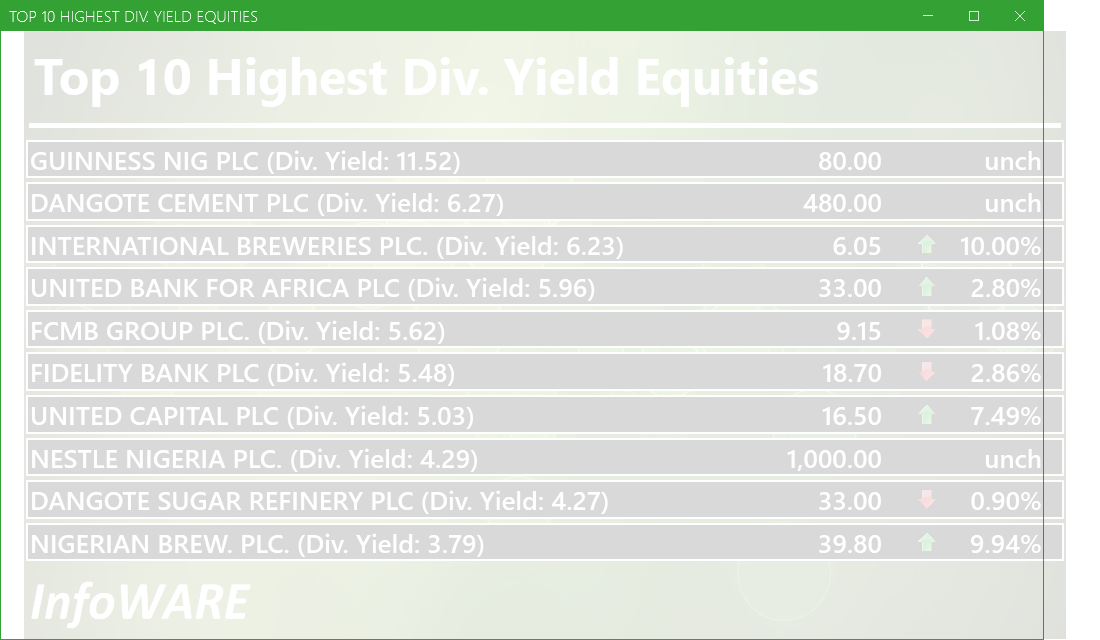
Investment Insights - High Div. Stocks
Dividend stocks distribute a portion of the company earnings to investors on a regular basis and they can a great choice for investors looking for regular income. As an investment or trading strategy, high dividend yield equities provide annual cash payments as against mostly capital gains in the price of a stock. The list in the table below represent the highest dividend paying stocks from the list of the most liquid stocks in the NSE top 30.
For more detailed analysis,
- On InfoWARE Market Data Terminal <HYIELD> <GO>
- On InfoWARE Finance Mobile App ( Android , iPhone & iPad and Windows 10) , "Research"
African Markets
| Name | LClose | Change | %Chg |
|---|---|---|---|
| BRVM Stock Exchange | 290.79 | 1.59 | 0.55 |
| Botswana Stock Exchange | 10,113.04 | 0.00 | 0.00 |
| Egyptian Exchange | 30,810.70 | 730.94 | 2.43 |
| Ghana Stock Exchange | 6,100.93 | 1.22 | 0.02 |
| Casablanca Stock Exchange | 16,070.49 | -306.24 | -1.87 |
| Malawi Stock Exchange | 294,562.18 | -1,837.68 | -0.62 |
| Nigeria Stock Exchange | 104,563.34 | -220.05 | -0.21 |
| Nairobi Securities Exchange | 126.78 | 1.02 | 0.81 |
| Rwanda Stock Exchange | 148.96 | 0.00 | 0.00 |
| Uganda Securities Exchange | 1,262.37 | -32.37 | -2.50 |
Nigeria Market Indexes
| Symbol | LClose | %Chg | WTD% | MTD% | QTD% | YTD% | MktCap | Trades |
|---|---|---|---|---|---|---|---|---|
| ASI | 104,744.98 | 0.49 | 0.00 | -0.76 | -0.76 | 1.52 | 12,561 | |
| NGX30 | 3,883.57 | 0.50 | 0.00 | -0.91 | -0.91 | 1.80 | 6,978 | |
| NGXAFRBVI | 2,458.05 | 2.15 | 0.00 | -7.70 | -7.70 | -0.92 | 3,184 | |
| NGXAFRHDYI | 16,667.51 | 2.44 | 0.00 | 0.14 | 0.14 | -2.11 | 2,890 | |
| NGXASEM | 1,590.30 | 0.09 | 0.00 | 0.15 | 0.15 | 0.42 | 6 | |
| NGXBNK | 1,082.83 | 0.71 | 0.00 | -6.72 | -6.72 | -0.42 | 3,712 | |
| NGXCG | 2,881.98 | 0.97 | 0.00 | -4.27 | -4.27 | 1.86 | 6,882 | |
| NGXCNSMRGDS | 1,877.13 | 2.57 | 0.00 | 3.39 | 3.39 | 8.23 | 1,368 | |
| NGXCOMMDTY | 1,002.53 | 0.00 | 0.00 | -0.10 | -0.10 | 0.25 | ||
| NGXGROWTH | 7,468.41 | 0.47 | 0.00 | 1.03 | 1.03 | -3.79 | 94 | |
| NGXINDUSTR | 3,476.34 | 0.09 | 0.00 | -0.39 | -0.39 | -2.67 | 570 | |
| NGXINS | 637.61 | 2.16 | 0.00 | -6.27 | -6.27 | -18.90 | 1,125 | |
| NGXLOTUSISLM | 7,453.08 | 0.19 | 0.00 | -1.34 | -1.34 | 6.96 | 1,653 | |
| NGXMAINBOARD | 5,054.71 | 0.58 | 0.00 | -0.13 | -0.13 | 1.01 | 9,096 | |
| NGXMERIGRW | 6,952.93 | -0.14 | 0.00 | 1.35 | 1.35 | 6.59 | 1,685 | |
| NGXMERIVAL | 10,158.79 | 1.47 | 0.00 | -1.31 | -1.31 | -2.60 | 4,156 | |
| NGXOILGAS | 2,419.82 | -0.11 | 0.00 | -1.09 | -1.09 | -10.75 | 225 | |
| NGXPENBRD | 1,887.94 | 0.37 | 0.00 | -0.04 | -0.04 | 3.07 | 10,026 | |
| NGXPENSION | 4,775.41 | 0.61 | 0.00 | -0.23 | -0.23 | 5.32 | 7,511 | |
| NGXPREMIUM | 10,095.22 | 0.32 | 0.00 | -0.69 | -0.69 | 3.72 | 3,371 | |
| NGXSOVBND | 651.61 | 0.00 | 0.00 | 3.95 | 3.95 | 8.32 | 0 |
For more detailed analysis,
- On InfoWARE Market Data Terminal <MKTINS> <GO>
- On InfoWARE Finance Mobile App ( Android, iPhone & iPad and Windows 10) , "Market Indexes"
Find the topic interesting? Will like to comment? Contact Us at solutions@infowarelimited.com
Top News

Chart Of The Day - ASI Chart Vs ASI Advance Decline Line (YTD) (22-Apr-2025 15:16:23.973)
InfoWARE AI Analyst Daily Market Report: 22-Apr-2025

[CHAMPION]>>Notice of Meeting -<CHAMPION BREW. PLC.>
[NEM]>>Notice of Meeting -<NEM INSURANCE PLC.>
[XNSA]>> DAILY FUND PRICE SUBMISSION - FCMB ASSET MANAGEMENT LIMITED
[XNSA]>> EMERGING AFRICA DAILY MUTUAL FUND PRICES
[XNSA]>> FACTS BEHIND THE RIGHTS ISSUE PRESENTATION BY WEMA BANK PLC
[VETINDETF]>> DAILY INDICATIVE PRICES
[XNSA]>> NGX FIXED INCOME INDICATIVE PRICE LIST FOR APR 22, 2025
[XNSA]>> WEMA BANK PLC: ACTIVATION OF CODE FOR TRADING IN RIGHTS
[XNSA]>> RECLASSIFICATION OF GOLDEN GUINEA BREWERIES PLC FROM LOW PRICE STOCK GR
[XNSA]>> RECLASSIFICATION OF JOHN HOLT PLC FROM LOW PRICE STOCK GROUP TO MEDIUM
[AIRTELAFRI]>>Corporate Disclosures-<Airtel Africa Plc>
[JOHNHOLT]>>Corporate Disclosures-<JOHN HOLT PLC.>
[STANBICETF30]>> DAILY INDICATIVE PRICES
[XNSA]>> NOTIFICATION OF PRICE ADJUSTMENT
[XNSA]>> BEHIND THE LISTING PRESENTATION AND CLOSING GONG CEREMONY
InfoWARE AI Analyst Daily Market Report: 17-Apr-2025
InfoWARE AI Analyst Weekly Market Report: 17-Apr-2025
InfoWARE AI Analyst Daily Market Report: 17-Apr-2025
Chart Of The Day - ASI Chart Vs ASI Advance Decline Line (YTD) (17-Apr-2025 15:13:14.880)
InfoWARE AI Analyst Daily Market Report: 17-Apr-2025
[ABCTRANS]>>Notice of Meeting -<ABC TRANSPORT PLC>
[MEYER]>>Notice of Meeting -<MEYER PLC>
[OKOMUOIL]>>Notice of Meeting -<OKOMU OIL PALM PLC.>
[MERGROWTH]>> DAILY INDICATIVE PRICES
[XNSA]>> DAILY FUND PRICE SUBMISSION - FCMB ASSET MANAGEMENT LIMITED
[XNSA]>> PUBLIC HOLIDAY
[XNSA]>> FACTS BEHIND THE RIGHTS ISSUE PRESENTATION BY WEMA BANK PLC
[AIRTELAFRI]>>Corporate Disclosures-<Airtel Africa Plc>
Get IDIA - the stock trading app for the modern investor
Solutions by Business
Product Suites
Company
Contacts
- 8th Floor,
- South Atlantic Petroleum Towers,
- 1 Adeola Odeku Street,
- Victoria Island,
- Lagos, Nigeria.
- Email: solutions@infowarelimited.com
Follow Us
 |
 |
 |
 |