


InfoWARE AI Analyst Daily Market Report: 17-Apr-2025 | InfoWARE Finance
Get IDIA - the stock trading app for the modern investor


InfoWARE AI Analyst Daily Market Report: 17-Apr-2025
(Source: InfoWARE Terminal, Date: 17-Apr-2025)
Dear Investor,
NGX Market Summary – Thursday, April 17, 2025
The NGX All Share Index (ASI) gained 0.38% today, closing at 103,851.88, while the year-to-date (YTD) return stands at 1.03%. Despite the positive index, market turnover fell significantly by 42.26%, signaling a reduction in trade value amidst solid trading volumes that rose to 370.58M shares. Market breadth was perfectly balanced with 25 advancers and 25 decliners, hinting at underlying sector rotation and a tug-of-war between bulls and bears. ABBEYBDS stole the spotlight, soaring just under 10%, reflecting ongoing momentum, while heavyweights like MTNN experienced subdued trading pressure. With volume up in 74 stocks but fewer naira exchanged, liquidity appears to be rotating and concentration risk is rising. Unusual volume spikes in insurance and breweries plus technical signals on both bullish and bearish breakouts warrant close attention.
Market Breadth & Notable Trends
- Market Breadth: A balanced 1:1 advancer-decliner ratio (25 up, 25 down) suggests underlying indecision and potential for increased volatility near-term.
- Volume Action: Total traded shares increased 8.44% from the previous day, even as value traded declined (-42.26%), signaling smaller-ticke trades and possible retail-driven churn.
- Unusual Volume:
- UNIVINSURE traded 481% above its 90-day average.
- NB also saw a near triple volume spike, suggesting institutional or speculative flows.
- NGXGROUP, REGALINS, and MTNN all posted volumes 164% to 347% above normal — a classic sign that those names could see outsized moves in coming sessions.
- Turnover Concentration: Institutional trades yielded 86.49% of total trade value, despite just 11% of trade count, highlighting persistent "smart money" dominance in large caps and banking sector names.
Top Gainers & Losers (Day)
| Symbol | Name | % Change | RSI | MACD | Beta |
|---|---|---|---|---|---|
| ABBEYBDS | ABBEY BUILDING SOCIETY PLC | +9.94% | 99.63 | 0.66 | 0.70 |
| NB | NIGERIAN BREW. PLC. | +9.86% | 40.56 | -0.24 | 0.79 |
| ABCTRANS | ASSOCIATED BUS COMPANY PLC | +9.23% | 36.79 | -0.03 | 0.01 |
| LIVESTOCK | LIVESTOCK FEEDS PLC. | +9.20% | 55.31 | 0.10 | 0.46 |
| ETI | ECOBANK TRANSNATIONAL INCORPORATED | +8.94% | 25.15 | -0.84 | 0.39 |
| SUNUASSUR | SUNU ASSURANCES NIGERIA PLC. | -9.91% | 48.94 | -0.02 | 0.27 |
| ELLAHLAKES | ELLAH LAKES PLC. | -9.76% | 57.35 | -0.03 | 0.32 |
| CORNERST | CORNERSTONE INSURANCE | -9.44% | 36.23 | -0.13 | 0.93 |
| SOVRENINS | SOVEREIGN TRUST INSURANCE PLC | -9.18% | 46.24 | -0.04 | 1.12 |
| UNIVINSURE | UNIV. INS. CO PLC | -7.55% | 43.80 | -0.03 | 0.83 |
Key Highlights:
- ABBEYBDS continues to steamroll (+198.67% YTD), with an extreme RSI of 99.6 — an overbought condition, but no slowdown in momentum as daily volume/sentiment remains robust.
- NB (Nigerian Breweries) combined outsized price gain with 197.90% above-average volume. Despite a neutral RSI, speculative money is rotating in, but beware: volume spikes are often precursors to volatility clusters.
- CORNERST under heavy pressure, showing up both in top losers (-9.44%) and as a YTD underperformer (-34.60%), with weak technicals.
- Laggards in Insurance (SOVRENINS, UNIVINSURE, CORNERST) dominate the losers, all posting large negative price action and, in the case of UNIVINSURE, abnormal volume.
YTD Outperformers & Underperformers (Select Table)
| Symbol | YTD %Chg | 5D %Chg | Div Yield | RSI | BETA |
|---|---|---|---|---|---|
| ABBEYBDS | +198.67% | +32.94% | 1.43% | 99.63 | 0.70 |
| NEWGOLD | +71.81% | +25.31% | 0.00% | 46.49 | 0.23 |
| LIVESTOCK | +114.45% | +8.57% | 2.94% | 55.31 | 0.46 |
| CORNERST | -34.60% | -10.69% | 5.28% | 36.23 | 0.93 |
| DAARCOMM | -17.65% | -11.11% | 0.00% | 48.54 | 0.71 |
Momentum Signals: Bullish & Bearish Breakouts
| Symbol | Sector | Price | 15D/50DMA Sparkline | RSI | MACD | Div Yield |
|---|---|---|---|---|---|---|
| ABCTRANS | Road Transportation | 1.42 | ▲↑ | 36.79 | -0.03 | 2.19% |
| ETI | Banking | 29.25 | ▲↑ | 25.15 | -0.84 | 2.00% |
| FIDELITYBK | Banking | 19.25 | ▲↑ | 48.16 | 0.23 | 5.48% |
| UPDCREIT | REITs | 5.90 | ▲↑ | N/A | N/A | 10.87% |
| ACCESSCORP | Other Financials | 22.10 | ▲↑ | 30.89 | -0.99 | 1.87% |
| NASCON | Food Products | 41.95 | ▼↓ | N/A | N/A | 3.09% |
| DANGSUGAR | Food Products | 33.30 | ▼↓ | N/A | N/A | 4.27% |
| SOVRENINS | Insurance | 0.89 | ▼↓ | 46.24 | -0.04 | 3.75% |
| ELLAHLAKES | Crop Production | 3.05 | ▼↓ | 57.35 | -0.03 | 0.00% |
- Bullish momentum standouts: FIDELITYBK (high dividend yield, RSI just under 50 but strong break above 15DMA); UPDCREIT (double-digit yield + technical breakout, albeit in a thinly traded segment).
- Bearish breakdowns: DANGSUGAR and NASCON (with high dividend yields), raise caution for yield hunters chasing falling knives.
Contrarian Signals – Conflicting Indicators
- NB: Despite a surge of +9.86%, RSI remains neutral at 40.6 and MACD is negative, yet volume was shockingly high, flagging a potential exhaustion rally or a bear trap.
- ZENITHBANK: YTD is -4.03%, yet weekly MACD and RSI indicate moderately positive technical momentum. Institutional interest remains very strong (see below).
- FIDELITYBK: Price action bullish with 5.45% close and strong dividend, yet RSI slipped from 57 to 48 — a divergence that needs close monitoring.
- ACCESSCORP: Showed positive price momentum (+2.79%), yet both retail and institutional trading volumes are below the 90-Day average, suggesting either a pause or consolidation phase.
Sector Heatmaps – Performance & Technical Outlook
| Sector | Key Stock | Retail/Inst. Activity | Technical Trend | Notable |
|---|---|---|---|---|
| Banking | FIDELITYBK, ETI | High institutional + retail presence | Bullish (multiple breakouts) | FIDELITYBK: high yield, positive price, rising volume; ETI: low RSI, strong jump |
| Insurance | CORNERST, UNIVINSURE | Retail led (UNIVINSURE - high volume) | Weak (several in top losers) | UNIVINSURE: volume x4, price down; CORNERST: -34% YTD |
| Beverages | NB | Speculative/possible institutional | Short-term overbought, contrarian | NB: Outsize move, volume spike, neutral RSI |
| Other Financials | ACCESSCORP | High in both retail & institutional | Bullish (above 15DMA) | Possible consolidation ahead |
| Food Products | DANGSUGAR, NASCON | Light trading | Bearish (below 15DMA) | DANGSUGAR, NASCON: caution for dividend chasers |
| REITs | UPDCREIT | Modest | Bullish (break above average) | Attractive for defensive income |
Dividend–Beta Defensive Matrix
| Stock | Dividend Yield | Beta | Technical Status | Implication |
|---|---|---|---|---|
| FIDELITYBK | 5.48% | 0.89 | Bullish breakout | Low-beta yield, momentum |
| UPDCREIT | 10.87% | -0.11 | Bullish | REIT, highly defensive |
| CORNERST | 5.28% | 0.93 | Bearish | Yield trap risk |
| SOVRENINS | 3.75% | 1.12 | Bearish | High risk, avoid for conservative |
| LIVESTOCK | 2.94% | 0.46 | Bullish |
- Yield + Defensive Beta: UPDCREIT is an outlier: double-digit yield, negative beta and bullish technicals – offering rare defensive upside.
- Yield Trap Risks: CORNERST offers high yield but negative YTD, bearish signals, and above-market beta – best left for aggressive traders only.
Institutional Clustering Alerts
- ZENITHBANK: Institutional activity is extremely elevated at 20.17% of trade value share (596M₦ out of 2.96B₦ across top five institutional names), despite negative YTD. Watch for smart money accumulation amid sector rotation.
- ACCESSCORP, FIDELITYBK: Together with ZENITHBANK, these three names dominate institutional order flow, representing safe havens or accumulation targets.
Retail vs. Institutional Trading – Patterns & Insights
- Retail accounted for 88.7% of trade count, versus just 11.3% institutional, but institutionals controlled 86.5% of total value and 67% of total volume — strong confirmation of block trading dominance in large caps.
- Top Retail Names: ACCESSCORP, REGALINS, ZENITHBANK, GTCO, UBA. ACCESSCORP is unique in that it appears in both retail and institutional top five, showing broad appeal/momentum.
- Pattern Watch: All top institutional names are also in banking/financials (except for REGALINS under retail), confirming ongoing sector preference by big money.
-
Volume Divergences:
- FIDELITYBK: Institutional volume nearly 10x retail.
- ZENITHBANK: Institutional volume >6x retail.
- REGALINS: Exception, where retail dominates — but price and technicals are weak.
- Key Insight: Stocks appearing in both institutional and retail most-traded lists (ACCESSCORP, ZENITHBANK, GTCO, UBA) offer high liquidity and are more likely to trend with overall market sentiment.
Trading Suggestions & Watchlist
- Bullish momentum: ABBEYBDS, LIVESTOCK, UPDCREIT, and FIDELITYBK are strong momentum/yield picks, but beware of holding ABBEYBDS after such an extreme run (RSI near 100 = risk of reversal).
- Defensive yield: FIDELITYBK and UPDCREIT combine moderate to double-digit yields with positive technicals. REITs, in particular, outperform during late-cycle or defensive market phases.
- Divergences: NB (Nigerian Breweries) and CORNERST are "wait and see" — big moves but indicators out of sync, so trade lighter or use tight stops.
- Sector rotation alert: Ongoing institutional clustering in banking names; monitor for potential breakouts as sector leads the market.
- Risk management: Avoid chasing losers in insurance unless reversal signals form. High-vol/yield traps (CORNERST, SOVRENINS) are best left for very short-term plays only.
- Bounce back watch: ETI and ABCTRANS breaking past their 15DMA after negative YTDs may indicate first legs of a reversal — monitor closely for confirmation.
Hidden/Not So Obvious Insights
- Liquidity rotation: Rising volume but falling value suggests more activity in mid/low-caps or speculative retail trading, even as institutions maintain value dominance — possible setup for large-cap catch-up rally (mean-reversion trade).
- Technical exhaustion risk: Extreme RSI readings in ABBEYBDS (99) and NNFM (89+) suggest parabolic rallies are overextended; mean-reversion or sharp corrections could follow.
- Yield-focused names with technical support: Defensive positions in FIDELITYBK, UPDCREIT, LIVESTOCK offer both yield and technical breakouts, suiting conservative and income-oriented investors.
- Insurance sector in distress: Not just weak prices, but outsized (abnormal) volume flows to UNIVINSURE and REGALINS, possibly signalling capitulation or forced selling — contrarians should wait for stabilization.
|
Top ASI Gainers Over Last 5 Trading Days
|
Top ASI Losers Over Last 5 Trading Days
|
For more detailed analysis, on InfoWARE Market Data Terminal <NSEPERF> <GO>
On InfoWARE Finance Mobile App (Android, iPhone & iPad, Windows Phone and Windows 8/10), "Top Gainers & Losers"
ABBEY BUILDING SOCIETY PLC (ABBEYBDS) topped the advancers list closing at N8.96 with a gain of 9.94% followed by NIGERIAN BREW. PLC. (NB) which closed at N36.20 with a gain of 9.86%.
On the flip side SUNU ASSURANCES NIGERIA PLC. (SUNUASSUR) and ELLAH LAKES PLC. (ELLAHLAKES) topped the decliners log with a loss of -9.91% at a close of N5.00, and -9.76% to close the day at N3.05 respectively.
| Symbol | LClose | %Chg |
|---|---|---|
| ABBEYBDS | 8.96 | 9.94 |
| NB | 36.20 | 9.86 |
| ABCTRANS | 1.42 | 9.23 |
| LIVESTOCK | 9.50 | 9.20 |
| ETI | 29.25 | 8.94 |
| Symbol | LClose | %Chg |
|---|---|---|
| SUNUASSUR | 5.00 | -9.91 |
| ELLAHLAKES | 3.05 | -9.76 |
| CORNERST | 2.59 | -9.44 |
| SOVRENINS | 0.89 | -9.18 |
| UNIVINSURE | 0.49 | -7.55 |
For more detailed analysis,
- On InfoWARE Market Data Terminal <TOPG> <GO>
- On InfoWARE Finance Mobile App ( Android, iPhone & iPad and Windows 10) , "Top Gainers & Losers"
Currency Market
In the currency market, the Naira fell 0.01%(-0.09) against the Dollar to settle at 1 to 1NSE: Bull Signal - Price crossed above 15 Day MA
This signal implies these stocks are under buying pressure and the price might continue to rise and therefore positions should be monitored closely. Further suggested analysis include looking at the overall market (ASI) to see if the uptrend is market wide, sector wide or specific to the stock. Portfolio managers tend to use this as a signal to do more research to add to their positions or lock in some profits. Typically further analysis should be done using commands like PC and RV on the InfoWARE Market Data Terminal. Another command is ALERTS to set price triggers for possible exit or entry as necessary
For more detailed analysis,
- On InfoWARE Market Data Terminal <NSEPERF> <GO>
- On InfoWARE Finance Mobile App ( Android , iPhone & iPad and Windows 10) , "Top Gainers & Losers"
| Symbol | Price | %Chg | 15DMA | PE | EPS | DivY | MktCap | Vol | Trades | Value | LstTradeTime |
|---|---|---|---|---|---|---|---|---|---|---|---|
| ABCTRANS | 1.42 | 8.45 | 1.36 | 6.68 | 0.17 | 2.19 | 3.40B | 305.66K | 32.00 | 433.85K | 17-Apr-2025 14:30:21.730 |
| ETI | 29.25 | 8.21 | 28.40 | 5.00 | 5.10 | 2.00 | 536.72B | 584.14K | 57.00 | 16.01M | 17-Apr-2025 14:30:32.593 |
| FIDELITYBK | 19.25 | 5.45 | 18.87 | 13.24 | 1.17 | 5.48 | 557.76B | 49.53M | 456.00 | 915.90M | 17-Apr-2025 14:30:33.210 |
| UPDCREIT | 5.90 | 5.08 | 5.85 | 9.09 | 0.57 | 10.87 | 15.74B | 1.46M | 65.00 | 8.20M | 17-Apr-2025 14:30:54.860 |
| NGXMERIGRW | 6,962.72 | 2.94 | 6,790.83 | 34.89 | 293.99 | 0.00 | 0.00 | 12.23M | 1,289.00 | 687.66M | 17-Apr-2025 14:30:47.447 |
| HONYFLOUR | 11.30 | 2.92 | 11.25 | 16.28 | 0.31 | 1.40 | 89.61B | 1.69M | 138.00 | 18.77M | 17-Apr-2025 14:30:33.900 |
| VETINDETF | 41.15 | 2.79 | 40.30 | 0.00 | 0.00 | 5.00 | 1.00 | 205.75 | 17-Apr-2025 14:31:10.050 | ||
| ACCESSCORP | 22.10 | 2.71 | 21.61 | 8.56 | 2.81 | 1.87 | 785.55B | 32.86M | 974.00 | 715.33M | 17-Apr-2025 14:31:16.670 |
| VETBANK | 12.70 | 1.57 | 12.61 | 0.00 | 0.00 | 500.00 | 1.00 | 6.35K | 17-Apr-2025 14:31:09.967 | ||
| NGXPENSION | 4,746.43 | 0.84 | 4,732.33 | 429.80 | 359.59 | 0.00 | 0.00 | 170.29M | 6,147.00 | 6.57B | 17-Apr-2025 14:30:47.600 |
| NGXPENBRD | 1,880.91 | 0.38 | 1,878.53 | 348.78 | 389.18 | 0.00 | 0.00 | 232.01M | 8,679.00 | 6.96B | 17-Apr-2025 14:30:47.570 |
NSE: BEAR Signal - Price crossed below 15 Day MA
This signal implies these stocks are under selling pressure and the price might continue to slide and therefore positions should be monitored closely. Further suggested analysis include looking at the overall market (ASI) to see if the downtrend is market wide, sector wide or specific to the stock. If the overal market trend is upwards, then since these stocks are heading in the opposite direction, then further analysis should be done using commands like PC and RV on the InfoWARE Market Data Terminal. Another command is ALERTS to set price triggers for possible exit is necessar
For more detailed analysis,
- On InfoWARE Market Data Terminal <BEARM> <GO>
- On InfoWARE Finance Mobile App ( Android , iPhone & iPad and Windows 10)
| Symbol | Price | %Chg | 15DMA | PE | EPS | DivY | MktCap | Vol | Trades | Value | LstTradeTime |
|---|---|---|---|---|---|---|---|---|---|---|---|
| NASCON | 41.95 | 0.00 | 43.29 | 24.28 | 1.33 | 3.09 | 111.14B | 855.60K | 143.00 | 34.95M | 17-Apr-2025 14:30:35.350 |
| DANGSUGAR | 33.30 | -1.20 | 33.34 | 11.48 | 3.06 | 4.27 | 404.49B | 1.87M | 169.00 | 61.68M | 17-Apr-2025 14:30:32.187 |
| SOVRENINS | 0.89 | -10.11 | 0.94 | 27.95 | 0.03 | 3.75 | 10.11B | 2.98M | 32.00 | 2.72M | 17-Apr-2025 14:30:37.607 |
| ELLAHLAKES | 3.05 | -10.82 | 3.07 | 0.00 | 0.00 | 0.00 | 6.10B | 5.49M | 107.00 | 17.30M | 17-Apr-2025 14:30:32.460 |
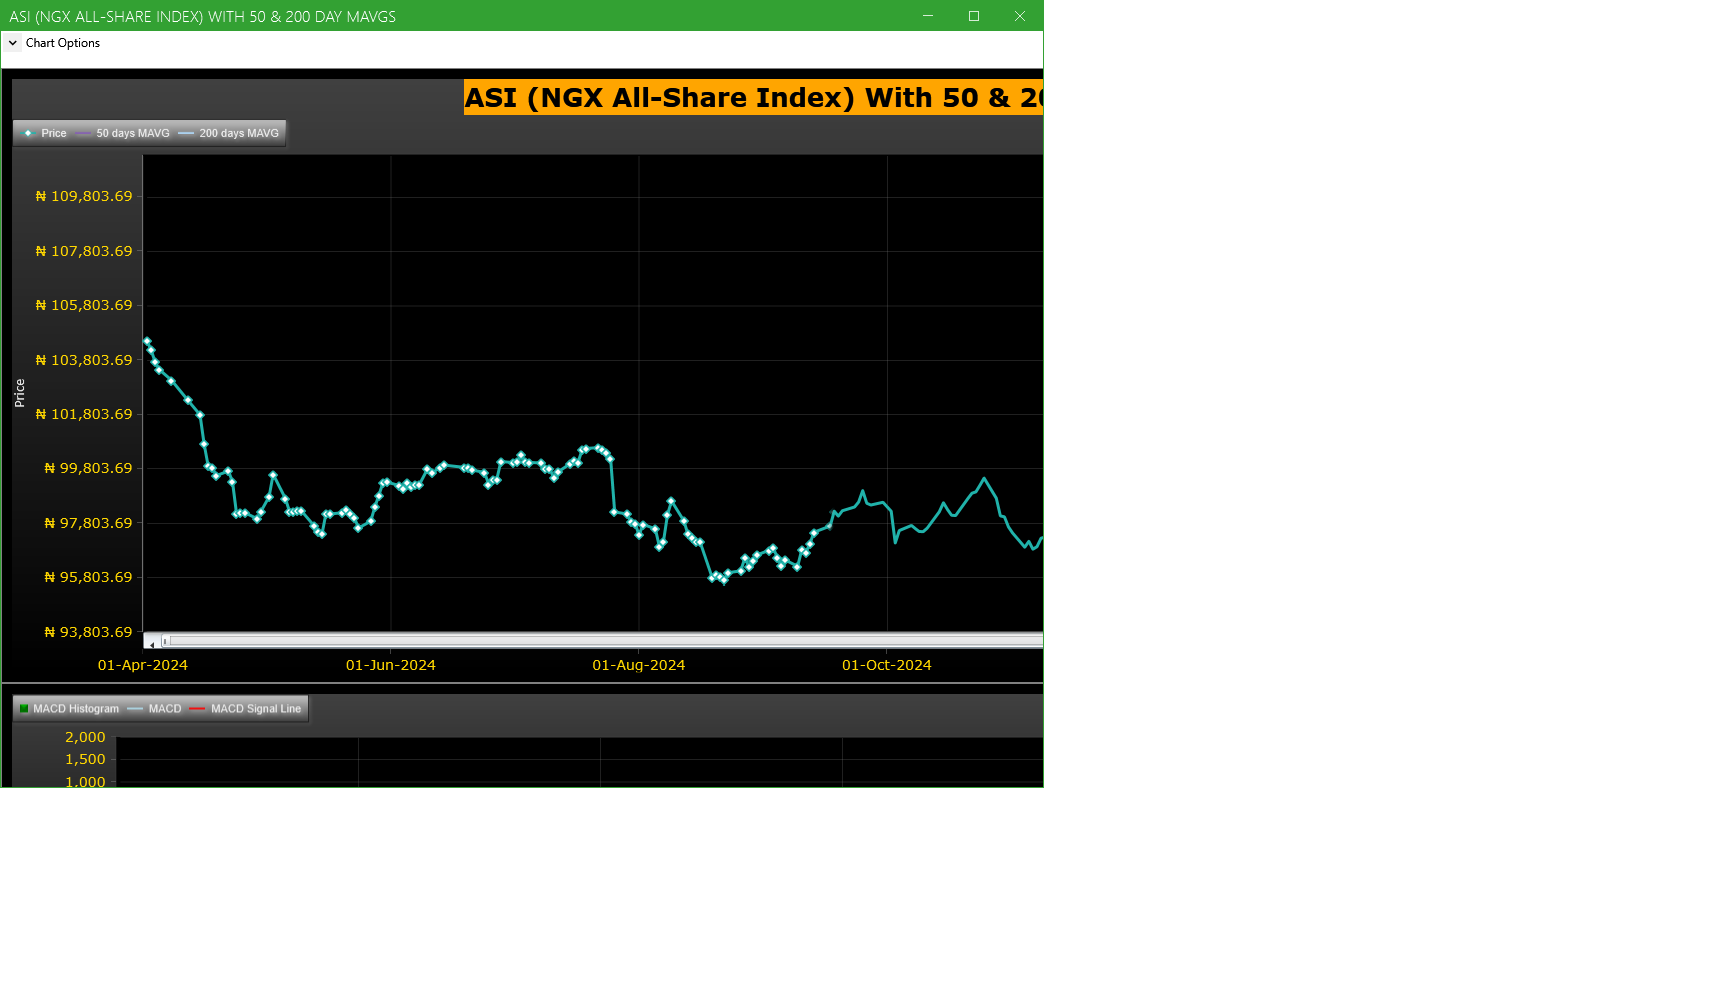
Market Trend - ASI (NGX All-Share-Index) With 50 & 200 Day MAvgs Chart
Technical traders typically use the 50 & 200 day moving averages to aid in choosing
where to enter or exit a position, which then causes these levels to act as strong
support or resistance. As a general guideline, if the price is above a moving average,
the trend is up. If the price is below a moving average, the trend is down.
It is important to note that critics of technical analysis say that moving averages act
as support and resistance because so many traders use these indicators to inform their
trading decisions. Also moving averages tend to work quite well in strong trending conditions
but poorly in choppy or ranging conditions.
Trading Strategies: Crossovers
Crossovers are one of the main moving average strategies. The first type is a price crossover,
which is when the price crosses above or below a moving average to signal a potential change
in trend. Another strategy is to apply two moving averages to a chart: one longer and one
shorter. When the shorter-term MA crosses above the longer-term MA, it is a buy signal, as
it indicates that the trend is shifting up. This is known as a golden cross. Meanwhile, when
the shorter-term MA crosses below the longer-term MA, it is a sell signal, as it indicates that
the trend is shifting down. This is known as a dead/death cross
For more detailed analysis,
- On InfoWARE Market Data Terminal <CI> <GO>
- On InfoWARE Finance Mobile App ( Android , iPhone & iPad and Windows 10) , "Research"
Unusual Volume: Volume traded is more than double the 90 day moving average (All exchanges; ASI & ASem). For more detailed analysis,
- On InfoWARE Market Data Terminal <UV> <GO>
- On InfoWARE Finance Mobile App ( Android , iPhone & iPad and Windows 10)
| Symbol | Name | Volume | 90DAvgVol | %VolChg | Price | LClose | %Chg | Trades | Value |
|---|---|---|---|---|---|---|---|---|---|
| UNIVINSURE | UNIVERSAL INSURANCE COMPANY PLC | 89.27M | 15.35M | 481.39 | 0.49 | 0.53 | -7.55 | 127 | 44.37M |
| NB | NIGERIAN BREW. PLC. | 15.42M | 5.18M | 197.90 | 36.20 | 32.95 | 9.86 | 193 | 555.57M |
| REGALINS | REGENCY ALLIANCE INSURANCE COMPANY PLC | 9.41M | 3.40M | 176.38 | 0.54 | 0.57 | -5.26 | 603 | 4.94M |
| NGXGROUP | NIGERIAN EXCHANGE GROUP | 6.39M | 1.43M | 347.25 | 33.50 | 33.80 | -0.89 | 32 | 214.05M |
| MTNN | MTN NIGERIA PLC | 6.04M | 2.29M | 164.34 | 242.00 | 243.00 | -0.41 | 380 | 1.45B |
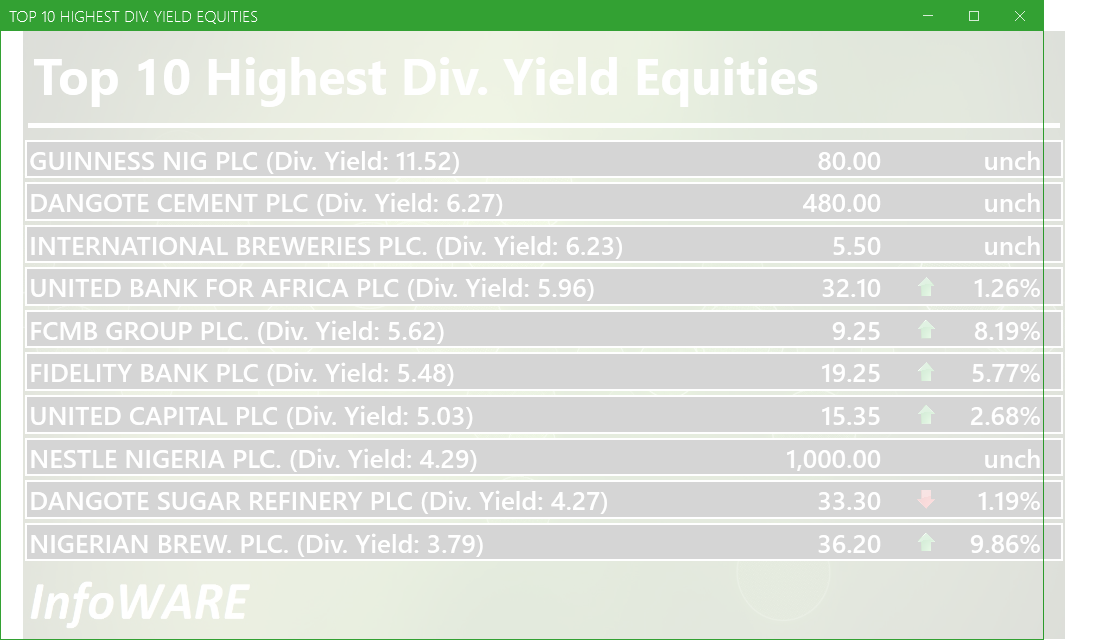
Investment Insights - High Div. Stocks
Dividend stocks distribute a portion of the company earnings to investors on a regular basis and they can a great choice for investors looking for regular income. As an investment or trading strategy, high dividend yield equities provide annual cash payments as against mostly capital gains in the price of a stock. The list in the table below represent the highest dividend paying stocks from the list of the most liquid stocks in the NSE top 30.
For more detailed analysis,
- On InfoWARE Market Data Terminal <HYIELD> <GO>
- On InfoWARE Finance Mobile App ( Android , iPhone & iPad and Windows 10) , "Research"
African Markets
| Name | LClose | Change | %Chg |
|---|---|---|---|
| BRVM Stock Exchange | 290.79 | 1.59 | 0.55 |
| Botswana Stock Exchange | 10,113.04 | 0.00 | 0.00 |
| Egyptian Exchange | 30,810.70 | 730.94 | 2.43 |
| Ghana Stock Exchange | 6,100.93 | 1.22 | 0.02 |
| Casablanca Stock Exchange | 16,070.49 | -306.24 | -1.87 |
| Malawi Stock Exchange | 294,562.18 | -1,837.68 | -0.62 |
| Nigeria Stock Exchange | 104,563.34 | -220.05 | -0.21 |
| Nairobi Securities Exchange | 126.78 | 1.02 | 0.81 |
| Rwanda Stock Exchange | 148.96 | 0.00 | 0.00 |
| Uganda Securities Exchange | 1,262.37 | -32.37 | -2.50 |
Nigeria Market Indexes
| Symbol | LClose | %Chg | WTD% | MTD% | QTD% | YTD% | MktCap | Trades |
|---|---|---|---|---|---|---|---|---|
| ASI | 104,242.40 | 0.38 | -0.27 | -1.24 | -1.24 | 1.03 | 10,267 | |
| NGX30 | 3,864.25 | 0.40 | -0.32 | -1.40 | -1.40 | 1.30 | 5,609 | |
| NGXAFRBVI | 2,406.35 | 0.78 | -6.28 | -9.64 | -9.64 | -3.00 | 2,675 | |
| NGXAFRHDYI | 16,270.42 | 0.61 | -0.96 | -2.24 | -2.24 | -4.45 | 2,283 | |
| NGXASEM | 1,588.92 | 0.00 | 0.00 | 0.06 | 0.06 | 0.33 | 4 | |
| NGXBNK | 1,075.19 | 1.33 | -3.51 | -7.38 | -7.38 | -1.12 | 3,116 | |
| NGXCG | 2,854.32 | 1.02 | -2.00 | -5.19 | -5.19 | 0.89 | 5,688 | |
| NGXCNSMRGDS | 1,831.27 | 1.24 | 2.31 | 0.86 | 0.86 | 5.59 | 1,129 | |
| NGXCOMMDTY | 1,002.53 | 0.00 | 0.00 | -0.10 | -0.10 | 0.25 | ||
| NGXGROWTH | 7,433.57 | 0.37 | -0.12 | 0.56 | 0.56 | -4.24 | 56 | |
| NGXINDUSTR | 3,473.16 | 0.00 | 0.00 | -0.48 | -0.48 | -2.76 | 390 | |
| NGXINS | 624.13 | -2.92 | -1.99 | -8.26 | -8.26 | -20.61 | 1,391 | |
| NGXLOTUSISLM | 7,453.35 | -0.07 | -0.05 | -1.34 | -1.34 | 6.97 | 1,197 | |
| NGXMAINBOARD | 5,026.20 | 0.56 | 0.03 | -0.70 | -0.70 | 0.44 | 7,454 | |
| NGXMERIGRW | 6,962.72 | 3.03 | 4.79 | 1.50 | 1.50 | 6.74 | 1,289 | |
| NGXMERIVAL | 10,011.21 | 0.88 | -1.98 | -2.74 | -2.74 | -4.02 | 3,357 | |
| NGXOILGAS | 2,422.56 | 0.44 | 0.39 | -0.98 | -0.98 | -10.64 | 158 | |
| NGXPENBRD | 1,880.91 | 0.39 | 0.40 | -0.42 | -0.42 | 2.69 | 8,679 | |
| NGXPENSION | 4,746.43 | 0.85 | 0.64 | -0.84 | -0.84 | 4.68 | 6,147 | |
| NGXPREMIUM | 10,062.73 | 0.03 | -0.13 | -1.01 | -1.01 | 3.39 | 2,757 | |
| NGXSOVBND | 651.61 | 0.02 | 0.39 | 3.95 | 3.95 | 8.32 | 0 |
For more detailed analysis,
- On InfoWARE Market Data Terminal <MKTINS> <GO>
- On InfoWARE Finance Mobile App ( Android, iPhone & iPad and Windows 10) , "Market Indexes"
Find the topic interesting? Will like to comment? Contact Us at solutions@infowarelimited.com
Top News

InfoWARE AI Analyst Weekly Market Report: 17-Apr-2025
InfoWARE AI Analyst Daily Market Report: 17-Apr-2025
Chart Of The Day - ASI Chart Vs ASI Advance Decline Line (YTD) (17-Apr-2025 15:13:14.880)
InfoWARE AI Analyst Daily Market Report: 17-Apr-2025

[ABCTRANS]>>Notice of Meeting -<ABC TRANSPORT PLC>
[MEYER]>>Notice of Meeting -<MEYER PLC>
[OKOMUOIL]>>Notice of Meeting -<OKOMU OIL PALM PLC.>
[MERGROWTH]>> DAILY INDICATIVE PRICES
[XNSA]>> DAILY FUND PRICE SUBMISSION - FCMB ASSET MANAGEMENT LIMITED
[XNSA]>> PUBLIC HOLIDAY
[XNSA]>> FACTS BEHIND THE RIGHTS ISSUE PRESENTATION BY WEMA BANK PLC
[AIRTELAFRI]>>Corporate Disclosures-<Airtel Africa Plc>
[STANBIC]>>Notice of Meeting -<STANBIC IBTC HOLDINGS PLC>
[BUACEMENT]>>Notice of Meeting -<BUA Cement Plc>
[XNSA]>> NGX FIXED INCOME INDICATIVE PRICE LIST FOR APR 17, 2025
[VETINDETF]>> DAILY INDICATIVE PRICES
[NEWGOLD]>> DAILY INDICATIVE PRICES
[XNSA]>> WEMA BANK PLC: ACTIVATION OF CODE FOR TRADING IN RIGHTS

Daily Business News Brief
[SOVRENINS]>>Corporate Disclosures-<SOVEREIGN TRUST INSURANCE PLC>
[SIAMLETF40]>>DAILY INDICATIVE PRICES
[XNSA]>> NOTIFICATION OF PRICE ADJUSTMENT
MARKET PERFORMANCE REPORT & DAILY PRICE LIST

CardinalStone Earnings Update - Access Holdings Plc FY'24 Audited results - Interest Earning Assets expansion bolsters gross earnings growth
Market Summary 16-04-2025
Chart Of The Day - ASI Chart Vs ASI Advance Decline Line (YTD) (16-Apr-2025 15:07:14.944)
InfoWARE AI Analyst Daily Market Report: 16-Apr-2025
ACCESS HOLDINGS - FY 2024 QUICK TAKE
[VFDGROUP]>>Notice of Meeting -<VFD Group Plc>
[NEWGOLD]>> DAILY INDICATIVE PRICES
Get IDIA - the stock trading app for the modern investor
Solutions by Business
Product Suites
Company
Contacts
- 8th Floor,
- South Atlantic Petroleum Towers,
- 1 Adeola Odeku Street,
- Victoria Island,
- Lagos, Nigeria.
- Email: solutions@infowarelimited.com
Follow Us
 |
 |
 |
 |