


InfoWARE AI Analyst Daily Market Report: 27-Mar-2025 | InfoWARE Finance
Get IDIA - the stock trading app for the modern investor


InfoWARE AI Analyst Daily Market Report: 27-Mar-2025
(Source: InfoWARE Terminal, Date: 27-Mar-2025)
Dear Investor,
Market Summary: Wednesday, March 26, 2025
The NGX All-Share Index (ASI) edged down -0.10% to 105,593.28, trimming its YTD gain to 2.23%. Despite the slight dip, market breadth leaned bullish at 1.75x (35 advancers vs. 20 decliners), though volume trends revealed underlying caution: only 57 stocks saw volume increases vs. 77 with declines. Turnover fell -16.72% to ?12.12B, while the Naira strengthened 0.59% to ?1,526/$.
Key Trends & Movers
- Bond ETF Surge: VSPBONDETF (+36.84%) dominated gains, but its RSI 45.5 and bearish MACD (-15.5) suggest technical exhaustion.
- Insurance Split: NEM (+9.84%) rallied despite RSI 29.1 (oversold), while MBENEFIT (-10%) collapsed despite a RSI 99.9 – a dangerous divergence.
- Institutional Focus: Banks dominated institutional flows (ACCESSCORP, ZENITHBANK), while retail traders chased the same names at smaller scales.
Contrarian Signals
| Stock | Conflict | Implication |
|---|---|---|
| CHAMPION | Bullish MACD crossover vs. -9.8% YTD | Potential short-term rebound in a battered brewer |
| MBENEFIT | RSI 99.9 despite -10% drop | Extreme overbought signal flags capitulation risk |
| AFRIPRUD | RSI 24.2 (oversold) + 1.27% dividend | High-yield defensive play amid selloff |
Sector Heatmap
| Sector | Performance | Institutional Activity | Technical Trend |
|---|---|---|---|
| Insurance | ?? Mixed (4 gainers, 2 losers) | Moderate | 15DMA crossovers in LASACO, MANSARD |
| Banking | ?? Flat (ZENITHBANK -1.1%, FIDELITYBK +0.5%) | High (91% of institutional value) | RSI divergence (FIDELITYBK 66 vs. MTNN 29) |
| ETF | ?? VSPBONDETF +36.8% | Low | Bearish MACD despite price spike |
Dividend-Beta Matrix Highlights
| Stock | Dividend Yield | Beta | Edge |
|---|---|---|---|
| AFRIPRUD | 1.27% | 0.64 | Low-volatility income |
| REGALINS | 6.52% | 0.47 | High yield but -12.5% YTD |
| UCAP | 5.03% | 0.74 | Balanced risk/reward |
Institutional Clustering Alert
?? ZENITHBANK saw 20.17% institutional trade share despite -1.1% drop – likely accumulation in a core banking stock with 6.65% YTD gain and 2.25% dividend.
YTD Performance Snapshot (Wednesdays Requirement)
| Top 3 YTD Gainers | %ChgYTD | Top 3 YTD Losers | %ChgYTD |
|---|---|---|---|
| LIVESTOCK | 115.58% | AFRIPRUD | -35.84% |
| ABBEYBDS | 43.33% | DAARCOMM | -14.71% |
| GTCO | 12.46% | ETERNA | -14.64% MTD |
Trading Insights
- Rotation Alert: Insurance stocks show split technicals – buy oversold NEM (RSI 29) but avoid MBENEFIT’s overheated RSI 99.9.
- Bank Play: FIDELITYBK’s RSI 66 and institutional accumulation (+221% volume) suggests momentum despite rich PE 13.2x.
- Defensive Hedge: AFRIPRUD’s 1.27% yield + 0.64 Beta offers portfolio stability amid ASI volatility.
Note: All percentage changes colored inline with performance. Monitor MACD crossovers in banking heavyweights for market direction clues.
|
Top ASI Gainers Over Last 5 Trading Days
|
Top ASI Losers Over Last 5 Trading Days
|
For more detailed analysis, on InfoWARE Market Data Terminal <NSEPERF> <GO>
On InfoWARE Finance Mobile App (Android, iPhone & iPad, Windows Phone and Windows 8/10), "Top Gainers & Losers"
THE INITIATES PLC (TIP) topped the advancers list closing at N4.46 with a gain of 9.85% followed by UNIVERSAL INSURANCE COMPANY PLC (UNIVINSURE) which closed at N0.60 with a gain of 9.09%.
On the flip side JOHN HOLT PLC. (JOHNHOLT) and CHAMS PLC (CHAMS) topped the decliners log with a loss of -10.00% at a close of N7.74, and -8.52% to close the day at N2.04 respectively.
| Symbol | LClose | %Chg |
|---|---|---|
| TIP | 4.46 | 9.85 |
| UNIVINSURE | 0.60 | 9.09 |
| MBENEFIT | 0.96 | 9.09 |
| ROYALEX | 0.97 | 8.99 |
| LEARNAFRCA | 3.32 | 8.14 |
For more detailed analysis,
- On InfoWARE Market Data Terminal <TOPG> <GO>
- On InfoWARE Finance Mobile App ( Android, iPhone & iPad and Windows 10) , "Top Gainers & Losers"
Currency Market
In the currency market, the Naira fell 0.21%(-3.20) against the Dollar to settle at 1 to 1NSE: Bull Signal - Price crossed above 15 Day MA
This signal implies these stocks are under buying pressure and the price might continue to rise and therefore positions should be monitored closely. Further suggested analysis include looking at the overall market (ASI) to see if the uptrend is market wide, sector wide or specific to the stock. Portfolio managers tend to use this as a signal to do more research to add to their positions or lock in some profits. Typically further analysis should be done using commands like PC and RV on the InfoWARE Market Data Terminal. Another command is ALERTS to set price triggers for possible exit or entry as necessary
For more detailed analysis,
- On InfoWARE Market Data Terminal <NSEPERF> <GO>
- On InfoWARE Finance Mobile App ( Android , iPhone & iPad and Windows 10) , "Top Gainers & Losers"
| Symbol | Price | %Chg | 15DMA | PE | EPS | DivY | MktCap | Vol | Trades | Value | LstTradeTime |
|---|---|---|---|---|---|---|---|---|---|---|---|
| FGS202659 | 100.00 | 45.00 | 94.00 | 0.00 | 0.00 | 1.00 | 1.00 | 1.00K | 27-Mar-2025 14:30:47.180 | ||
| UNIVINSURE | 0.60 | 8.33 | 0.58 | 0.00 | 0.00 | 0.00 | 9.60B | 13.92M | 73.00 | 8.34M | 27-Mar-2025 14:30:40.033 |
| CHAMPION | 4.09 | 7.09 | 3.91 | 412.83 | 0.01 | 0.41 | 32.02B | 1.49M | 36.00 | 5.68M | 27-Mar-2025 14:30:33.350 |
| OMATEK | 0.71 | 5.63 | 0.69 | 6.82 | 0.10 | 0.00 | 2.09B | 665.26K | 28.00 | 459.26K | 27-Mar-2025 14:30:37.597 |
| CUTIX | 2.49 | 4.82 | 2.43 | 8.81 | 0.26 | 6.52 | 8.77B | 1.78M | 49.00 | 4.36M | 27-Mar-2025 14:30:33.853 |
| NGXSOVBND | 626.86 | 1.03 | 621.37 | 0.00 | 0.00 | 0.00 | 0.00 | 0.00 | 0.00 | 0.00 | 27-Mar-2025 14:30:52.513 |
NSE: BEAR Signal - Price crossed below 15 Day MA
This signal implies these stocks are under selling pressure and the price might continue to slide and therefore positions should be monitored closely. Further suggested analysis include looking at the overall market (ASI) to see if the downtrend is market wide, sector wide or specific to the stock. If the overal market trend is upwards, then since these stocks are heading in the opposite direction, then further analysis should be done using commands like PC and RV on the InfoWARE Market Data Terminal. Another command is ALERTS to set price triggers for possible exit is necessar
For more detailed analysis,
- On InfoWARE Market Data Terminal <BEARM> <GO>
- On InfoWARE Finance Mobile App ( Android , iPhone & iPad and Windows 10)
| Symbol | Price | %Chg | 15DMA | PE | EPS | DivY | MktCap | Vol | Trades | Value | LstTradeTime |
|---|---|---|---|---|---|---|---|---|---|---|---|
| NGXAFRHDYI | 16,540.91 | -0.96 | 16,642.36 | 7.46 | 39.30 | 0.00 | 0.00 | 74.82M | 2,961.00 | 3.19B | 27-Mar-2025 14:30:51.337 |
| CILEASING | 3.90 | -2.05 | 3.95 | 6.50 | 0.64 | 1.20 | 3.05B | 651.98K | 15.00 | 2.46M | 27-Mar-2025 14:30:33.430 |
| FIRSTHOLDCO | 28.00 | -2.50 | 28.29 | 0.00 | 0.00 | 2.37M | 194.00 | 67.05M | 27-Mar-2025 14:31:22.577 | ||
| MERGROWTH | 380.00 | -2.63 | 386.59 | 0.00 | 0.00 | 32.00 | 1.00 | 12.16K | 27-Mar-2025 14:31:22.273 | ||
| CUSTODIAN | 19.50 | -7.18 | 20.35 | 3.80 | 3.29 | 1.20 | 114.70B | 1.23M | 54.00 | 24.12M | 27-Mar-2025 14:30:33.820 |
| UPDC | 2.70 | -7.41 | 2.81 | 0.00 | 0.00 | 34.25 | 50.11B | 2.41M | 68.00 | 6.91M | 27-Mar-2025 14:31:21.770 |
| MAYBAKER | 8.10 | -8.64 | 8.34 | 58.94 | 0.14 | 3.75 | 13.97B | 595.56K | 43.00 | 4.83M | 27-Mar-2025 14:30:36.013 |
| CHAMS | 2.04 | -9.31 | 2.11 | 27.02 | 0.07 | 1.56 | 9.58B | 5.02M | 89.00 | 10.72M | 27-Mar-2025 14:31:21.637 |
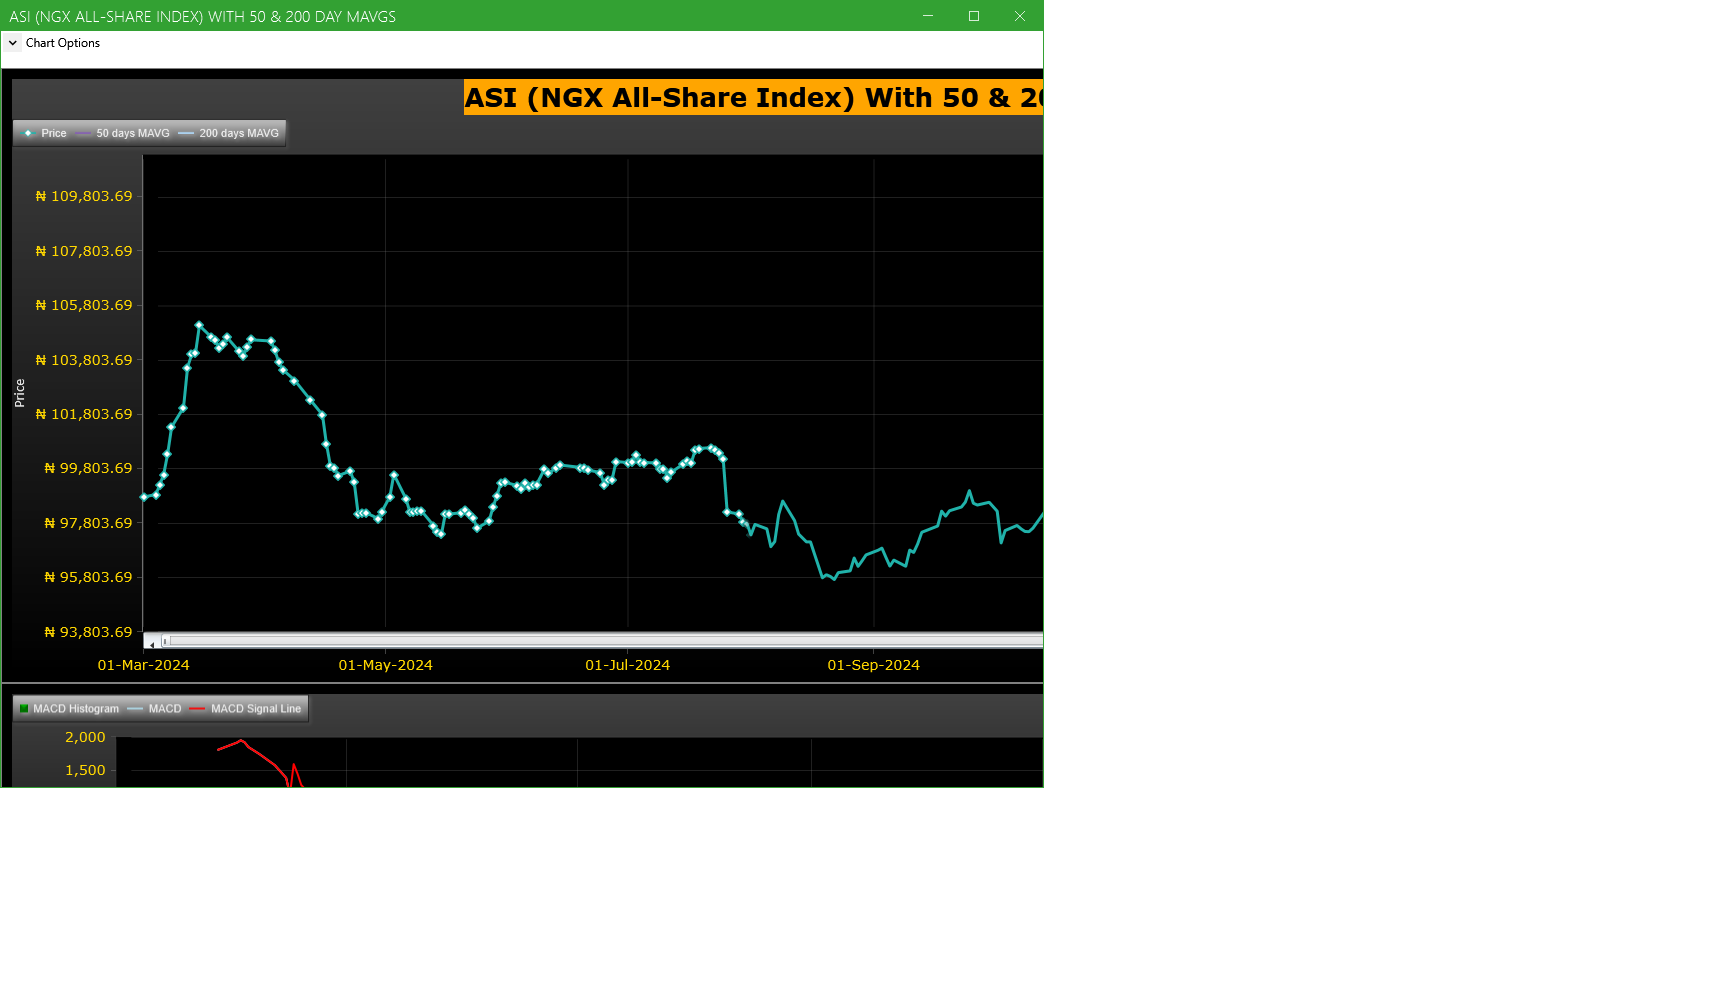
Market Trend - ASI (NGX All-Share-Index) With 50 & 200 Day MAvgs Chart
Technical traders typically use the 50 & 200 day moving averages to aid in choosing
where to enter or exit a position, which then causes these levels to act as strong
support or resistance. As a general guideline, if the price is above a moving average,
the trend is up. If the price is below a moving average, the trend is down.
It is important to note that critics of technical analysis say that moving averages act
as support and resistance because so many traders use these indicators to inform their
trading decisions. Also moving averages tend to work quite well in strong trending conditions
but poorly in choppy or ranging conditions.
Trading Strategies: Crossovers
Crossovers are one of the main moving average strategies. The first type is a price crossover,
which is when the price crosses above or below a moving average to signal a potential change
in trend. Another strategy is to apply two moving averages to a chart: one longer and one
shorter. When the shorter-term MA crosses above the longer-term MA, it is a buy signal, as
it indicates that the trend is shifting up. This is known as a golden cross. Meanwhile, when
the shorter-term MA crosses below the longer-term MA, it is a sell signal, as it indicates that
the trend is shifting down. This is known as a dead/death cross
For more detailed analysis,
- On InfoWARE Market Data Terminal <CI> <GO>
- On InfoWARE Finance Mobile App ( Android , iPhone & iPad and Windows 10) , "Research"
Unusual Volume: Volume traded is more than double the 90 day moving average (All exchanges; ASI & ASem). For more detailed analysis,
- On InfoWARE Market Data Terminal <UV> <GO>
- On InfoWARE Finance Mobile App ( Android , iPhone & iPad and Windows 10)
| Symbol | Name | Volume | 90DAvgVol | %VolChg | Price | LClose | %Chg | Trades | Value |
|---|---|---|---|---|---|---|---|---|---|
| FIDELITYBK | FIDELITY BANK PLC | 40.70M | 19.93M | 104.22 | 19.15 | 19.15 | 0.00 | 557 | 773.22M |
| TANTALIZER | TANTALIZERS PLC | 31.50M | 11.92M | 164.27 | 2.95 | 2.92 | 1.03 | 102 | 89.91M |
| TIP | THE INITIATES PLC | 6.92M | 1.26M | 451.25 | 4.46 | 4.06 | 9.85 | 51 | 30.88M |
| MBENEFIT | MUTUAL BENEFITS ASSURANCE PLC. | 5.85M | 411.43K | 1,322.60 | 0.96 | 0.88 | 9.09 | 20 | 5.62M |
| MTNN | MTN NIGERIA PLC | 4.10M | 1.98M | 107.56 | 245.00 | 238.40 | 2.77 | 641 | 985.33M |
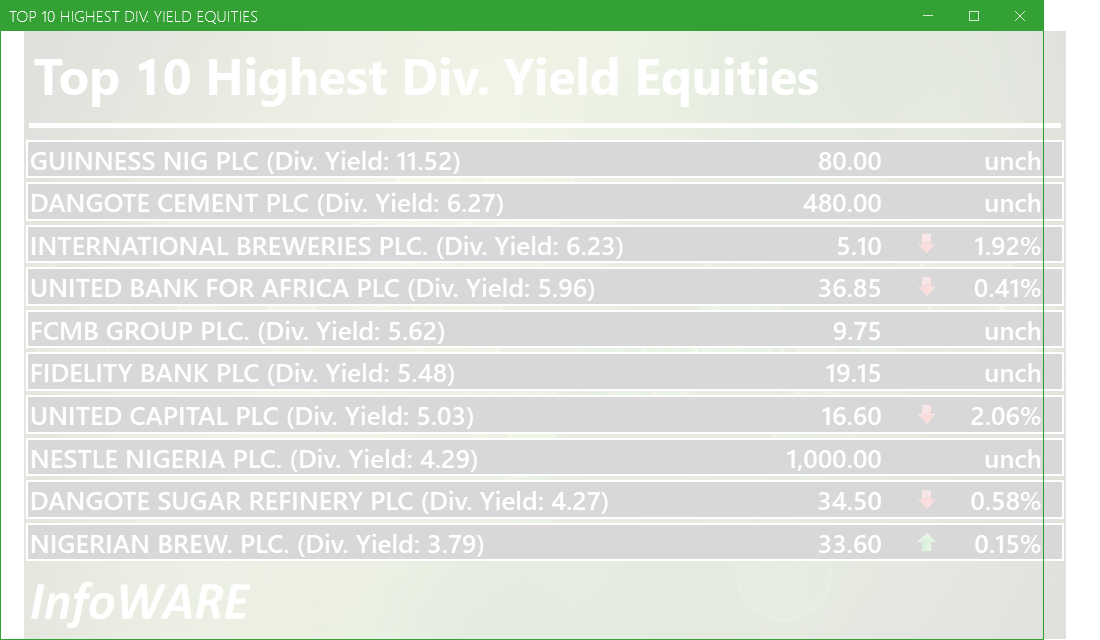
Investment Insights - High Div. Stocks
Dividend stocks distribute a portion of the company earnings to investors on a regular basis and they can a great choice for investors looking for regular income. As an investment or trading strategy, high dividend yield equities provide annual cash payments as against mostly capital gains in the price of a stock. The list in the table below represent the highest dividend paying stocks from the list of the most liquid stocks in the NSE top 30.
For more detailed analysis,
- On InfoWARE Market Data Terminal <HYIELD> <GO>
- On InfoWARE Finance Mobile App ( Android , iPhone & iPad and Windows 10) , "Research"
African Markets
| Name | LClose | Change | %Chg |
|---|---|---|---|
| BRVM Stock Exchange | 284.48 | 1.36 | 0.48 |
| Botswana Stock Exchange | 10,067.48 | 1.01 | 0.01 |
| Egyptian Exchange | 31,933.76 | 256.59 | 0.81 |
| Ghana Stock Exchange | 6,126.08 | -53.76 | -0.87 |
| Lusaka Stock Exchange | 15,349.16 | 26.05 | 0.17 |
| Casablanca Stock Exchange | 17,858.90 | 237.88 | 1.35 |
| Malawi Stock Exchange | 291,645.26 | -408.88 | -0.14 |
| Nigeria Stock Exchange | 105,551.39 | 587.80 | 0.56 |
| Nairobi Securities Exchange | 129.75 | -0.47 | -0.36 |
| Rwanda Stock Exchange | 148.94 | 0.00 | 0.00 |
| Uganda Securities Exchange | 1,310.01 | 4.83 | 0.37 |
Nigeria Market Indexes
| Symbol | LClose | %Chg | WTD% | MTD% | QTD% | YTD% | MktCap | Trades |
|---|---|---|---|---|---|---|---|---|
| ASI | 105,426.12 | -0.05 | -0.12 | -1.89 | 2.18 | 2.18 | 10,777 | |
| NGX30 | 3,912.55 | -0.01 | -0.12 | -1.93 | 2.56 | 2.56 | 6,664 | |
| NGXAFRBVI | 2,593.75 | -1.06 | 0.11 | -0.43 | 4.55 | 4.55 | 3,080 | |
| NGXAFRHDYI | 16,540.91 | -0.95 | 0.50 | -2.79 | -2.86 | -2.86 | 2,961 | |
| NGXASEM | 1,587.89 | 0.00 | 0.00 | 0.08 | 0.26 | 0.26 | 6 | |
| NGXBNK | 1,145.35 | -0.96 | 0.48 | -0.55 | 5.33 | 5.33 | 3,656 | |
| NGXCG | 2,980.15 | -0.46 | 0.33 | -0.71 | 5.33 | 5.33 | 6,712 | |
| NGXCNSMRGDS | 1,812.00 | -0.20 | 0.05 | -0.48 | 4.48 | 4.48 | 1,060 | |
| NGXGROWTH | 7,423.11 | 0.44 | 0.53 | -5.78 | -4.38 | -4.38 | 69 | |
| NGXINDUSTR | 3,489.85 | 0.01 | 0.01 | -3.57 | -2.29 | -2.29 | 566 | |
| NGXINS | 707.60 | 0.09 | 4.77 | -0.65 | -10.00 | -10.00 | 723 | |
| NGXLOTUSISLM | 7,506.18 | 0.41 | -0.48 | -2.63 | 7.73 | 7.73 | 1,550 | |
| NGXMAINBOARD | 5,049.84 | -0.16 | 0.01 | -1.60 | 0.92 | 0.92 | 7,106 | |
| NGXMERIGRW | 6,933.15 | -0.27 | 0.71 | -3.36 | 6.28 | 6.28 | 1,225 | |
| NGXMERIVAL | 10,274.15 | -1.52 | -1.04 | -4.51 | -1.50 | -1.50 | 4,036 | |
| NGXOILGAS | 2,459.22 | -0.35 | -2.01 | -4.40 | -9.29 | -9.29 | 231 | |
| NGXPENBRD | 1,885.57 | 0.02 | 0.00 | -1.75 | 2.94 | 2.94 | 9,026 | |
| NGXPENSION | 4,750.26 | -0.31 | 0.06 | -0.93 | 4.77 | 4.77 | 7,239 | |
| NGXPREMIUM | 10,174.97 | 0.16 | -0.36 | -2.41 | 4.54 | 4.54 | 3,602 | |
| NGXSOVBND | 626.86 | 1.04 | 1.04 | 0.69 | 4.21 | 4.21 | 0 |
For more detailed analysis,
- On InfoWARE Market Data Terminal <MKTINS> <GO>
- On InfoWARE Finance Mobile App ( Android, iPhone & iPad and Windows 10) , "Market Indexes"
Find the topic interesting? Will like to comment? Contact Us at solutions@infowarelimited.com
Top News

InfoWARE AI Analyst Daily Market Report: 28-Mar-2025
InfoWARE AI Analyst Daily Market Report: 28-Mar-2025
InfoWARE AI Analyst Weekly Market Report: 28-Mar-2025
Chart Of The Day - ASI Chart Vs ASI Advance Decline Line (YTD) (28-Mar-2025 15:07:49.477)
InfoWARE AI Analyst Daily Market Report: 28-Mar-2025

[MRS]>>Corporate Disclosures-<MRS OIL NIGERIA PLC.>
[XNSA]>> PUBLIC HOLIDAY
[MERGROWTH]>> DAILY INDICATIVE PRICES
[XNSA]>> OFF MARKET TRADE
[VSPBONDETF]>> DAILY INDICATIVE PRICES
[LOTUSHAL15]>> DAILY INDICATIVE PRICES
[XNSA]>> NGX FIXED INCOME INDICATIVE PRICE LIST FOR MAR 28, 2025
[XNSA]>> EMERGING AFRICA DAILY MUTUAL FUND PRICES
[PZ]>>Corporate Disclosures-<P Z CUSSONS NIGERIA PLC.>
[DANGCEM]>>Corporate Disclosures-<DANGOTE CEMENT PLC>
[WAPCO]>>Corporate Disclosures-<LAFARGE AFRICA PLC.>
[XNSA]>> DAILY FUND PRICE SUBMISSION - FCMB ASSET MANAGEMENT LIMITED

CardinalStone Earnings Update - Ecobank Transnational Incorporated Plc FY'24 Audited results - Sturdy FY'24 earnings amid moderating costs

Daily Business News Brief
[XNSA]>> NOTIFICATION OF PRICE ADJUSTMENT
[DANGSUGAR]>>Notice of Meeting -<DANGOTE SUGAR REFINERY PLC>
Chart Of The Day - ASI Chart Vs ASI Advance Decline Line (YTD) (27-Mar-2025 15:09:09.356)
InfoWARE AI Analyst Daily Market Report: 27-Mar-2025
[XNSA]>> CORDROS MILESTONE FUNDS' BID & OFFER PRICES
[RONCHESS]>>Corporate Disclosures-<RONCHESS GLOBAL RESOURCES PLC>
[LASACO]>>Corporate Disclosures-<LASACO ASSURANCE PLC.>
[XNSA]>> EMERGING AFRICA DAILY MUTUAL FUND PRICES
Breaking News! Unusual Volume Alert (27-Mar-2025 11:21:10.963)
Breaking News! Bulls Momentum Alert (27-Mar-2025 11:21:06.954)
Breaking News! Bears Momentum Alert (27-Mar-2025 11:21:06.862)
Get IDIA - the stock trading app for the modern investor
Solutions by Business
Product Suites
Company
Contacts
- 8th Floor,
- South Atlantic Petroleum Towers,
- 1 Adeola Odeku Street,
- Victoria Island,
- Lagos, Nigeria.
- Email: solutions@infowarelimited.com
Follow Us
 |
 |
 |
 |