


InfoWARE AI Analyst Daily Market Report: 28-Mar-2025 | InfoWARE Finance
Get IDIA - the stock trading app for the modern investor


InfoWARE AI Analyst Daily Market Report: 28-Mar-2025
(Source: InfoWARE Terminal, Date: 28-Mar-2025)
Dear Investor,
NGX Market Summary - Friday, March 28, 2025
The NGX All-Share Index eked out a 0.23% gain to close at 105,426.12, though market breadth remained weak at 0.68x with 25 advancers vs 37 decliners. Notably, turnover surged 47% to ?12.83B despite the tepid price action, suggesting institutional repositioning ahead of quarter-end.
Key Observations
- Extreme Momentum: ABBEYBDS (+10%) shows RSI 97.4 (severely overbought) while AFRIPRUD (-10%) sits at RSI 23.8 (oversold)
- Volume Anomaly: MBENEFIT saw 14,794% surge vs 90D avg volume amid 72% YTD gains
- Institutional Focus: Banks dominated institutional flows (72% of value) with GTCO capturing 26% of institutional trade value
Contrarian Signals
| Stock | YTD % | RSI | MACD Signal | Comment |
|---|---|---|---|---|
| ROYALEX | -4.55% | 59.5 | Bullish Crossover | Div yield 7.8% with improving technicals |
| CADBURY | +45.6% | 60.4 | Bearish MACD | EPS 0.64 vs PE 33.25 suggests rich valuation |
Sector Heatmap
| Sector | Performance | Institutional Activity | Technical Trend |
|---|---|---|---|
| Banking | ?1.2% | 72% of value | Mixed (GTCO bullish vs ZENITHBANK bearish) |
| Insurance | ?3.8% | 18% of volume | Overbought (MBENEFIT RSI 100) |
Dividend-Beta Matrix
| Stock | Yield | Beta | Opportunity |
|---|---|---|---|
| AFRIPRUD | 1.27% | 0.64 | Defensive play |
| DANGSUGAR | 4.27% | 1.35 | High risk income |
Institutional Clustering
ZENITHBANK shows concentrated institutional interest with 20.17% trade value share despite -1.7% price decline, suggesting potential accumulation.
Trader's Playbook
- Opportunity: Mean reversion in AFRIPRUD (RSI 23.8, -59% MTD)
- Caution: Profit-taking risk in ABBEYBDS (RSI 97.4, 57% YTD)
- Pairs Trade: Long GTCO (RSI 64)/Short ZENITHBANK (RSI 48)
Market Activity Insights
| Metric | Retail | Institutional |
|---|---|---|
| Trade Count | 86.96% | 13.04% |
| Value Contribution | 6.6% | 93.4% |
Notable Divergence: While retail traders focused on low-price stocks like UNIVINSURE (?0.60), institutions drove GTCO's 7.08% rally with ?4.57B in trades.
|
Top ASI Gainers Over Last 5 Trading Days
|
Top ASI Losers Over Last 5 Trading Days
|
For more detailed analysis, on InfoWARE Market Data Terminal <NSEPERF> <GO>
On InfoWARE Finance Mobile App (Android, iPhone & iPad, Windows Phone and Windows 8/10), "Top Gainers & Losers"
ABBEY BUILDING SOCIETY PLC (ABBEYBDS) topped the advancers list closing at N4.73 with a gain of 10.00% followed by UPDC PLC (UPDC) which closed at N2.97 with a gain of 10.00%.
On the flip side AFRICA PRUDENTIAL REGISTRARS PLC (AFRIPRUD) and INTERNATIONAL ENERGY INSURANCE COMPANY PLC (INTENEGINS) topped the decliners log with a loss of -10.00% at a close of N13.05, and -10.00% to close the day at N1.62 respectively.
| Symbol | LClose | %Chg |
|---|---|---|
| ABBEYBDS | 4.73 | 10.00 |
| UPDC | 2.97 | 10.00 |
| NNFM | 87.75 | 9.96 |
| MBENEFIT | 1.05 | 9.38 |
| ROYALEX | 1.05 | 8.25 |
| Symbol | LClose | %Chg |
|---|---|---|
| AFRIPRUD | 13.05 | -10.00 |
| INTENEGINS | 1.62 | -10.00 |
| CADBURY | 23.55 | -9.42 |
| UPDCREIT | 5.50 | -9.09 |
| VETGOODS | 18.00 | -9.09 |
For more detailed analysis,
- On InfoWARE Market Data Terminal <TOPG> <GO>
- On InfoWARE Finance Mobile App ( Android, iPhone & iPad and Windows 10) , "Top Gainers & Losers"
Currency Market
In the currency market, the Naira fell 0.40%(-6.09) against the Dollar to settle at 1 to 1Investment Insights - Top 5 Gainers YTD
These stocks are the best performers whose price has risen faster than the market as a whole with the best returns year to date. Momentum investors believe that stocks that have outperformed the market will often continue to do so because the factors that caused them to outperform will not suddenly disappear. In addition, other investors seeking to benefit from the stock’s outperformance will often purchase the stock, further bidding its price higher and pushing the stock higher still
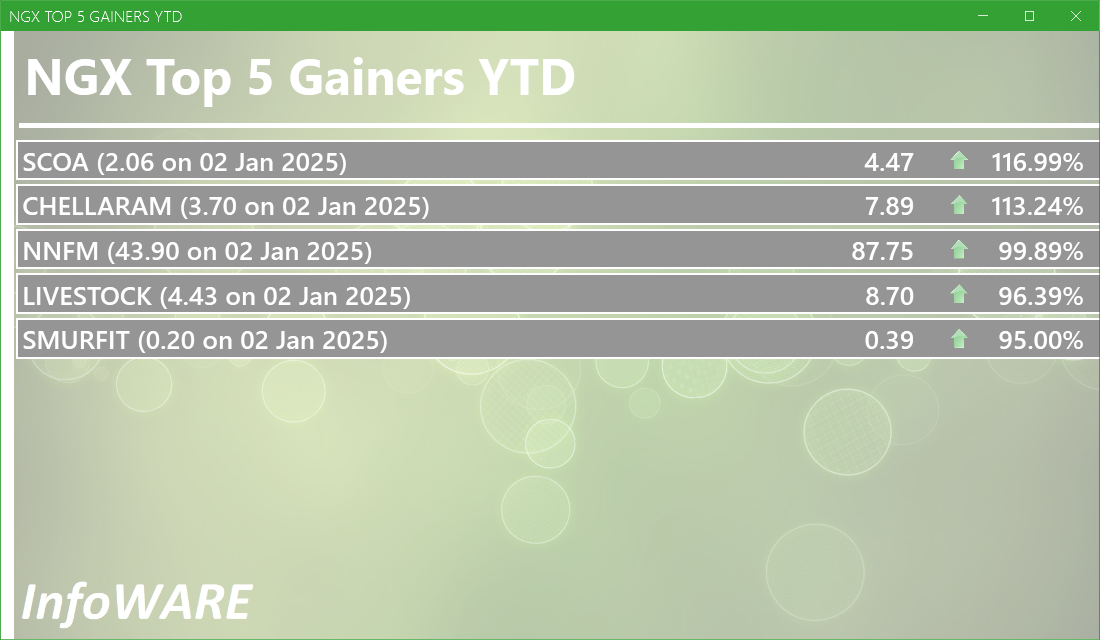
For more detailed analysis,
- On InfoWARE Market Data Terminal <T5YTD2> <GO>
- On InfoWARE Finance Mobile App ( Android , iPhone & iPad and Windows 10) , "Research"
NSE: Bull Signal - Price crossed above 15 Day MA
This signal implies these stocks are under buying pressure and the price might continue to rise and therefore positions should be monitored closely. Further suggested analysis include looking at the overall market (ASI) to see if the uptrend is market wide, sector wide or specific to the stock. Portfolio managers tend to use this as a signal to do more research to add to their positions or lock in some profits. Typically further analysis should be done using commands like PC and RV on the InfoWARE Market Data Terminal. Another command is ALERTS to set price triggers for possible exit or entry as necessary
For more detailed analysis,
- On InfoWARE Market Data Terminal <NSEPERF> <GO>
- On InfoWARE Finance Mobile App ( Android , iPhone & iPad and Windows 10) , "Top Gainers & Losers"
| Symbol | Price | %Chg | 15DMA | PE | EPS | DivY | MktCap | Vol | Trades | Value | LstTradeTime |
|---|---|---|---|---|---|---|---|---|---|---|---|
| UPDC | 2.97 | 9.09 | 2.83 | 0.00 | 0.00 | 34.25 | 55.12B | 1.66M | 61.00 | 4.92M | 28-Mar-2025 14:30:36.860 |
| FGSUK2032S5 | 102.80 | 6.61 | 101.00 | 0.00 | 0.00 | 1.80K | 3.00 | 1.62M | 28-Mar-2025 14:30:54.373 | ||
| NAHCO | 66.90 | 6.58 | 63.20 | 92.98 | 0.41 | 6.66 | 130.39B | 3.08M | 224.00 | 206.27M | 28-Mar-2025 14:30:33.053 |
| TOTAL | 679.70 | 6.28 | 639.85 | 123.83 | 5.44 | 3.71 | 230.77B | 162.53K | 69.00 | 109.07M | 28-Mar-2025 14:30:35.900 |
| CHAMS | 2.16 | 5.56 | 2.11 | 27.02 | 0.07 | 1.56 | 10.14B | 4.89M | 90.00 | 10.44M | 28-Mar-2025 14:31:25.250 |
| MRS | 174.90 | 4.46 | 171.61 | 26.62 | 4.96 | 1.79 | 59.97B | 411.69K | 178.00 | 70.30M | 28-Mar-2025 14:30:32.780 |
| DEAPCAP | 0.96 | 4.17 | 0.94 | 188.84 | 0.01 | 13.76 | 1.44B | 3.32M | 52.00 | 2.96M | 28-Mar-2025 14:30:31.043 |
| MERGROWTH | 390.00 | 2.56 | 385.93 | 0.00 | 0.00 | 70.00 | 2.00 | 26.62K | 28-Mar-2025 14:31:32.500 | ||
| NGXAFRHDYI | 16,758.62 | 1.30 | 16,622.74 | 7.46 | 39.30 | 0.00 | 0.00 | 188.37M | 3,523.00 | 6.76B | 28-Mar-2025 14:30:55.893 |
| NGXMAINBOARD | 5,068.76 | 0.37 | 5,060.23 | 12.90 | 225.05 | 0.00 | 0.00 | 451.82M | 9,259.00 | 10.13B | 28-Mar-2025 14:30:56.493 |
| NGX30 | 3,922.34 | 0.25 | 3,917.86 | 575.61 | 329.08 | 0.00 | 0.00 | 214.80M | 6,914.00 | 11.34B | 28-Mar-2025 14:30:55.820 |
| NGXPENBRD | 1,890.00 | 0.23 | 1,887.53 | 348.78 | 389.18 | 0.00 | 0.00 | 442.36M | 9,967.00 | 12.41B | 28-Mar-2025 14:30:56.633 |
| ASI | 105,670.36 | 0.23 | 105,649.01 | 11.84 | 457.69 | 0.00 | 0.00 | 526.66M | 12,609.00 | 12.83B | 28-Mar-2025 14:30:55.767 |
NSE: BEAR Signal - Price crossed below 15 Day MA
This signal implies these stocks are under selling pressure and the price might continue to slide and therefore positions should be monitored closely. Further suggested analysis include looking at the overall market (ASI) to see if the downtrend is market wide, sector wide or specific to the stock. If the overal market trend is upwards, then since these stocks are heading in the opposite direction, then further analysis should be done using commands like PC and RV on the InfoWARE Market Data Terminal. Another command is ALERTS to set price triggers for possible exit is necessar
For more detailed analysis,
- On InfoWARE Market Data Terminal <BEARM> <GO>
- On InfoWARE Finance Mobile App ( Android , iPhone & iPad and Windows 10)
| Symbol | Price | %Chg | 15DMA | PE | EPS | DivY | MktCap | Vol | Trades | Value | LstTradeTime |
|---|---|---|---|---|---|---|---|---|---|---|---|
| FGS202768 | 100.00 | 0.00 | 100.00 | 0.00 | 0.00 | 0.00 | 0.00 | 0.00 | 28-Mar-2025 14:30:53.497 | ||
| HONYFLOUR | 12.35 | -1.62 | 12.46 | 16.28 | 0.31 | 1.40 | 97.94B | 2.42M | 142.00 | 29.65M | 28-Mar-2025 14:30:31.527 |
| ZENITHBANK | 47.00 | -1.70 | 47.69 | 3.33 | 13.30 | 2.25 | 1,475.64B | 23.20M | 964.00 | 1.10B | 28-Mar-2025 14:31:33.130 |
| WEMABANK | 10.70 | -1.87 | 10.85 | 216.91 | 0.04 | 5.81 | 137.58B | 14.93M | 312.00 | 155.88M | 28-Mar-2025 14:30:37.560 |
| VERITASKAP | 1.11 | -3.60 | 1.12 | 48.77 | 0.02 | 4.17 | 15.39B | 5.31M | 70.00 | 6.04M | 28-Mar-2025 14:30:37.060 |
| VETGRIF30 | 39.50 | -3.80 | 40.76 | 0.00 | 0.00 | 1.00K | 4.00 | 39.85K | 28-Mar-2025 14:31:32.760 | ||
| FGSUK2027S3 | 76.00 | -5.26 | 79.73 | 0.00 | 0.00 | 3.00 | 1.00 | 2.28K | 28-Mar-2025 14:30:54.240 | ||
| VETINDETF | 40.00 | -5.50 | 42.00 | 0.00 | 0.00 | 5.00 | 1.00 | 200.00 | 28-Mar-2025 14:31:32.773 | ||
| LASACO | 2.60 | -5.77 | 2.70 | 21.56 | 0.11 | 4.05 | 4.77B | 701.32K | 28.00 | 1.82M | 28-Mar-2025 14:30:31.997 |
| NEIMETH | 2.81 | -6.76 | 2.91 | 125.52 | 0.02 | 3.38 | 12.01B | 212.51K | 26.00 | 607.57K | 28-Mar-2025 14:30:33.520 |
| LIVESTOCK | 8.70 | -8.28 | 9.28 | 0.00 | 0.00 | 2.94 | 26.10B | 1.63M | 128.00 | 14.37M | 28-Mar-2025 14:31:25.410 |
| RTBRISCOE | 2.40 | -8.33 | 2.50 | 0.00 | 0.00 | 4.35 | 2.82B | 2.43M | 28.00 | 5.94M | 28-Mar-2025 14:30:35.207 |
| VETGOODS | 18.00 | -10.00 | 19.65 | 0.00 | 0.00 | 5.00 | 1.00 | 90.00 | 28-Mar-2025 14:31:32.730 | ||
| INTENEGINS | 1.62 | -11.11 | 1.75 | 0.52 | 2.85 | 3.40 | 2.08B | 576.77K | 7.00 | 943.11K | 28-Mar-2025 14:30:31.700 |
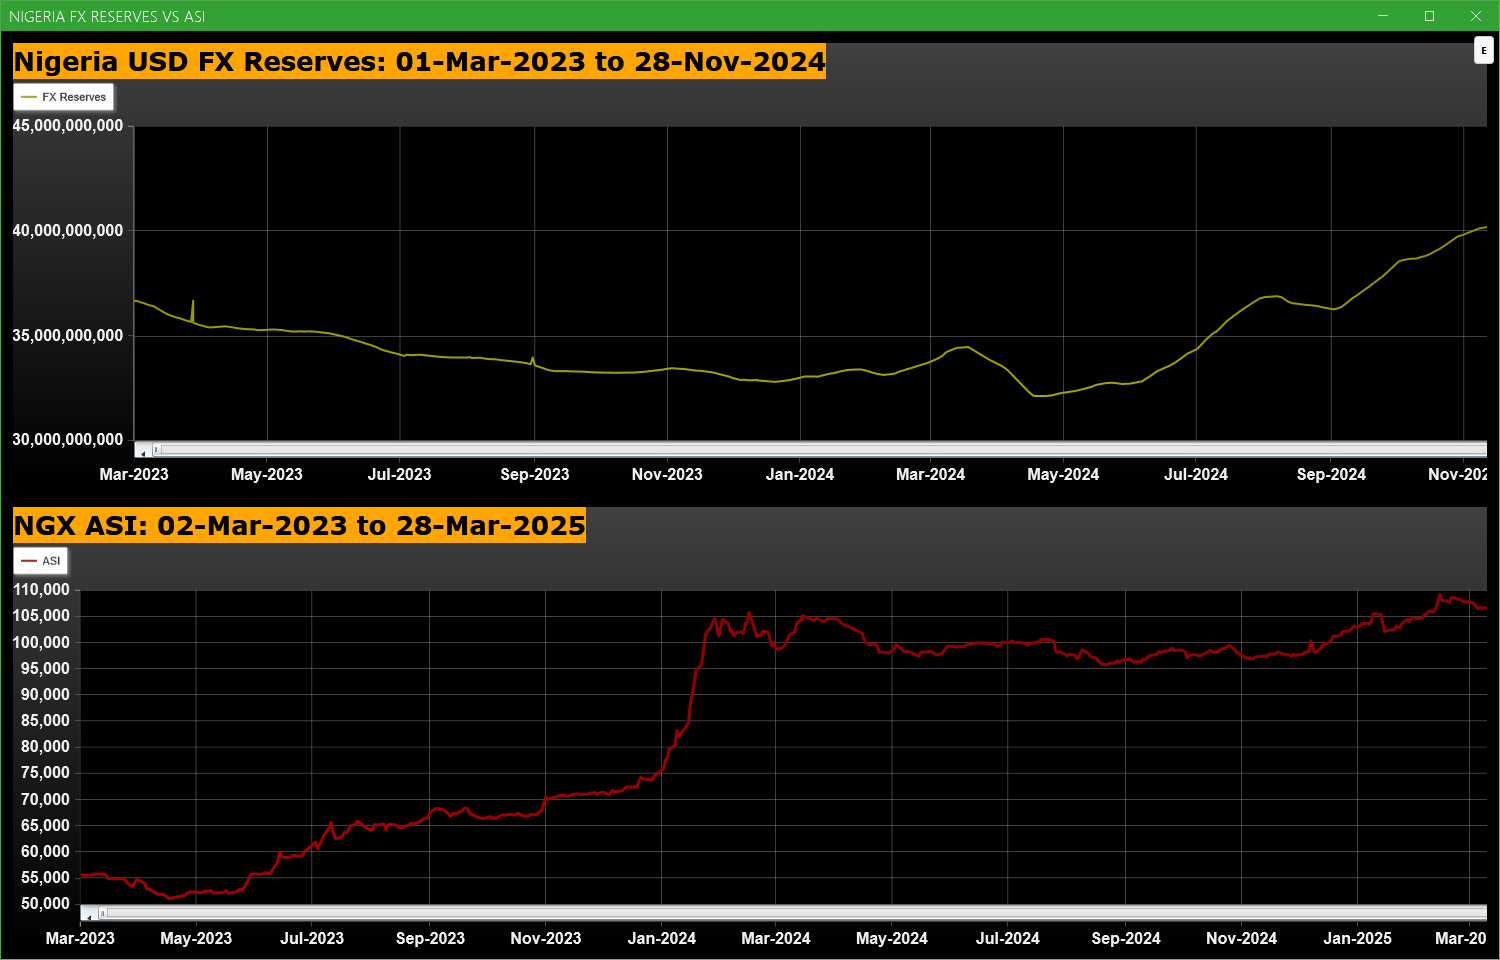
Economic Indicators - Nigeria FX Reserves Vs ASI Chart
Nigeria FX Reserves are assets held on reserve by CBN in foreign currencies. These reserves are used to back liabilities and influence monetary policy. Given the nature of the Nigeria economy, FX Reserves can appear to have an outsize influence on the economy and hence on the capital market. The chart below allows comparison of FX Reserves against the ASI to make investment decisions
For more detailed analysis,
- On InfoWARE Market Data Terminal <CI> <GO>
- On InfoWARE Finance Mobile App ( Android , iPhone & iPad and Windows 10) , "Research"
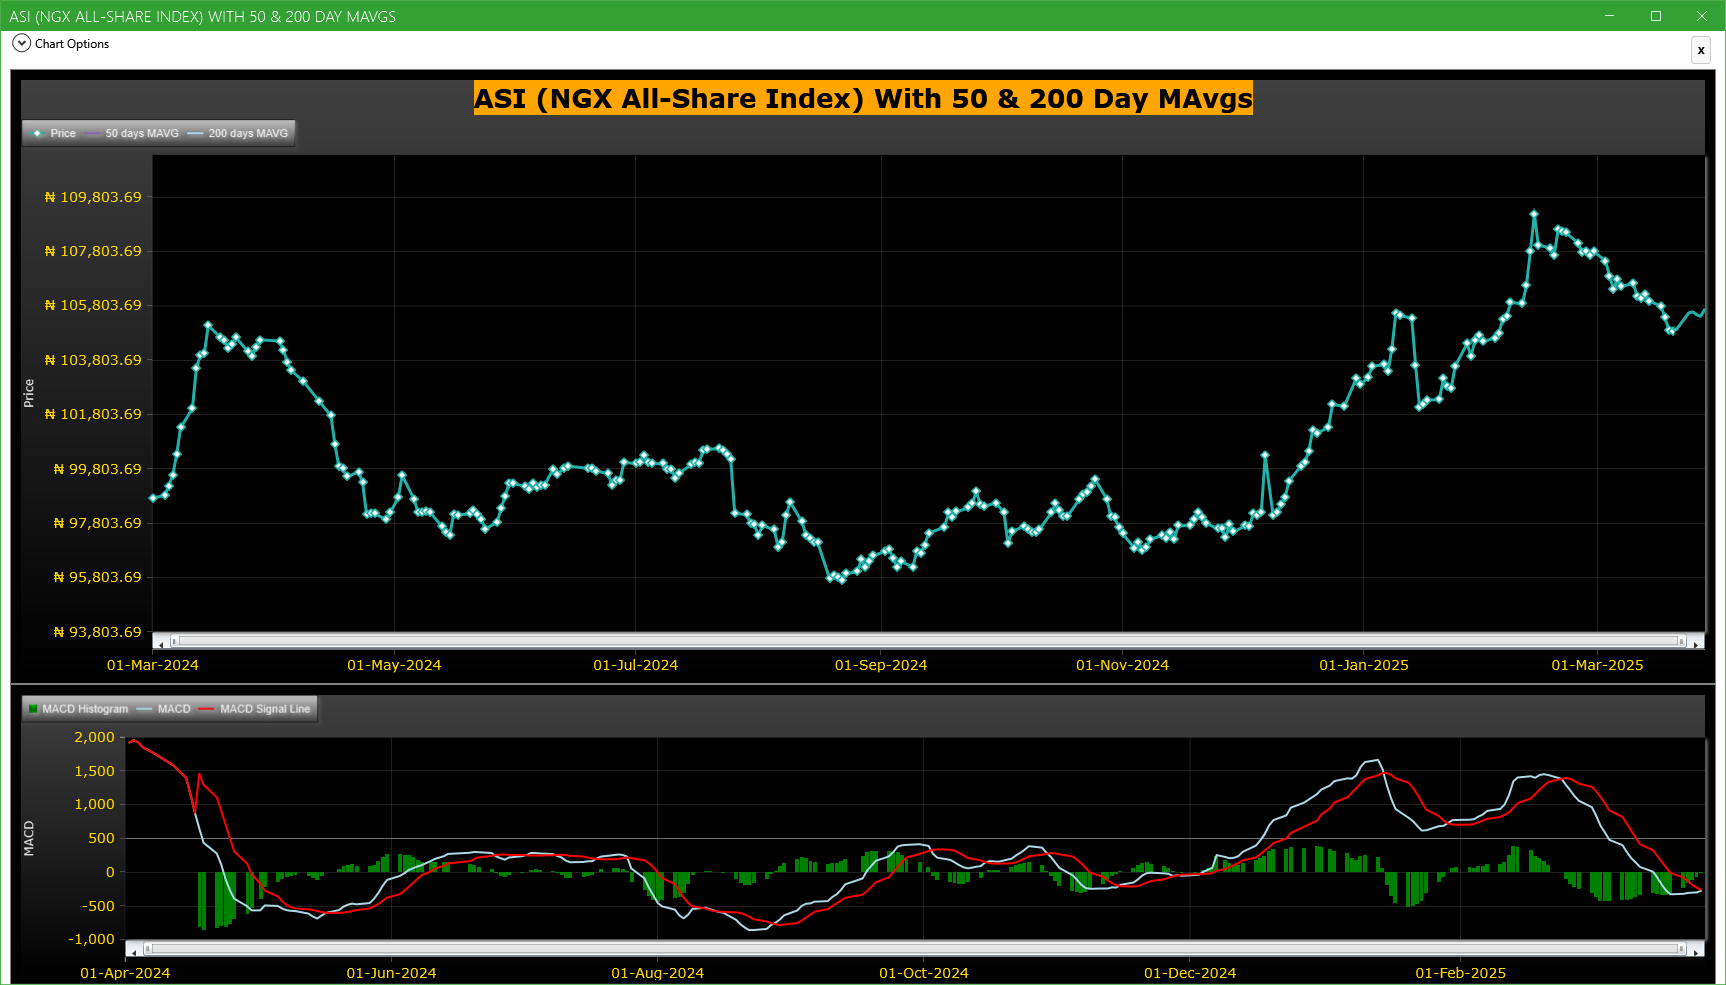
Market Trend - ASI (NGX All-Share-Index) With 50 & 200 Day MAvgs Chart
Technical traders typically use the 50 & 200 day moving averages to aid in choosing
where to enter or exit a position, which then causes these levels to act as strong
support or resistance. As a general guideline, if the price is above a moving average,
the trend is up. If the price is below a moving average, the trend is down.
It is important to note that critics of technical analysis say that moving averages act
as support and resistance because so many traders use these indicators to inform their
trading decisions. Also moving averages tend to work quite well in strong trending conditions
but poorly in choppy or ranging conditions.
Trading Strategies: Crossovers
Crossovers are one of the main moving average strategies. The first type is a price crossover,
which is when the price crosses above or below a moving average to signal a potential change
in trend. Another strategy is to apply two moving averages to a chart: one longer and one
shorter. When the shorter-term MA crosses above the longer-term MA, it is a buy signal, as
it indicates that the trend is shifting up. This is known as a golden cross. Meanwhile, when
the shorter-term MA crosses below the longer-term MA, it is a sell signal, as it indicates that
the trend is shifting down. This is known as a dead/death cross
For more detailed analysis,
- On InfoWARE Market Data Terminal <CI> <GO>
- On InfoWARE Finance Mobile App ( Android , iPhone & iPad and Windows 10) , "Research"
Unusual Volume: Volume traded is more than double the 90 day moving average (All exchanges; ASI & ASem). For more detailed analysis,
- On InfoWARE Market Data Terminal <UV> <GO>
- On InfoWARE Finance Mobile App ( Android , iPhone & iPad and Windows 10)
| Symbol | Name | Volume | 90DAvgVol | %VolChg | Price | LClose | %Chg | Trades | Value |
|---|---|---|---|---|---|---|---|---|---|
| MBENEFIT | MUTUAL BENEFITS ASSURANCE PLC. | 73.94M | 496.45K | 14,794.49 | 1.05 | 0.96 | 9.38 | 233 | 77.46M |
| CUTIX | CUTIX PLC. | 72.03M | 10.55M | 582.78 | 2.50 | 2.49 | 0.40 | 83 | 179.10M |
| GTCO | GUARANTY TRUST HOLDING COMPANY PLC | 67.85M | 14.09M | 381.65 | 68.80 | 64.25 | 7.08 | 1,085 | 4.57B |
| FIDELITYBK | FIDELITY BANK PLC | 47.55M | 20.26M | 134.76 | 19.00 | 19.15 | -0.78 | 457 | 904.25M |
| MANSARD | MANSARD INSURANCE PLC | 13.95M | 2.71M | 414.71 | 8.60 | 9.05 | -4.97 | 209 | 131.33M |
Investment Insights - High Div. Stocks
Dividend stocks distribute a portion of the company earnings to investors on a regular basis and they can a great choice for investors looking for regular income. As an investment or trading strategy, high dividend yield equities provide annual cash payments as against mostly capital gains in the price of a stock. The list in the table below represent the highest dividend paying stocks from the list of the most liquid stocks in the NSE top 30.
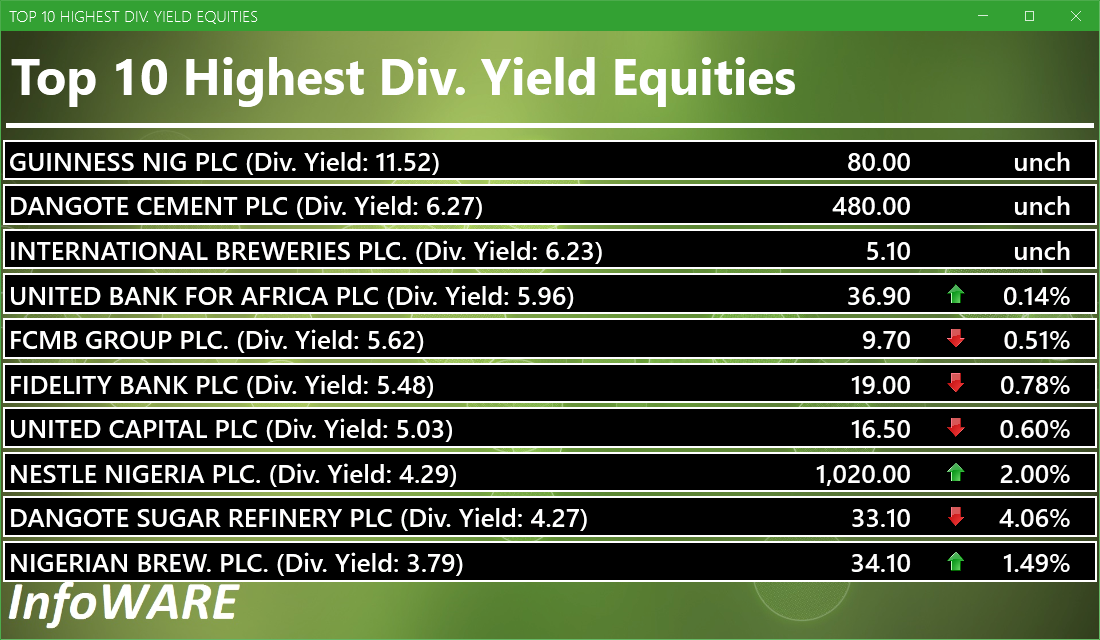
For more detailed analysis,
- On InfoWARE Market Data Terminal <HYIELD> <GO>
- On InfoWARE Finance Mobile App ( Android , iPhone & iPad and Windows 10) , "Research"
Investment Insights - Stocks outperforming the ASI but with approximately the same risk
These list of stocks represent equities that are less risky than the ASI but doing better than the ASI (All Shares Index) using the YTD (Year to Date) returns as the measure. The risk is measured by Beta. Beta is an assessment of a stock's tendency to undergo price changes, (its volatility), as well as its potential returns compared to the ASI. It is expressed as a ratio, where a score of 1 represents performance comparable to the ASI, and returns above or below the market may receive scores greater or lower than 1.
For a full list of both positively and negatively corelated stocks visit InfoWARE Market Data Terminal
- On InfoWARE Market Data Terminal <BANL> <GO>
- On InfoWARE Finance Mobile App ( Android , iPhone & iPad and Windows 10)
| Symbol | DivYield | PE | EPS | Beta | %ChgYTD | ASIYTDReturn | BetaDiff |
|---|---|---|---|---|---|---|---|
| HONYFLOUR | 1.40 | 16.28 | 0.31 | 0.99 | 78.47 | 2.41 | 0.01 |
| FIDELITYBK | 5.48 | 13.24 | 1.17 | 0.89 | 11.76 | 2.41 | 0.11 |
| NB | 3.79 | 16.95 | 1.60 | 0.79 | 6.56 | 2.41 | 0.21 |
| UNILEVER | 2.81 | 67.09 | 0.40 | 0.75 | 6.81 | 2.41 | 0.25 |
| HMCALL | 0.00 | 0.00 | 0.00 | -0.74 | 20.53 | 2.41 | 0.26 |
| VETGOODS | 0.00 | 0.71 | 4.65 | 2.41 | 0.29 | ||
| VETGRIF30 | 0.00 | 0.71 | 4.64 | 2.41 | 0.29 | ||
| ABBEYBDS | 1.43 | 0.00 | 0.00 | 0.70 | 57.67 | 2.41 | 0.30 |
| NEM | 6.52 | 24.99 | 0.37 | 0.69 | 12.50 | 2.41 | 0.31 |
| TANTALIZER | 1.50 | 0.00 | 0.00 | 0.69 | 28.89 | 2.41 | 0.31 |
African Markets
| Name | LClose | Change | %Chg |
|---|---|---|---|
| BRVM Stock Exchange | 284.48 | 1.36 | 0.48 |
| Botswana Stock Exchange | 10,067.48 | 1.01 | 0.01 |
| Egyptian Exchange | 31,933.76 | 256.59 | 0.81 |
| Ghana Stock Exchange | 6,126.08 | -53.76 | -0.87 |
| Lusaka Stock Exchange | 15,349.16 | 26.05 | 0.17 |
| Casablanca Stock Exchange | 17,858.90 | 237.88 | 1.35 |
| Malawi Stock Exchange | 291,645.26 | -408.88 | -0.14 |
| Nigeria Stock Exchange | 105,551.39 | 587.80 | 0.56 |
| Nairobi Securities Exchange | 129.75 | -0.47 | -0.36 |
| Rwanda Stock Exchange | 148.94 | 0.00 | 0.00 |
| Uganda Securities Exchange | 1,310.01 | 4.83 | 0.37 |
Nigeria Market Indexes
| Symbol | LClose | %Chg | WTD% | MTD% | QTD% | YTD% | MktCap | Trades |
|---|---|---|---|---|---|---|---|---|
| ASI | 105,670.36 | 0.23 | 0.11 | -1.66 | 2.41 | 2.41 | 12,609 | |
| NGX30 | 3,922.34 | 0.25 | 0.13 | -1.68 | 2.82 | 2.82 | 6,914 | |
| NGXAFRBVI | 2,646.53 | 2.03 | 2.15 | 1.60 | 6.68 | 6.68 | 3,724 | |
| NGXAFRHDYI | 16,758.62 | 1.32 | 1.82 | -1.51 | -1.58 | -1.58 | 3,523 | |
| NGXASEM | 1,587.89 | 0.00 | 0.00 | 0.08 | 0.26 | 0.26 | 5 | |
| NGXBNK | 1,159.99 | 1.28 | 1.76 | 0.72 | 6.67 | 6.67 | 3,669 | |
| NGXCG | 3,009.51 | 0.99 | 1.32 | 0.27 | 6.37 | 6.37 | 7,464 | |
| NGXCNSMRGDS | 1,815.85 | 0.21 | 0.26 | -0.27 | 4.70 | 4.70 | 1,164 | |
| NGXGROWTH | 7,401.79 | -0.29 | 0.24 | -6.05 | -4.65 | -4.65 | 133 | |
| NGXINDUSTR | 3,489.87 | 0.00 | 0.02 | -3.57 | -2.29 | -2.29 | 533 | |
| NGXINS | 698.54 | -1.28 | 3.43 | -1.92 | -11.15 | -11.15 | 1,714 | |
| NGXLOTUSISLM | 7,551.18 | 0.60 | 0.11 | -2.05 | 8.37 | 8.37 | 1,391 | |
| NGXMAINBOARD | 5,068.76 | 0.37 | 0.38 | -1.23 | 1.30 | 1.30 | 9,259 | |
| NGXMERIGRW | 6,930.25 | -0.04 | 0.67 | -3.40 | 6.24 | 6.24 | 1,411 | |
| NGXMERIVAL | 10,274.99 | 0.01 | -1.03 | -4.50 | -1.49 | -1.49 | 3,871 | |
| NGXOILGAS | 2,458.69 | -0.02 | -2.03 | -4.42 | -9.31 | -9.31 | 371 | |
| NGXPENBRD | 1,890.00 | 0.23 | 0.23 | -1.52 | 3.19 | 3.19 | 9,967 | |
| NGXPENSION | 4,785.90 | 0.75 | 0.81 | -0.18 | 5.56 | 5.56 | 7,643 | |
| NGXPREMIUM | 10,171.85 | -0.03 | -0.39 | -2.44 | 4.51 | 4.51 | 3,217 | |
| NGXSOVBND | 626.86 | 0.00 | 1.04 | 0.69 | 4.21 | 4.21 | 0 |
For more detailed analysis,
- On InfoWARE Market Data Terminal <MKTINS> <GO>
- On InfoWARE Finance Mobile App ( Android, iPhone & iPad and Windows 10) , "Market Indexes"
Find the topic interesting? Will like to comment? Contact Us at solutions@infowarelimited.com
Top News

InfoWARE AI Analyst Daily Market Report: 28-Mar-2025
InfoWARE AI Analyst Daily Market Report: 28-Mar-2025
InfoWARE AI Analyst Weekly Market Report: 28-Mar-2025
Chart Of The Day - ASI Chart Vs ASI Advance Decline Line (YTD) (28-Mar-2025 15:07:49.477)
InfoWARE AI Analyst Daily Market Report: 28-Mar-2025

[MRS]>>Corporate Disclosures-<MRS OIL NIGERIA PLC.>
[XNSA]>> PUBLIC HOLIDAY
[MERGROWTH]>> DAILY INDICATIVE PRICES
[XNSA]>> OFF MARKET TRADE
[VSPBONDETF]>> DAILY INDICATIVE PRICES
[LOTUSHAL15]>> DAILY INDICATIVE PRICES
[XNSA]>> NGX FIXED INCOME INDICATIVE PRICE LIST FOR MAR 28, 2025
[XNSA]>> EMERGING AFRICA DAILY MUTUAL FUND PRICES
[PZ]>>Corporate Disclosures-<P Z CUSSONS NIGERIA PLC.>
[DANGCEM]>>Corporate Disclosures-<DANGOTE CEMENT PLC>
[WAPCO]>>Corporate Disclosures-<LAFARGE AFRICA PLC.>
[XNSA]>> DAILY FUND PRICE SUBMISSION - FCMB ASSET MANAGEMENT LIMITED

CardinalStone Earnings Update - Ecobank Transnational Incorporated Plc FY'24 Audited results - Sturdy FY'24 earnings amid moderating costs

Daily Business News Brief
[XNSA]>> NOTIFICATION OF PRICE ADJUSTMENT
[DANGSUGAR]>>Notice of Meeting -<DANGOTE SUGAR REFINERY PLC>
Chart Of The Day - ASI Chart Vs ASI Advance Decline Line (YTD) (27-Mar-2025 15:09:09.356)
InfoWARE AI Analyst Daily Market Report: 27-Mar-2025
[XNSA]>> CORDROS MILESTONE FUNDS' BID & OFFER PRICES
[RONCHESS]>>Corporate Disclosures-<RONCHESS GLOBAL RESOURCES PLC>
[LASACO]>>Corporate Disclosures-<LASACO ASSURANCE PLC.>
[XNSA]>> EMERGING AFRICA DAILY MUTUAL FUND PRICES
Breaking News! Unusual Volume Alert (27-Mar-2025 11:21:10.963)
Breaking News! Bulls Momentum Alert (27-Mar-2025 11:21:06.954)
Breaking News! Bears Momentum Alert (27-Mar-2025 11:21:06.862)
Get IDIA - the stock trading app for the modern investor
Solutions by Business
Product Suites
Company
Contacts
- 8th Floor,
- South Atlantic Petroleum Towers,
- 1 Adeola Odeku Street,
- Victoria Island,
- Lagos, Nigeria.
- Email: solutions@infowarelimited.com
Follow Us
 |
 |
 |
 |