


InfoWARE AI Analyst Daily Market Report: 09-Apr-2025 | InfoWARE Finance
Get IDIA - the stock trading app for the modern investor


InfoWARE AI Analyst Daily Market Report: 09-Apr-2025
(Source: InfoWARE Terminal, Date: 09-Apr-2025)
Dear Investor,
NGX Market Summary - Monday, April 7, 2025
Key Market Performance
The NGX All-Share Index (ASI) fell -1.23% to close at 105,511.89, trimming YTD gains to +1.00%. Market breadth remained weak at 0.16x (9 advancers vs 56 decliners), though turnover surged +28.2% to ₦9.81B. The Naira weakened slightly to ₦1,539/USD (-0.20%).
🔍 Critical Observations
- Momentum Extremes: VFDGROUP (+10%) hit overbought RSI 83.4 while OANDO (-10%) plunged to oversold RSI 26.1
- Institutional Dominance: Institutions drove 85.93% of trade value despite only 12.94% of trade count
- Volume Surges: FCMB saw +503% volume spike, MBENEFIT +673% - both insurance stocks
📊 Technical Crosscurrents
| Stock | Price | RSI | MACD Signal | 15D/50D MA |
|---|---|---|---|---|
| ABBEYBDS | ₦5.15 | 98.4 (Extreme OB) | Bullish Crossover | ▲15D > ▼50D |
| OANDO | ₦37.80 | 26.1 (Severe OS) | Bearish Expansion | ▼15D < ▼50D |
⚠️ Contrarian Signals
- TOTAL (+9.61% today, RSI 77.8) remains a YTD underperformer at +6.73%
- GUINEAINS (+9.52%) shows bearish MACD divergence despite price surge
- ZENITHBANK (Institutional favorite) trades at PE 3.33 vs sector average 6.10
🏦 Institutional Clustering
| Stock | Inst. Trade Share | Beta | Dividend Yield |
|---|---|---|---|
| GTCO | 19.80% | 1.09 | 1.88% |
| ZENITHBANK | 12.07% | 1.20 | 2.25% |
💡 Trader's Edge
- Defensive Plays: NSLTECH offers 15.87% yield at Beta 0.68
- Momentum Watch: VFDGROUP's 15D MA crossing 50D MA suggests extended rally
- Sector Rotation: Insurance stocks show mixed signals - GUINEAINS volume surge vs MBENEFIT institutional selling
📈 Retail vs Institutional Activity
| Metric | Retail | Institutional |
|---|---|---|
| Trade Count | 87.06% | 12.94% |
| Trade Value | 14.07% | 85.93% |
Notable Divergence: Retail dominated ACCESSCORP (1004 trades) while institutions concentrated on GTCO (19.8% value share). Banking stocks accounted for 63% of institutional flow vs 41% retail.
🚨 Critical Warning
ABBEYBDS shows extreme overbought conditions (RSI 98.4) despite +71.67% YTD gain. Combined with zero PE ratio, this suggests speculative frenzy disconnected from fundamentals.
|
Top ASI Gainers Over Last 5 Trading Days
|
Top ASI Losers Over Last 5 Trading Days
|
For more detailed analysis, on InfoWARE Market Data Terminal <NSEPERF> <GO>
On InfoWARE Finance Mobile App (Android, iPhone & iPad, Windows Phone and Windows 8/10), "Top Gainers & Losers"
LIVESTOCK FEEDS PLC. (LIVESTOCK) topped the advancers list closing at N8.03 with a gain of 10.00% followed by VFD GROUP PLC (VFDGROUP) which closed at N72.60 with a gain of 10.00%.
On the flip side HALDANE MCCALL PLC (HMCALL) and LEARN AFRICA PLC (LEARNAFRCA) topped the decliners log with a loss of -10.00% at a close of N5.22, and -10.00% to close the day at N2.97 respectively.
| Symbol | LClose | %Chg |
|---|---|---|
| LIVESTOCK | 8.03 | 10.00 |
| VFDGROUP | 72.60 | 10.00 |
| NGXGROUP | 35.65 | 9.86 |
| WAPIC | 1.94 | 9.60 |
| UNIONDICON | 6.35 | 9.48 |
| Symbol | LClose | %Chg |
|---|---|---|
| HMCALL | 5.22 | -10.00 |
| LEARNAFRCA | 2.97 | -10.00 |
| ETI | 26.85 | -9.90 |
| PZ | 30.10 | -9.88 |
| UNILEVER | 34.70 | -9.75 |
For more detailed analysis,
- On InfoWARE Market Data Terminal <TOPG> <GO>
- On InfoWARE Finance Mobile App ( Android, iPhone & iPad and Windows 10) , "Top Gainers & Losers"
Currency Market
In the currency market, the Naira fell 0.13%(-2.06) against the Dollar to settle at 1 to 1NSE: Bull Signal - Price crossed above 15 Day MA
This signal implies these stocks are under buying pressure and the price might continue to rise and therefore positions should be monitored closely. Further suggested analysis include looking at the overall market (ASI) to see if the uptrend is market wide, sector wide or specific to the stock. Portfolio managers tend to use this as a signal to do more research to add to their positions or lock in some profits. Typically further analysis should be done using commands like PC and RV on the InfoWARE Market Data Terminal. Another command is ALERTS to set price triggers for possible exit or entry as necessary
For more detailed analysis,
- On InfoWARE Market Data Terminal <NSEPERF> <GO>
- On InfoWARE Finance Mobile App ( Android , iPhone & iPad and Windows 10) , "Top Gainers & Losers"
| Symbol | Price | %Chg | 15DMA | PE | EPS | DivY | MktCap | Vol | Trades | Value | LstTradeTime |
|---|---|---|---|---|---|---|---|---|---|---|---|
| MCNICHOLS | 1.60 | 6.25 | 1.59 | 26.80 | 0.05 | 5.88 | 1.15B | 176.00K | 8.00 | 277.68K | 09-Apr-2025 14:31:58.000 |
| CHAMPION | 3.95 | 5.06 | 3.89 | 412.83 | 0.01 | 0.41 | 30.93B | 172.49K | 15.00 | 679.95K | 09-Apr-2025 14:30:37.710 |
| NASCON | 43.95 | 4.89 | 43.45 | 24.28 | 1.33 | 3.09 | 116.44B | 1.68M | 114.00 | 71.52M | 09-Apr-2025 14:30:42.410 |
| NGXGROWTH | 7,385.39 | 0.31 | 7,385.00 | 18.83 | 0.18 | 0.00 | 0.00 | 939.55K | 52.00 | 3.45M | 09-Apr-2025 14:30:56.213 |
NSE: BEAR Signal - Price crossed below 15 Day MA
This signal implies these stocks are under selling pressure and the price might continue to slide and therefore positions should be monitored closely. Further suggested analysis include looking at the overall market (ASI) to see if the downtrend is market wide, sector wide or specific to the stock. If the overal market trend is upwards, then since these stocks are heading in the opposite direction, then further analysis should be done using commands like PC and RV on the InfoWARE Market Data Terminal. Another command is ALERTS to set price triggers for possible exit is necessar
For more detailed analysis,
- On InfoWARE Market Data Terminal <BEARM> <GO>
- On InfoWARE Finance Mobile App ( Android , iPhone & iPad and Windows 10)
| Symbol | Price | %Chg | 15DMA | PE | EPS | DivY | MktCap | Vol | Trades | Value | LstTradeTime |
|---|---|---|---|---|---|---|---|---|---|---|---|
| FGSUK2032S5 | 100.00 | 0.00 | 100.04 | 0.00 | 0.00 | 0.00 | 0.00 | 0.00 | 09-Apr-2025 14:30:54.327 | ||
| GUINEAINS | 0.68 | -1.47 | 0.69 | 66.79 | 0.01 | 1.96 | 4.18B | 1.13M | 46.00 | 768.75K | 09-Apr-2025 14:30:40.057 |
| FIDELITYBK | 17.90 | -3.35 | 18.42 | 13.24 | 1.17 | 5.48 | 518.65B | 7.40M | 307.00 | 133.51M | 09-Apr-2025 14:30:39.630 |
| UNILEVER | 34.70 | -10.81 | 38.06 | 67.09 | 0.40 | 2.81 | 199.35B | 2.44M | 77.00 | 84.74M | 09-Apr-2025 14:30:45.353 |
| ETI | 26.85 | -10.99 | 29.18 | 5.00 | 5.10 | 2.00 | 492.69B | 2.38M | 38.00 | 64.63M | 09-Apr-2025 14:30:39.383 |
| LEARNAFRCA | 2.97 | -11.11 | 3.18 | 5.79 | 0.51 | 8.53 | 2.29B | 2.52M | 26.00 | 7.50M | 09-Apr-2025 14:30:41.513 |
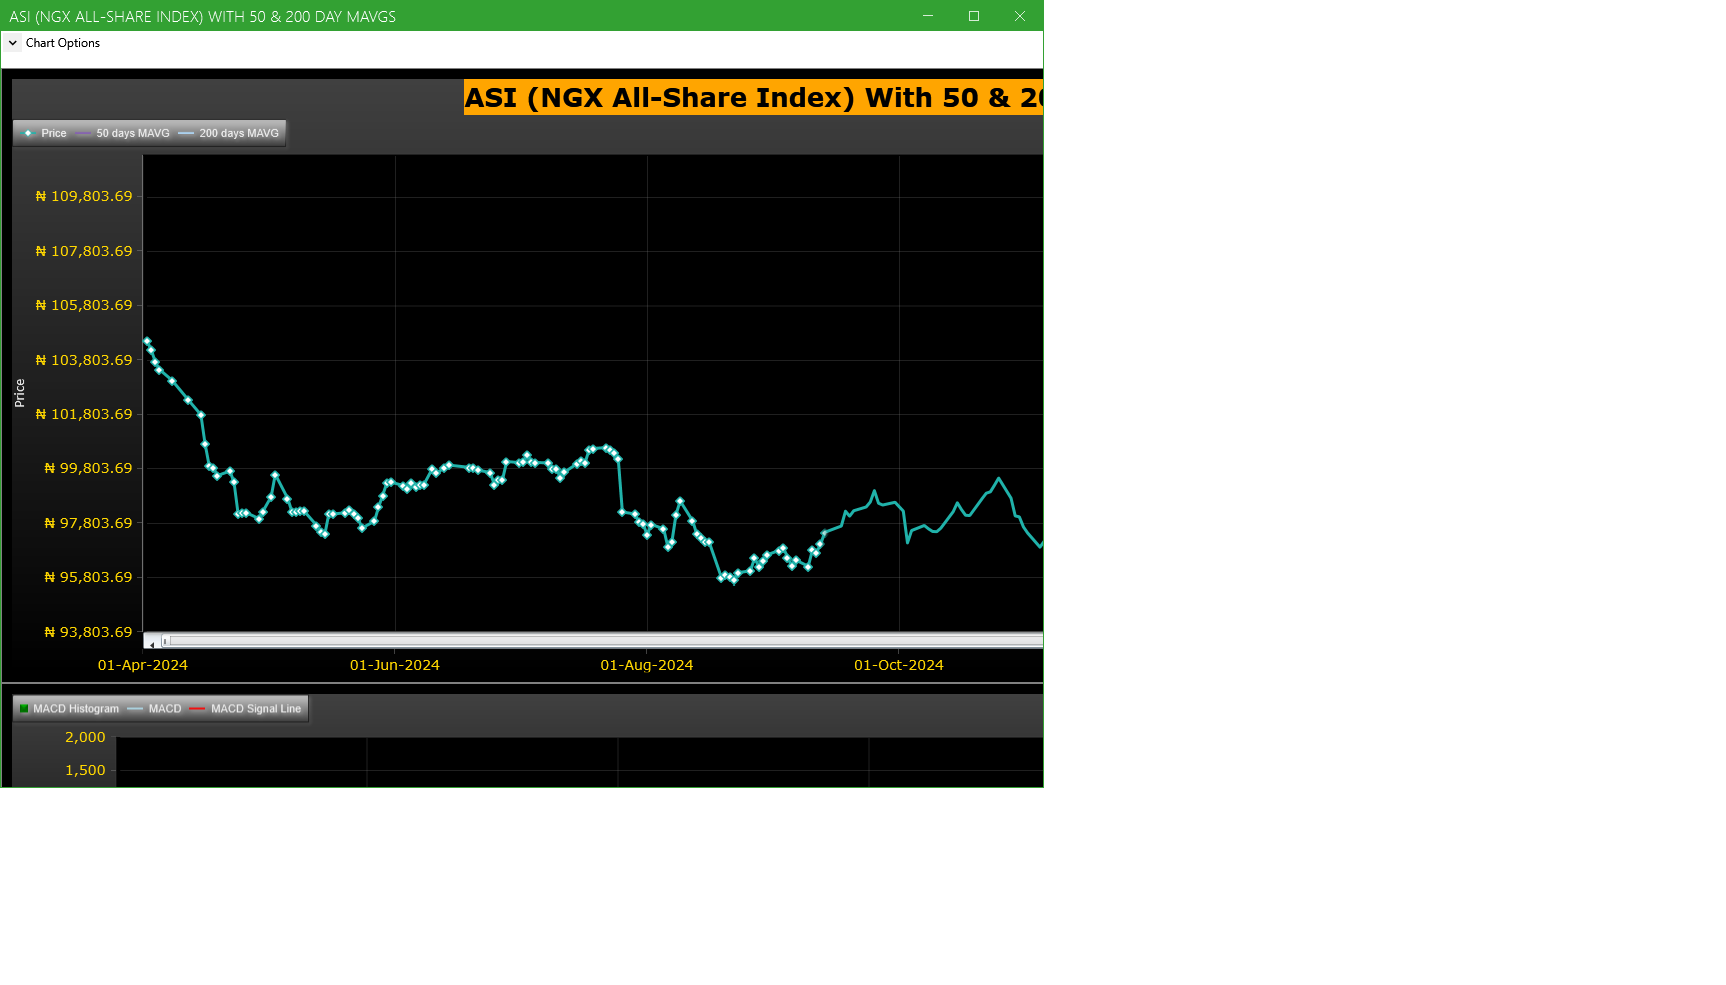
Market Trend - ASI (NGX All-Share-Index) With 50 & 200 Day MAvgs Chart
Technical traders typically use the 50 & 200 day moving averages to aid in choosing
where to enter or exit a position, which then causes these levels to act as strong
support or resistance. As a general guideline, if the price is above a moving average,
the trend is up. If the price is below a moving average, the trend is down.
It is important to note that critics of technical analysis say that moving averages act
as support and resistance because so many traders use these indicators to inform their
trading decisions. Also moving averages tend to work quite well in strong trending conditions
but poorly in choppy or ranging conditions.
Trading Strategies: Crossovers
Crossovers are one of the main moving average strategies. The first type is a price crossover,
which is when the price crosses above or below a moving average to signal a potential change
in trend. Another strategy is to apply two moving averages to a chart: one longer and one
shorter. When the shorter-term MA crosses above the longer-term MA, it is a buy signal, as
it indicates that the trend is shifting up. This is known as a golden cross. Meanwhile, when
the shorter-term MA crosses below the longer-term MA, it is a sell signal, as it indicates that
the trend is shifting down. This is known as a dead/death cross
For more detailed analysis,
- On InfoWARE Market Data Terminal <CI> <GO>
- On InfoWARE Finance Mobile App ( Android , iPhone & iPad and Windows 10) , "Research"
Unusual Volume: Volume traded is more than double the 90 day moving average (All exchanges; ASI & ASem). For more detailed analysis,
- On InfoWARE Market Data Terminal <UV> <GO>
- On InfoWARE Finance Mobile App ( Android , iPhone & iPad and Windows 10)
| Symbol | Name | Volume | 90DAvgVol | %VolChg | Price | LClose | %Chg | Trades | Value |
|---|---|---|---|---|---|---|---|---|---|
| GTCO | GUARANTY TRUST HOLDING COMPANY PLC | 62.88M | 15.36M | 309.39 | 64.80 | 65.95 | -1.74 | 786 | 4.10B |
| MBENEFIT | MUTUAL BENEFITS ASSURANCE PLC. | 18.20M | 3.13M | 480.83 | 0.86 | 0.92 | -6.52 | 92 | 16.62M |
| HMCALL | HALDANE MCCALL PLC | 11.54M | 273.50K | 4,119.94 | 5.22 | 5.80 | -10.00 | 8 | 60.25M |
| NGXGROUP | NIGERIAN EXCHANGE GROUP | 8.04M | 1.12M | 618.82 | 35.65 | 32.45 | 9.86 | 132 | 261.86M |
| MTNN | MTN NIGERIA PLC | 5.17M | 2.00M | 157.72 | 245.00 | 245.00 | 0.00 | 374 | 1.18B |
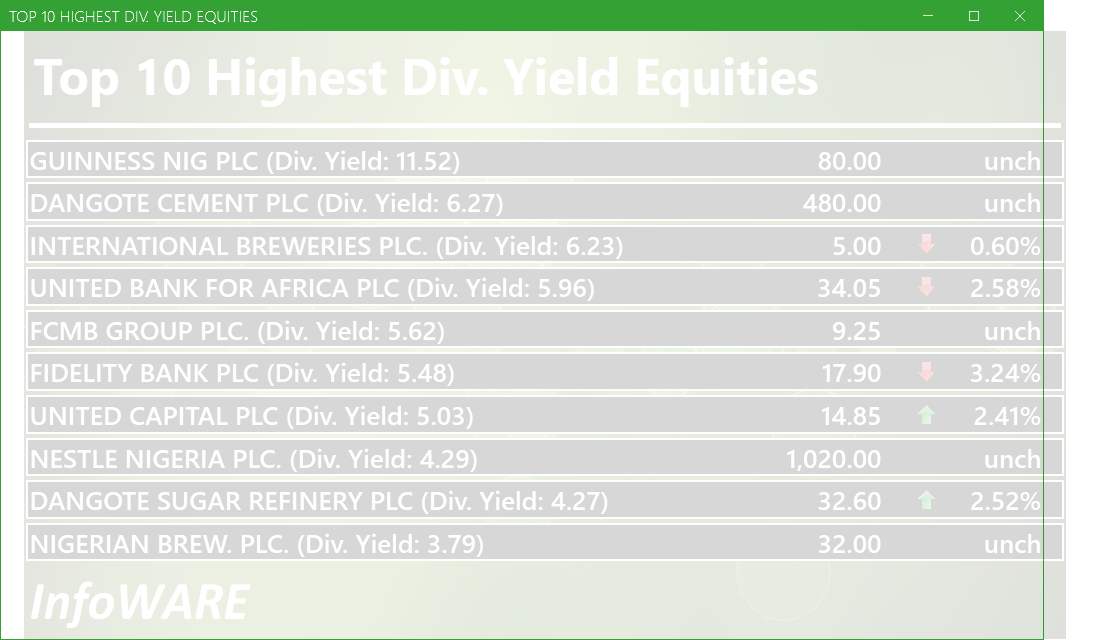
Investment Insights - High Div. Stocks
Dividend stocks distribute a portion of the company earnings to investors on a regular basis and they can a great choice for investors looking for regular income. As an investment or trading strategy, high dividend yield equities provide annual cash payments as against mostly capital gains in the price of a stock. The list in the table below represent the highest dividend paying stocks from the list of the most liquid stocks in the NSE top 30.
For more detailed analysis,
- On InfoWARE Market Data Terminal <HYIELD> <GO>
- On InfoWARE Finance Mobile App ( Android , iPhone & iPad and Windows 10) , "Research"
Investment Insights - Stocks outperforming the ASI but with approximately the same risk
These list of stocks represent equities that are less risky than the ASI but doing better than the ASI (All Shares Index) using the YTD (Year to Date) returns as the measure. The risk is measured by Beta. Beta is an assessment of a stock's tendency to undergo price changes, (its volatility), as well as its potential returns compared to the ASI. It is expressed as a ratio, where a score of 1 represents performance comparable to the ASI, and returns above or below the market may receive scores greater or lower than 1.
For a full list of both positively and negatively corelated stocks visit InfoWARE Market Data Terminal
- On InfoWARE Market Data Terminal <BANL> <GO>
- On InfoWARE Finance Mobile App ( Android , iPhone & iPad and Windows 10)
| Symbol | DivYield | PE | EPS | Beta | %ChgYTD | ASIYTDReturn | BetaDiff |
|---|---|---|---|---|---|---|---|
| HONYFLOUR | 1.40 | 16.28 | 0.31 | 0.99 | 46.68 | 0.98 | 0.01 |
| FIDELITYBK | 5.48 | 13.24 | 1.17 | 0.89 | 5.29 | 0.98 | 0.11 |
| HMCALL | 0.00 | 0.00 | 0.00 | -0.74 | 7.19 | 0.98 | 0.26 |
| VETGOODS | 0.00 | 0.71 | 14.24 | 0.98 | 0.29 | ||
| VETGRIF30 | 0.00 | 0.71 | 6.36 | 0.98 | 0.29 | ||
| ABBEYBDS | 1.43 | 0.00 | 0.00 | 0.70 | 86.00 | 0.98 | 0.30 |
| NEM | 6.52 | 24.99 | 0.37 | 0.69 | 7.50 | 0.98 | 0.31 |
| TANTALIZER | 1.50 | 0.00 | 0.00 | 0.69 | 3.11 | 0.98 | 0.31 |
| NAHCO | 6.66 | 92.98 | 0.41 | 0.65 | 31.15 | 0.98 | 0.35 |
| VETBANK | 0.00 | 0.57 | 14.68 | 0.98 | 0.43 |
African Markets
| Name | LClose | Change | %Chg |
|---|---|---|---|
| BRVM Stock Exchange | 288.73 | 0.98 | 0.34 |
| Botswana Stock Exchange | 10,103.52 | 0.00 | 0.00 |
| Egyptian Exchange | 31,699.58 | -326.67 | -1.02 |
| Ghana Stock Exchange | 6,097.08 | 30.94 | 0.51 |
| Lusaka Stock Exchange | 16,261.98 | -106.39 | -0.65 |
| Casablanca Stock Exchange | 17,232.49 | -25.89 | -0.15 |
| Malawi Stock Exchange | 292,054.60 | -233.83 | -0.08 |
| Nigeria Stock Exchange | 105,511.89 | -10.55 | -0.01 |
| Nairobi Securities Exchange | 131.51 | 0.26 | 0.20 |
| Rwanda Stock Exchange | 149.01 | 0.18 | 0.12 |
| Uganda Securities Exchange | 1,307.34 | 6.37 | 0.49 |
Nigeria Market Indexes
| Symbol | LClose | %Chg | WTD% | MTD% | QTD% | YTD% | MktCap | Trades |
|---|---|---|---|---|---|---|---|---|
| ASI | 104,187.00 | -0.18 | -0.03 | -1.29 | -1.29 | 0.98 | 10,701 | |
| NGX30 | 3,869.34 | -0.23 | -0.02 | -1.27 | -1.27 | 1.43 | 5,964 | |
| NGXAFRBVI | 2,534.14 | -0.84 | 1.13 | -4.84 | -4.84 | 2.15 | 3,247 | |
| NGXAFRHDYI | 15,944.03 | -0.41 | 0.55 | -4.21 | -4.21 | -6.36 | 3,046 | |
| NGXASEM | 1,588.92 | 0.00 | 0.00 | 0.06 | 0.06 | 0.33 | 1 | |
| NGXBNK | 1,101.53 | -1.60 | 0.25 | -5.11 | -5.11 | 1.30 | 3,341 | |
| NGXCG | 2,887.81 | -0.80 | 0.33 | -4.07 | -4.07 | 2.07 | 6,287 | |
| NGXCNSMRGDS | 1,777.96 | -0.23 | -0.39 | -2.07 | -2.07 | 2.51 | 858 | |
| NGXCOMMDTY | 1,002.53 | 0.00 | 0.00 | -0.10 | -0.10 | 0.25 | ||
| NGXGROWTH | 7,385.39 | 0.31 | 0.24 | -0.09 | -0.09 | -4.86 | 52 | |
| NGXINDUSTR | 3,476.52 | -0.04 | -0.16 | -0.38 | -0.38 | -2.66 | 431 | |
| NGXINS | 609.74 | 2.67 | -1.51 | -10.37 | -10.37 | -22.44 | 799 | |
| NGXLOTUSISLM | 7,463.67 | 0.23 | -0.66 | -1.20 | -1.20 | 7.12 | 1,241 | |
| NGXMAINBOARD | 4,997.07 | -0.17 | -0.27 | -1.27 | -1.27 | -0.14 | 7,601 | |
| NGXMERIGRW | 6,584.70 | -0.95 | -0.86 | -4.01 | -4.01 | 0.94 | 1,440 | |
| NGXMERIVAL | 10,042.42 | 0.28 | 1.51 | -2.44 | -2.44 | -3.72 | 3,530 | |
| NGXOILGAS | 2,426.20 | 0.47 | 0.51 | -0.83 | -0.83 | -10.51 | 199 | |
| NGXPENBRD | 1,864.75 | -0.28 | -0.11 | -1.27 | -1.27 | 1.81 | 8,692 | |
| NGXPENSION | 4,650.79 | -0.71 | -0.19 | -2.84 | -2.84 | 2.58 | 6,705 | |
| NGXPREMIUM | 10,038.92 | -0.21 | 0.42 | -1.25 | -1.25 | 3.14 | 3,048 | |
| NGXSOVBND | 627.52 | 0.00 | -0.02 | 0.11 | 0.11 | 4.32 | 0 |
For more detailed analysis,
- On InfoWARE Market Data Terminal <MKTINS> <GO>
- On InfoWARE Finance Mobile App ( Android, iPhone & iPad and Windows 10) , "Market Indexes"
Find the topic interesting? Will like to comment? Contact Us at solutions@infowarelimited.com
Top News

Chart Of The Day - ASI Chart Vs ASI Advance Decline Line (YTD) (14-Apr-2025 15:13:49.861)
InfoWARE AI Analyst Daily Market Report: 14-Apr-2025

[BERGER]>>Corporate Disclosures-<BERGER PAINTS NIGERIA PLC>
[NEIMETH]>>Notice of Meeting -<NEIMETH INTERNATIONAL PHARMACEUTICALS PLC>
[XNSA]>> CORDROS MILESTONE FUNDS' BID & OFFER PRICES
[MERROWTH]>> DAILY INDICATIVE PRICES
[AFRIPRUD]>>Notice of Meeting -<AFRICA PRUDENTIAL PLC>
[TANTALIZER]>>Notice of Meeting -<TANTALIZERS PLC>
[GEREGU]>>Corporate Disclosures-<GEREGU POWER PLC>
[XNSA]>> NGX FIXED INCOME INDICATIVE PRICE LIST FOR APR 14, 2025

Afrinvest Stock Recommendation | ACCESSCORP now a "BUY"... "ACCUMULATE" on FIDELITY
[XNSA]>> EMERGING AFRICA DAILY MUTUAL FUND PRICES
[XNSA]>> DAILY FUND PRICE SUBMISSION - FCMB ASSET MANAGEMENT LIMITED
[XNSA]>> WEMA BANK PLC: ACTIVATION OF CODE FOR TRADING IN RIGHTS
[AIRTELAFRI]>>Corporate Disclosures-<Airtel Africa Plc>
[XNSA]>> NOTIFICATION OF PRICE ADJUSTMENT
[STANBICETF30]>> DAILY INDICATIVE PRICES
InfoWARE AI Analyst Weekly Market Report: 11-Apr-2025
Chart Of The Day - ASI Chart Vs ASI Advance Decline Line (YTD) (11-Apr-2025 15:07:29.935)
InfoWARE AI Analyst Daily Market Report: 11-Apr-2025
[MERVALUE]>> DAILY INDICATIVE PRICES
[VETGOODS]>> DAILY INDICATIVE PRICES
[XNSA]>> NGX FIXED INCOME INDICATIVE PRICE LIST FOR APR 11, 2025
[XNSA]>> RESIGNATION OF A DIRECTOR (LIGHTHOUSE CAPITAL LIMITED)
[XNSA]>> DAILY FUND PRICE SUBMISSION - FCMB ASSET MANAGEMENT LIMITED
[NEWGOLD]>>Corporate Disclosures-<NEWGOLD EXCHANGE TRADED FUND (ETF)>
[SEPLAT]>>Notice of Meeting -<SEPLAT ENERGY PLC>
[SEPLAT]>>Corporate Disclosures-<SEPLAT ENERGY PLC>
Chart Of The Day - ASI Chart Vs ASI Advance Decline Line (YTD) (10-Apr-2025 15:14:52.738)
InfoWARE AI Analyst Daily Market Report: 10-Apr-2025
Get IDIA - the stock trading app for the modern investor
Solutions by Business
Product Suites
Company
Contacts
- 8th Floor,
- South Atlantic Petroleum Towers,
- 1 Adeola Odeku Street,
- Victoria Island,
- Lagos, Nigeria.
- Email: solutions@infowarelimited.com
Follow Us
 |
 |
 |
 |