


InfoWARE AI Analyst Daily Market Report: 11-Apr-2025 | InfoWARE Finance
Get IDIA - the stock trading app for the modern investor


InfoWARE AI Analyst Daily Market Report: 11-Apr-2025
(Source: InfoWARE Terminal, Date: 11-Apr-2025)
Dear Investor,
Welcome to today's market summary for the Nigerian Stock Exchange (NGX) on April 11, 2025. The NGX ASI (All Share Index) experienced a slight decline of -0.21%, closing at 104,788.25. Year-to-date, the index has returned 1.34%. Today's trading volume was 365.97 million, with a market turnover of 9.21 billion Naira, reflecting a 1.83% increase from the previous day. Market breadth was positive, with 39 advancers and 21 decliners, indicating a healthy interest in several stocks despite the overall index decline.
- Market Breadth: The market breadth was 1.86x, with 39 advancers and 21 decliners, suggesting a bullish sentiment among investors.
- Top Gainers:
- CAVERTON OFFSHORE SUPPORT GRP PLC (CAVERTON): Closed at 2.54, up 9.96%. RSI at 43.99 indicates potential for further gains.
- VFD GROUP PLC (VFDGROUP): Closed at 87.70, up 9.90%. RSI at 94.95 suggests it may be overbought.
- ABBEY BUILDING SOCIETY PLC (ABBEYBDS): Closed at 6.13, up 9.86%. Strong momentum with RSI at 99.26.
- Top Losers:
- DEAP CAPITAL MANAGEMENT & TRUST PLC (DEAPCAP): Closed at 0.93, down -9.71%. RSI at 61.81 indicates it may be stabilizing.
- ROYAL EXCHANGE PLC (ROYALEX): Closed at 0.80, down -9.09%. RSI at 49.15 suggests potential for recovery.
- STANBIC IBTC ETF 30 (STANBICETF30): Closed at 315, down -8.96%. RSI at 45.19 indicates a neutral stance.
Insights and Predictions
- Turnover Trends: The increase in market turnover by 1.83% suggests heightened trading activity, which could indicate investor confidence.
- Advancing vs. Declining Stocks: The ratio of advancing to declining stocks (1.86x) indicates a bullish sentiment, which may continue if the market maintains this momentum.
- Unusual Volume Movements: Stocks like VFDGROUP and MTNN showed significant volume spikes, indicating strong investor interest and potential price movements.
- YTD Trends: Notable overlaps in the YTD top gainers and losers suggest that while some stocks are performing well, others are under pressure, indicating a selective market environment.
Contrarian Signals
Stocks like CHAMPION show conflicting indicators with an RSI of 54.4 and a bullish MACD despite a -9.8% YTD performance, suggesting potential for a rebound.
Sector Heatmaps
| Sector | Performance | Institutional Activity | Retail Activity |
|---|---|---|---|
| Banking | -0.5% | High | Moderate |
| Insurance | +1.2% | Moderate | High |
| Telecommunications | -4.26% | High | Low |
Dividend-Beta Matrix
| Stock | Dividend Yield | Beta |
|---|---|---|
| AFRIPRUD | 1.27% | 0.64 |
| REGALINS | 4.35% | 0.47 |
Institutional Clustering Alerts
Stocks like ZENITHBANK with a 20.17% institutional trade value share indicate strong institutional interest, which could signal future price stability or growth.
High Dividend Yield Stocks
Stocks like REGALINS with a high dividend yield of 4.35% are also present in the bullish momentum table, suggesting they may provide both income and capital appreciation potential.
Suggestions for Traders
- Monitor stocks with bullish momentum closely, especially those crossing above their 15-day moving averages.
- Be cautious with stocks showing bearish momentum, particularly those with RSI below 30.
- Consider high dividend yield stocks as potential defensive plays in a volatile market.
Market Activity Summary
Retail investors accounted for 87.28% of trade counts but only 10.30% of trade value, indicating a focus on lower-value trades. In contrast, institutional investors, while only 12.72% of trade counts, represented 89.70% of trade value, suggesting a preference for larger transactions.
|
Top ASI Gainers Over Last 5 Trading Days
|
Top ASI Losers Over Last 5 Trading Days
|
For more detailed analysis, on InfoWARE Market Data Terminal <NSEPERF> <GO>
On InfoWARE Finance Mobile App (Android, iPhone & iPad, Windows Phone and Windows 8/10), "Top Gainers & Losers"
CAVERTON OFFSHORE SUPPORT GRP PLC (CAVERTON) topped the advancers list closing at N2.54 with a gain of 9.96% followed by VFD GROUP PLC (VFDGROUP) which closed at N87.70 with a gain of 9.90%.
On the flip side DEAP CAPITAL MANAGEMENT & TRUST PLC (DEAPCAP) and ROYAL EXCHANGE PLC. (ROYALEX) topped the decliners log with a loss of -9.71% at a close of N0.93, and -9.09% to close the day at N0.80 respectively.
| Symbol | LClose | %Chg |
|---|---|---|
| CAVERTON | 2.54 | 9.96 |
| VFDGROUP | 87.70 | 9.90 |
| ABBEYBDS | 6.13 | 9.86 |
| FTNCOCOA | 1.90 | 9.83 |
| REGALINS | 0.58 | 9.43 |
| Symbol | LClose | %Chg |
|---|---|---|
| DEAPCAP | 0.93 | -9.71 |
| ROYALEX | 0.80 | -9.09 |
| STANBICETF30 | 315.00 | -8.96 |
| SOVRENINS | 0.85 | -7.61 |
| GUINEAINS | 0.63 | -7.35 |
For more detailed analysis,
- On InfoWARE Market Data Terminal <TOPG> <GO>
- On InfoWARE Finance Mobile App ( Android, iPhone & iPad and Windows 10) , "Top Gainers & Losers"
Currency Market
In the currency market, the Naira fell 0.67%(-10.52) against the Dollar to settle at 1 to 1Investment Insights - Top 5 Gainers YTD
These stocks are the best performers whose price has risen faster than the market as a whole with the best returns year to date. Momentum investors believe that stocks that have outperformed the market will often continue to do so because the factors that caused them to outperform will not suddenly disappear. In addition, other investors seeking to benefit from the stock’s outperformance will often purchase the stock, further bidding its price higher and pushing the stock higher still
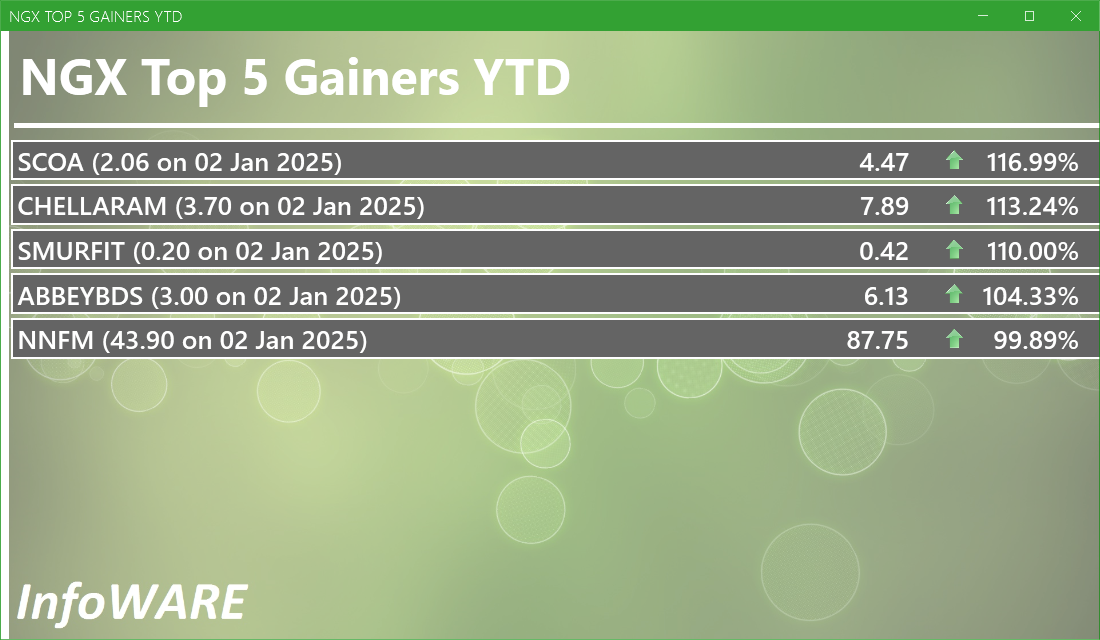
For more detailed analysis,
- On InfoWARE Market Data Terminal <T5YTD2> <GO>
- On InfoWARE Finance Mobile App ( Android , iPhone & iPad and Windows 10) , "Research"
NSE: Bull Signal - Price crossed above 15 Day MA
This signal implies these stocks are under buying pressure and the price might continue to rise and therefore positions should be monitored closely. Further suggested analysis include looking at the overall market (ASI) to see if the uptrend is market wide, sector wide or specific to the stock. Portfolio managers tend to use this as a signal to do more research to add to their positions or lock in some profits. Typically further analysis should be done using commands like PC and RV on the InfoWARE Market Data Terminal. Another command is ALERTS to set price triggers for possible exit or entry as necessary
For more detailed analysis,
- On InfoWARE Market Data Terminal <NSEPERF> <GO>
- On InfoWARE Finance Mobile App ( Android , iPhone & iPad and Windows 10) , "Top Gainers & Losers"
| Symbol | Price | %Chg | 15DMA | PE | EPS | DivY | MktCap | Vol | Trades | Value | LstTradeTime |
|---|---|---|---|---|---|---|---|---|---|---|---|
| CAVERTON | 2.54 | 9.06 | 2.44 | 1.15 | 1.57 | 5.52 | 8.51B | 1.32M | 63.00 | 3.34M | 11-Apr-2025 14:30:49.920 |
| JAPAULGOLD | 2.01 | 8.46 | 1.91 | 0.19 | 12.01 | 0.90 | 12.59B | 6.59M | 108.00 | 13.01M | 11-Apr-2025 14:30:53.297 |
| AIICO | 1.55 | 7.74 | 1.51 | 2.01 | 0.60 | 4.13 | 56.74B | 12.11M | 107.00 | 18.10M | 11-Apr-2025 14:31:55.910 |
| CHAMS | 2.15 | 6.98 | 2.05 | 27.02 | 0.07 | 1.56 | 10.10B | 1.23M | 50.00 | 2.60M | 11-Apr-2025 14:30:50.000 |
| WAPIC | 2.20 | 6.82 | 2.15 | 72.55 | 0.02 | 2.56 | 52.78B | 4.28M | 56.00 | 9.38M | 11-Apr-2025 14:30:58.833 |
| PRESTIGE | 1.01 | 5.94 | 0.98 | 10.49 | 0.08 | 2.50 | 13.39B | 569.17K | 20.00 | 568.45K | 11-Apr-2025 14:30:56.620 |
| FGSUK2033S6 | 102.96 | 5.79 | 99.26 | 0.00 | 0.00 | 4.60K | 4.00 | 4.74M | 11-Apr-2025 14:31:22.120 | ||
| UPDCREIT | 5.90 | 5.08 | 5.89 | 9.09 | 0.57 | 10.87 | 15.74B | 557.39K | 34.00 | 3.32M | 11-Apr-2025 14:31:33.810 |
| FGS202760 | 100.00 | 5.00 | 95.33 | 0.00 | 0.00 | 15.00K | 1.00 | 15.00M | 11-Apr-2025 14:31:21.190 | ||
| ELLAHLAKES | 3.14 | 4.46 | 3.03 | 0.00 | 0.00 | 0.00 | 6.28B | 5.34M | 57.00 | 16.27M | 11-Apr-2025 14:30:51.270 |
| LIVESTOCK | 8.54 | 4.45 | 8.33 | 0.00 | 0.00 | 2.94 | 25.62B | 3.75M | 152.00 | 31.53M | 11-Apr-2025 14:30:53.710 |
| VETBANK | 12.69 | 1.50 | 12.65 | 0.00 | 0.00 | 4.52K | 4.00 | 57.00K | 11-Apr-2025 14:31:57.747 | ||
| CHAMPION | 3.89 | 1.03 | 3.88 | 412.83 | 0.01 | 0.41 | 30.46B | 1.66M | 23.00 | 6.31M | 11-Apr-2025 14:30:49.967 |
| NGXAFRHDYI | 16,514.43 | 0.99 | 16,412.03 | 7.46 | 39.30 | 0.00 | 0.00 | 109.32M | 2,388.00 | 4.14B | 11-Apr-2025 14:31:23.870 |
| NGXBNK | 1,136.91 | 0.54 | 1,134.64 | 6.10 | 34.65 | 0.00 | 0.00 | 155.42M | 2,919.00 | 4.26B | 11-Apr-2025 14:31:24.017 |
NSE: BEAR Signal - Price crossed below 15 Day MA
This signal implies these stocks are under selling pressure and the price might continue to slide and therefore positions should be monitored closely. Further suggested analysis include looking at the overall market (ASI) to see if the downtrend is market wide, sector wide or specific to the stock. If the overal market trend is upwards, then since these stocks are heading in the opposite direction, then further analysis should be done using commands like PC and RV on the InfoWARE Market Data Terminal. Another command is ALERTS to set price triggers for possible exit is necessar
For more detailed analysis,
- On InfoWARE Market Data Terminal <BEARM> <GO>
- On InfoWARE Finance Mobile App ( Android , iPhone & iPad and Windows 10)
| Symbol | Price | %Chg | 15DMA | PE | EPS | DivY | MktCap | Vol | Trades | Value | LstTradeTime |
|---|---|---|---|---|---|---|---|---|---|---|---|
| FCMB | 9.35 | -0.53 | 9.38 | 104.31 | 0.09 | 5.62 | 185.16B | 2.25M | 158.00 | 20.79M | 11-Apr-2025 14:31:56.123 |
| MTNN | 235.00 | -4.26 | 243.89 | 16,715.80 | 0.01 | 3.29 | 4,783.31B | 5.99M | 293.00 | 1.38B | 11-Apr-2025 14:31:58.293 |
| UPDC | 2.85 | -4.91 | 2.91 | 0.00 | 0.00 | 34.25 | 52.90B | 1.42M | 59.00 | 4.37M | 11-Apr-2025 14:30:58.553 |
| DEAPCAP | 0.93 | -10.75 | 0.95 | 188.84 | 0.01 | 13.76 | 1.40B | 2.39M | 26.00 | 2.29M | 11-Apr-2025 14:30:51.080 |
Economic Indicators - Nigeria FX Reserves Vs ASI Chart
Nigeria FX Reserves are assets held on reserve by CBN in foreign currencies. These reserves are used to back liabilities and influence monetary policy. Given the nature of the Nigeria economy, FX Reserves can appear to have an outsize influence on the economy and hence on the capital market. The chart below allows comparison of FX Reserves against the ASI to make investment decisions
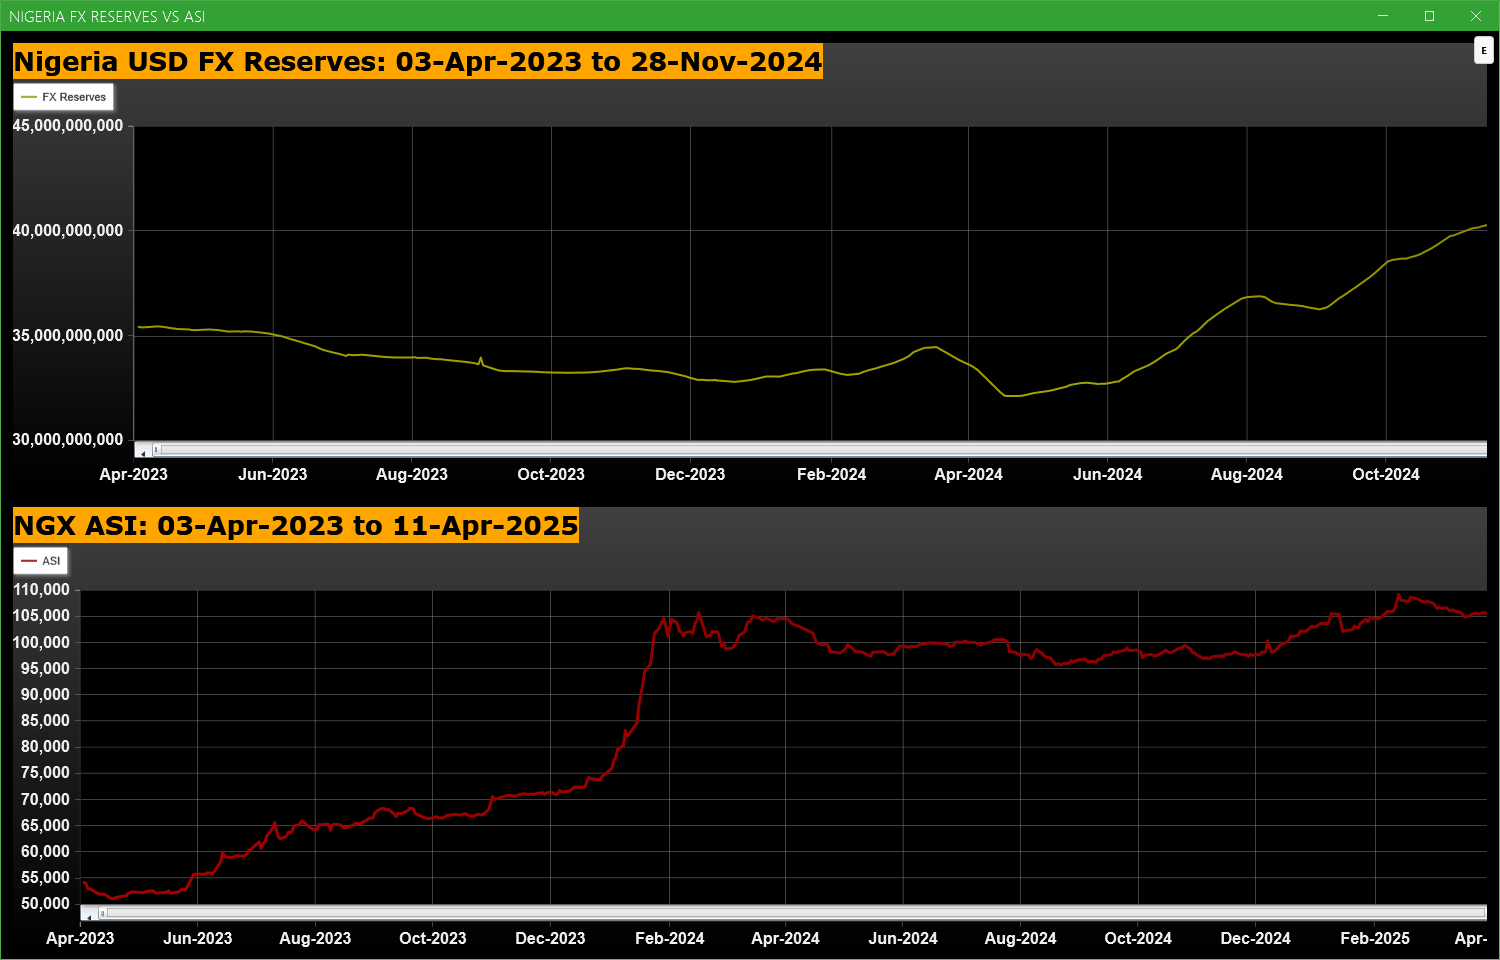
For more detailed analysis,
- On InfoWARE Market Data Terminal <CI> <GO>
- On InfoWARE Finance Mobile App ( Android , iPhone & iPad and Windows 10) , "Research"
Market Trend - ASI (NGX All-Share-Index) With 50 & 200 Day MAvgs Chart
Technical traders typically use the 50 & 200 day moving averages to aid in choosing
where to enter or exit a position, which then causes these levels to act as strong
support or resistance. As a general guideline, if the price is above a moving average,
the trend is up. If the price is below a moving average, the trend is down.
It is important to note that critics of technical analysis say that moving averages act
as support and resistance because so many traders use these indicators to inform their
trading decisions. Also moving averages tend to work quite well in strong trending conditions
but poorly in choppy or ranging conditions.
Trading Strategies: Crossovers
Crossovers are one of the main moving average strategies. The first type is a price crossover,
which is when the price crosses above or below a moving average to signal a potential change
in trend. Another strategy is to apply two moving averages to a chart: one longer and one
shorter. When the shorter-term MA crosses above the longer-term MA, it is a buy signal, as
it indicates that the trend is shifting up. This is known as a golden cross. Meanwhile, when
the shorter-term MA crosses below the longer-term MA, it is a sell signal, as it indicates that
the trend is shifting down. This is known as a dead/death cross
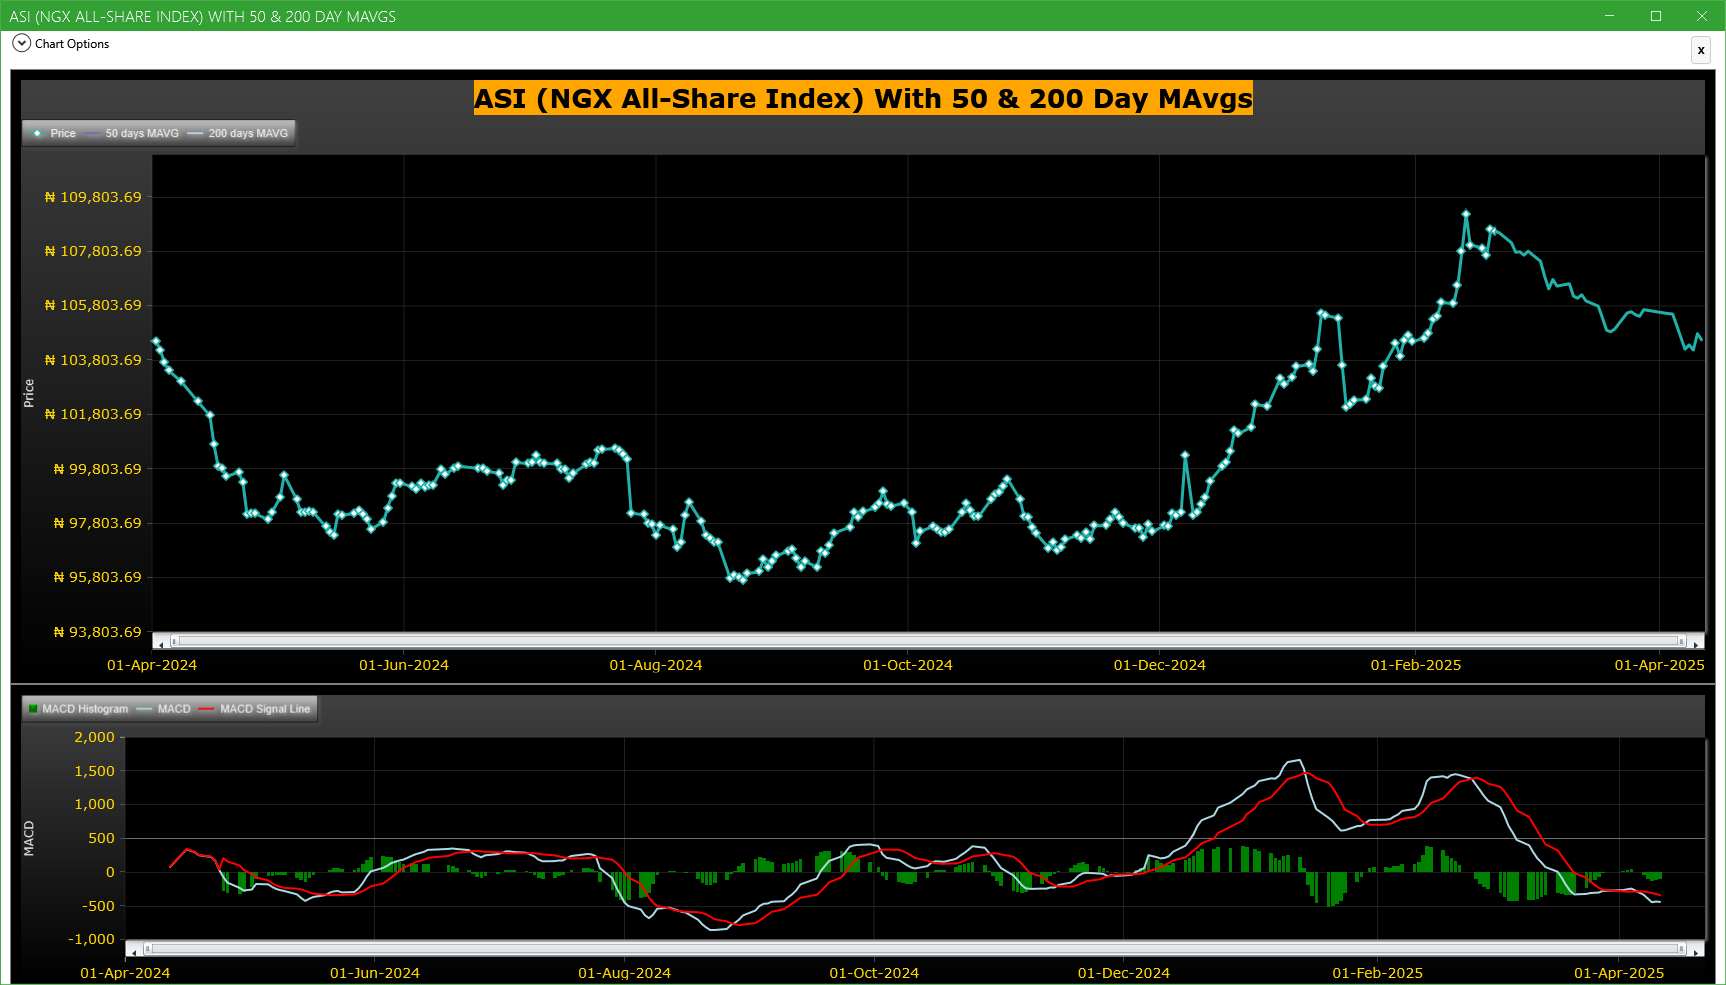
For more detailed analysis,
- On InfoWARE Market Data Terminal <CI> <GO>
- On InfoWARE Finance Mobile App ( Android , iPhone & iPad and Windows 10) , "Research"
Unusual Volume: Volume traded is more than double the 90 day moving average (All exchanges; ASI & ASem). For more detailed analysis,
- On InfoWARE Market Data Terminal <UV> <GO>
- On InfoWARE Finance Mobile App ( Android , iPhone & iPad and Windows 10)
| Symbol | Name | Volume | 90DAvgVol | %VolChg | Price | LClose | %Chg | Trades | Value |
|---|---|---|---|---|---|---|---|---|---|
| CUTIX | CUTIX PLC. | 29.66M | 11.63M | 155.11 | 2.32 | 2.30 | 0.87 | 118 | 63.01M |
| MTNN | MTN NIGERIA PLC | 5.99M | 2.08M | 188.38 | 235.00 | 245.00 | -4.08 | 293 | 1.38B |
| FTNCOCOA | FTN COCOA PROCESSORS PLC | 4.86M | 2.07M | 134.92 | 1.90 | 1.73 | 9.83 | 85 | 8.87M |
| VFDGROUP | VFD GROUP PLC | 3.76M | 399.77K | 840.20 | 87.70 | 79.80 | 9.90 | 288 | 328.15M |
| NGXGROUP | NIGERIAN EXCHANGE GROUP | 3.33M | 1.32M | 153.12 | 34.45 | 34.50 | -0.14 | 50 | 111.32M |
Investment Insights - High Div. Stocks
Dividend stocks distribute a portion of the company earnings to investors on a regular basis and they can a great choice for investors looking for regular income. As an investment or trading strategy, high dividend yield equities provide annual cash payments as against mostly capital gains in the price of a stock. The list in the table below represent the highest dividend paying stocks from the list of the most liquid stocks in the NSE top 30.
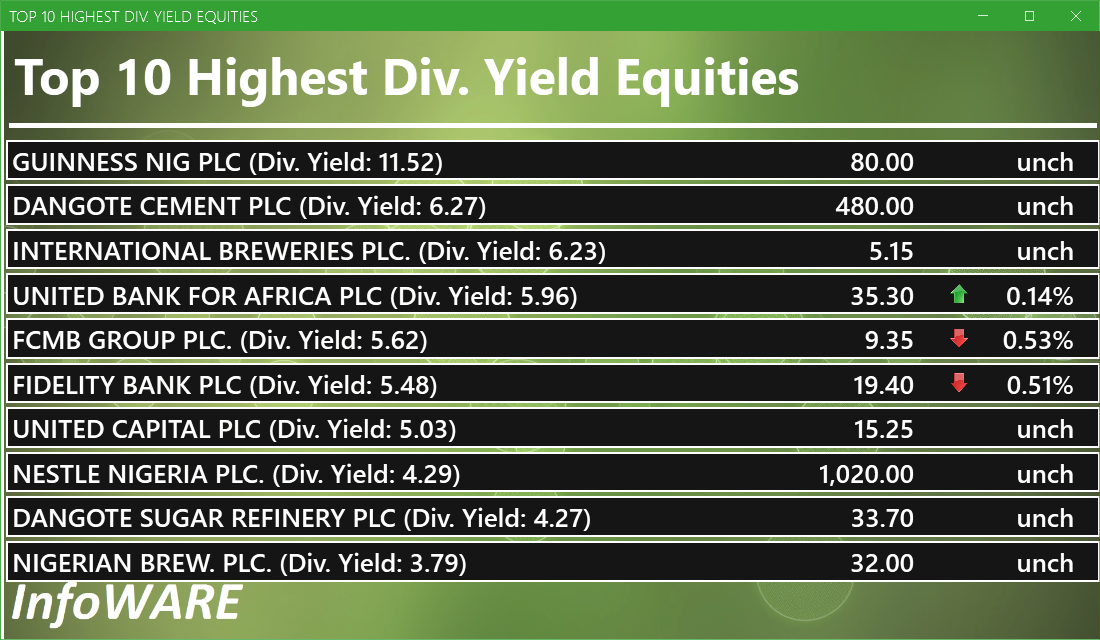
For more detailed analysis,
- On InfoWARE Market Data Terminal <HYIELD> <GO>
- On InfoWARE Finance Mobile App ( Android , iPhone & iPad and Windows 10) , "Research"
Investment Insights - Stocks outperforming the ASI but with approximately the same risk
These list of stocks represent equities that are less risky than the ASI but doing better than the ASI (All Shares Index) using the YTD (Year to Date) returns as the measure. The risk is measured by Beta. Beta is an assessment of a stock's tendency to undergo price changes, (its volatility), as well as its potential returns compared to the ASI. It is expressed as a ratio, where a score of 1 represents performance comparable to the ASI, and returns above or below the market may receive scores greater or lower than 1.
For a full list of both positively and negatively corelated stocks visit InfoWARE Market Data Terminal
- On InfoWARE Market Data Terminal <BANL> <GO>
- On InfoWARE Finance Mobile App ( Android , iPhone & iPad and Windows 10)
| Symbol | DivYield | PE | EPS | Beta | %ChgYTD | ASIYTDReturn | BetaDiff |
|---|---|---|---|---|---|---|---|
| HONYFLOUR | 1.40 | 16.28 | 0.31 | 0.99 | 60.40 | 1.34 | 0.01 |
| FIDELITYBK | 5.48 | 13.24 | 1.17 | 0.89 | 14.12 | 1.34 | 0.11 |
| HMCALL | 0.00 | 0.00 | 0.00 | -0.74 | 7.19 | 1.34 | 0.26 |
| VETGOODS | 0.00 | 0.71 | 14.83 | 1.34 | 0.29 | ||
| VETGRIF30 | 0.00 | 0.71 | 6.49 | 1.34 | 0.29 | ||
| ABBEYBDS | 1.43 | 0.00 | 0.00 | 0.70 | 104.33 | 1.34 | 0.30 |
| NEM | 6.52 | 24.99 | 0.37 | 0.69 | 7.50 | 1.34 | 0.31 |
| TANTALIZER | 1.50 | 0.00 | 0.00 | 0.69 | 14.22 | 1.34 | 0.31 |
| NAHCO | 6.66 | 92.98 | 0.41 | 0.65 | 36.46 | 1.34 | 0.35 |
| VETBANK | 0.00 | 0.57 | 16.42 | 1.34 | 0.43 |
African Markets
| Name | LClose | Change | %Chg |
|---|---|---|---|
| BRVM Stock Exchange | 287.76 | -0.17 | -0.06 |
| Botswana Stock Exchange | 10,113.04 | 2.02 | 0.02 |
| Egyptian Exchange | 30,648.98 | 194.91 | 0.64 |
| Ghana Stock Exchange | 6,101.34 | 1.22 | 0.02 |
| Lusaka Stock Exchange | 16,398.46 | 47.42 | 0.29 |
| Casablanca Stock Exchange | 16,479.06 | 219.50 | 1.35 |
| Malawi Stock Exchange | 295,507.99 | 3,677.07 | 1.26 |
| Nigeria Stock Exchange | 104,376.73 | 156.33 | 0.15 |
| Nairobi Securities Exchange | 126.88 | -2.25 | -1.74 |
| Rwanda Stock Exchange | 149.01 | 0.00 | 0.00 |
| Uganda Securities Exchange | 1,315.17 | 7.45 | 0.57 |
Nigeria Market Indexes
| Symbol | LClose | %Chg | WTD% | MTD% | QTD% | YTD% | MktCap | Trades |
|---|---|---|---|---|---|---|---|---|
| ASI | 104,563.34 | -0.21 | 0.33 | -0.93 | -0.93 | 1.34 | 9,755 | |
| NGX30 | 3,880.15 | -0.27 | 0.26 | -1.00 | -1.00 | 1.71 | 5,194 | |
| NGXAFRBVI | 2,617.85 | 0.92 | 4.47 | -1.70 | -1.70 | 5.52 | 2,827 | |
| NGXAFRHDYI | 16,514.43 | 1.00 | 4.15 | -0.78 | -0.78 | -3.01 | 2,388 | |
| NGXASEM | 1,588.92 | 0.00 | 0.00 | 0.06 | 0.06 | 0.33 | 6 | |
| NGXBNK | 1,136.91 | 0.55 | 3.47 | -2.06 | -2.06 | 4.55 | 2,919 | |
| NGXCG | 2,943.74 | -0.04 | 2.27 | -2.22 | -2.22 | 4.05 | 5,437 | |
| NGXCNSMRGDS | 1,788.39 | 0.00 | 0.19 | -1.50 | -1.50 | 3.12 | 768 | |
| NGXCOMMDTY | 1,002.53 | 0.00 | 0.00 | -0.10 | -0.10 | 0.25 | ||
| NGXGROWTH | 7,414.09 | 0.00 | 0.63 | 0.30 | 0.30 | -4.49 | 57 | |
| NGXINDUSTR | 3,473.27 | -0.06 | -0.25 | -0.48 | -0.48 | -2.75 | 471 | |
| NGXINS | 639.11 | 2.07 | 3.24 | -6.05 | -6.05 | -18.71 | 1,439 | |
| NGXLOTUSISLM | 7,426.81 | -0.78 | -1.15 | -1.69 | -1.69 | 6.59 | 990 | |
| NGXMAINBOARD | 5,034.01 | 0.14 | 0.46 | -0.54 | -0.54 | 0.60 | 6,948 | |
| NGXMERIGRW | 6,781.50 | -0.01 | 2.11 | -1.14 | -1.14 | 3.96 | 1,017 | |
| NGXMERIVAL | 10,146.98 | 0.08 | 2.57 | -1.42 | -1.42 | -2.72 | 3,220 | |
| NGXOILGAS | 2,417.66 | -0.43 | 0.16 | -1.18 | -1.18 | -10.83 | 145 | |
| NGXPENBRD | 1,870.60 | -0.22 | 0.20 | -0.96 | -0.96 | 2.13 | 8,179 | |
| NGXPENSION | 4,726.49 | 0.10 | 1.43 | -1.25 | -1.25 | 4.25 | 5,755 | |
| NGXPREMIUM | 10,005.30 | -0.87 | 0.09 | -1.58 | -1.58 | 2.80 | 2,750 | |
| NGXSOVBND | 649.10 | -0.04 | 3.42 | 3.55 | 3.55 | 7.91 | 0 |
For more detailed analysis,
- On InfoWARE Market Data Terminal <MKTINS> <GO>
- On InfoWARE Finance Mobile App ( Android, iPhone & iPad and Windows 10) , "Market Indexes"
Find the topic interesting? Will like to comment? Contact Us at solutions@infowarelimited.com
Top News

Chart Of The Day - ASI Chart Vs ASI Advance Decline Line (YTD) (14-Apr-2025 15:13:49.861)
InfoWARE AI Analyst Daily Market Report: 14-Apr-2025

[BERGER]>>Corporate Disclosures-<BERGER PAINTS NIGERIA PLC>
[NEIMETH]>>Notice of Meeting -<NEIMETH INTERNATIONAL PHARMACEUTICALS PLC>
[XNSA]>> CORDROS MILESTONE FUNDS' BID & OFFER PRICES
[MERROWTH]>> DAILY INDICATIVE PRICES
[AFRIPRUD]>>Notice of Meeting -<AFRICA PRUDENTIAL PLC>
[TANTALIZER]>>Notice of Meeting -<TANTALIZERS PLC>
[GEREGU]>>Corporate Disclosures-<GEREGU POWER PLC>
[XNSA]>> NGX FIXED INCOME INDICATIVE PRICE LIST FOR APR 14, 2025

Afrinvest Stock Recommendation | ACCESSCORP now a "BUY"... "ACCUMULATE" on FIDELITY
[XNSA]>> EMERGING AFRICA DAILY MUTUAL FUND PRICES
[XNSA]>> DAILY FUND PRICE SUBMISSION - FCMB ASSET MANAGEMENT LIMITED
[XNSA]>> WEMA BANK PLC: ACTIVATION OF CODE FOR TRADING IN RIGHTS
[AIRTELAFRI]>>Corporate Disclosures-<Airtel Africa Plc>
[XNSA]>> NOTIFICATION OF PRICE ADJUSTMENT
[STANBICETF30]>> DAILY INDICATIVE PRICES
InfoWARE AI Analyst Weekly Market Report: 11-Apr-2025
Chart Of The Day - ASI Chart Vs ASI Advance Decline Line (YTD) (11-Apr-2025 15:07:29.935)
InfoWARE AI Analyst Daily Market Report: 11-Apr-2025
[MERVALUE]>> DAILY INDICATIVE PRICES
[VETGOODS]>> DAILY INDICATIVE PRICES
[XNSA]>> NGX FIXED INCOME INDICATIVE PRICE LIST FOR APR 11, 2025
[XNSA]>> RESIGNATION OF A DIRECTOR (LIGHTHOUSE CAPITAL LIMITED)
[XNSA]>> DAILY FUND PRICE SUBMISSION - FCMB ASSET MANAGEMENT LIMITED
[NEWGOLD]>>Corporate Disclosures-<NEWGOLD EXCHANGE TRADED FUND (ETF)>
[SEPLAT]>>Notice of Meeting -<SEPLAT ENERGY PLC>
[SEPLAT]>>Corporate Disclosures-<SEPLAT ENERGY PLC>
Chart Of The Day - ASI Chart Vs ASI Advance Decline Line (YTD) (10-Apr-2025 15:14:52.738)
InfoWARE AI Analyst Daily Market Report: 10-Apr-2025
Get IDIA - the stock trading app for the modern investor
Solutions by Business
Product Suites
Company
Contacts
- 8th Floor,
- South Atlantic Petroleum Towers,
- 1 Adeola Odeku Street,
- Victoria Island,
- Lagos, Nigeria.
- Email: solutions@infowarelimited.com
Follow Us
 |
 |
 |
 |