


Chart Of The Day - ASI Chart Vs ASI Advance Decline Line (YTD) (20-May-2025 15:07:17.384) | InfoWARE Finance
Get IDIA - the stock trading app for the modern investor


Chart Of The Day - ASI Chart Vs ASI Advance Decline Line (YTD) (20-May-2025 15:07:17.384)
(Source: InfoWARE Terminal, Date: 20-May-2025)
Dear Investor,
Chart Of The Day - ASI Chart Vs ASI Advance Decline Line (YTD) - 20-May-2025 15:07:17.384
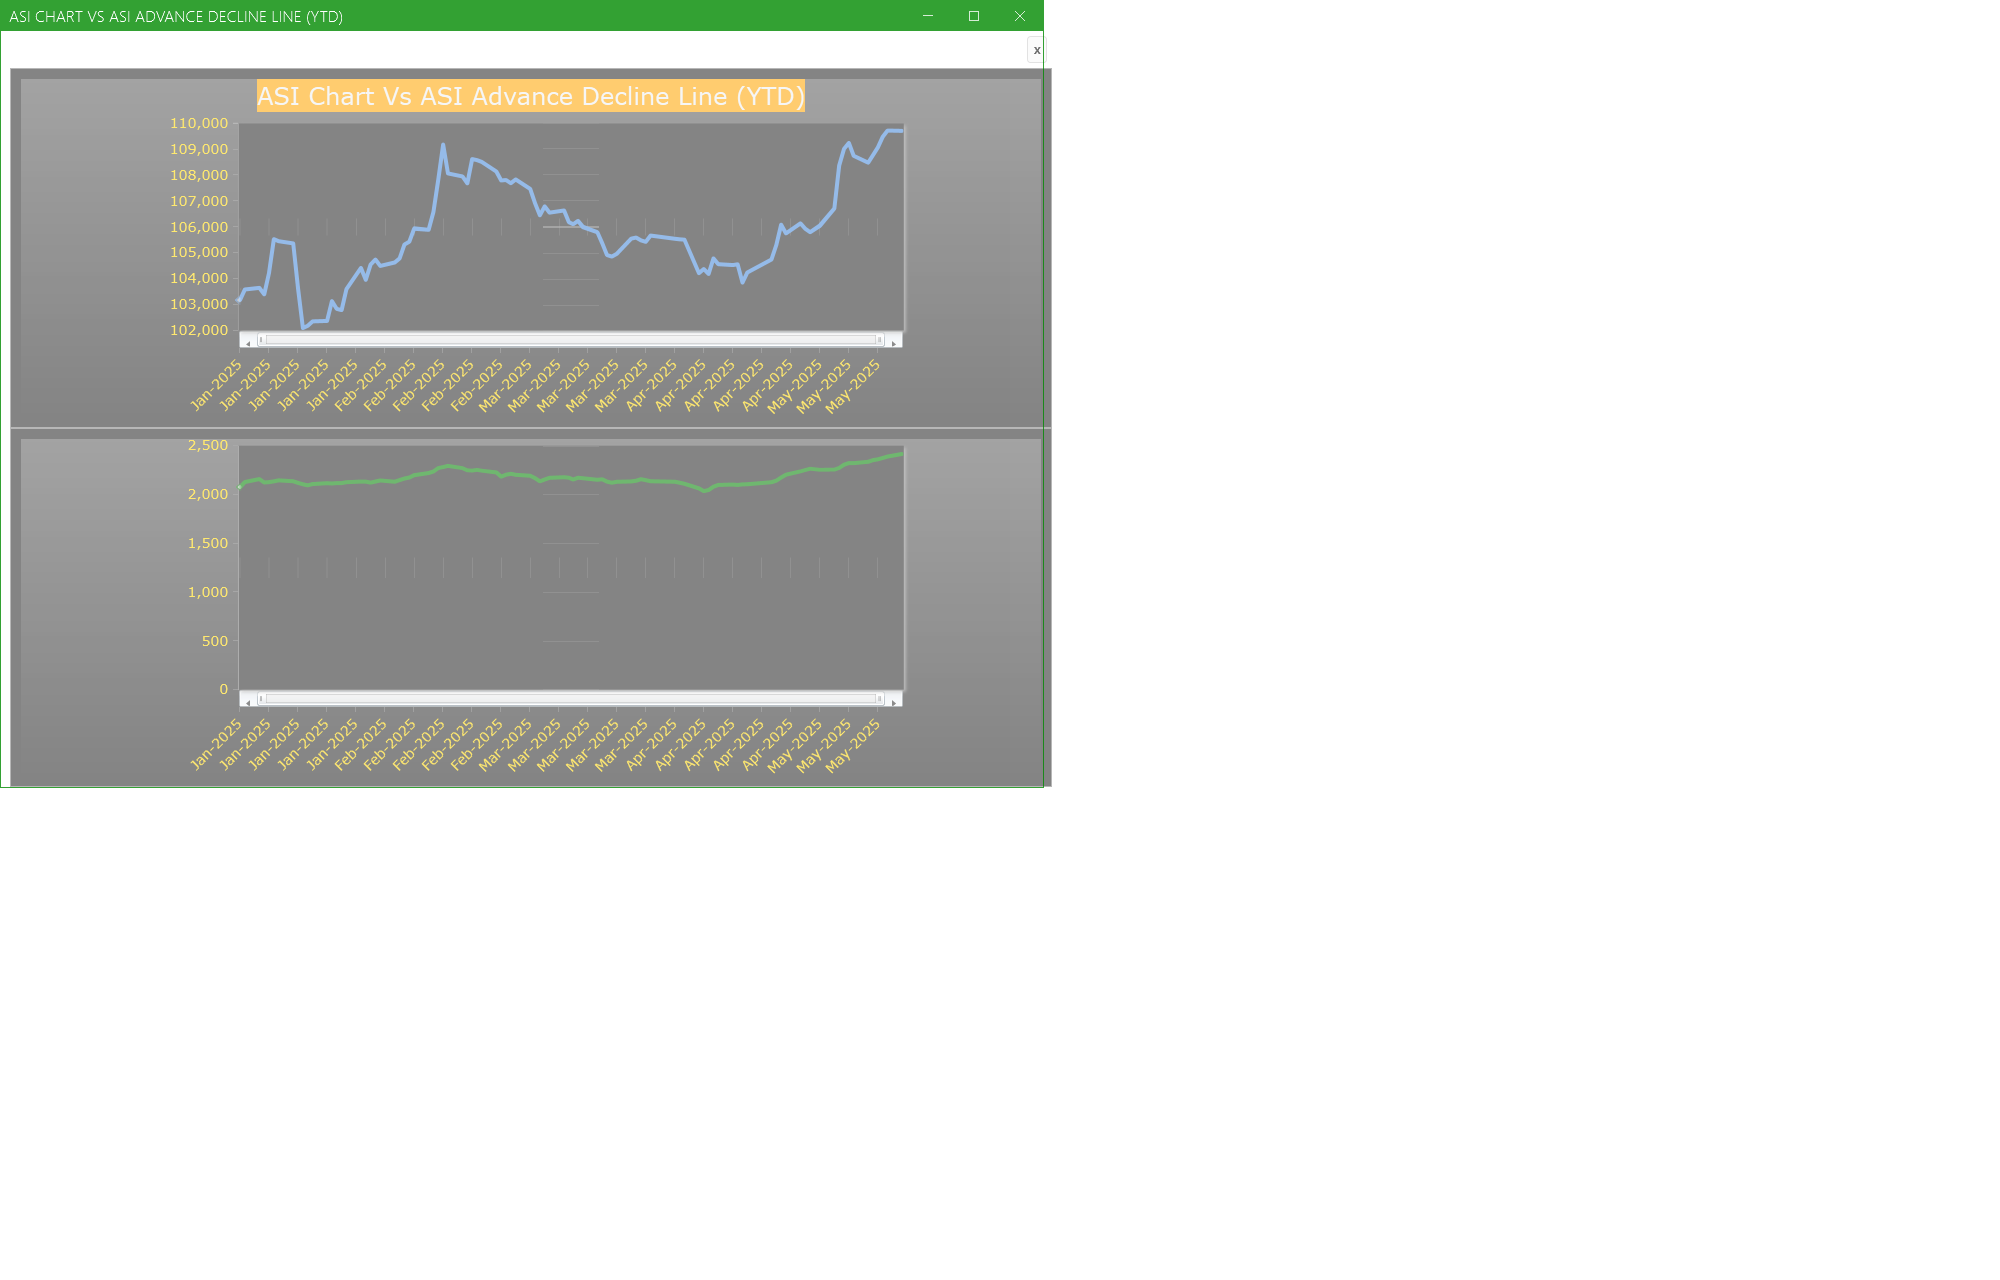
Chart of the day: ASI Chart Vs ASI Advance Decline Line (YTD) - Market breath
The A/D line is used to show market sentiment, as it tells traders whether there are more stocks rising or falling. It is used to confirm price trends in major indexes, and can also warn of reversals when divergence occurs.
Key Takeaways
- The advance/decline line (A/D) is a breadth indicator used to show how many stocks are participating in a stock market rally or decline.
- When major indexes are rallying, a rising A/D line confirms the uptrend showing strong participation.
- If major indexes are rallying and the A/D line is falling, it shows that fewer stocks are participating in the rally which means the index could be nearing the end of its rally.
- When major indexes are declining, a falling advance/decline line confirms the downtrend.
- If major indexes are declining and the A/D line is rising, fewer stocks are declining over time, which means the index may be near the end of its decline.
(Definition Source: Investopedia.com)
For more detailed analysis,
- On InfoWARE Finance Mobile App ( Android, iPhone & iPad and Windows 10) , "Research"
Find the topic interesting? Will like to comment? Contact Us at solutions@infowarelimited.com
Top News

Chart Of The Day - ASI Chart Vs ASI Advance Decline Line (YTD) (20-May-2025 15:07:17.384)
InfoWARE Analyst Daily Market Report (20-May-2025 15:07:13.094)

[MERVALUE]>> DAILY INDICATIVE PRICES
[XNSA]>> EMERGING AFRICA DAILY MUTUAL FUND PRICES
[VSPBONDETF]>> DAILY INDICATIVE PRICES
[XNSA]>> NGX FIXED INCOME INDICATIVE PRICE LIST FOR MAY 20, 2025
[XNSA]>> DAILY FUND PRICE SUBMISSION - FCMB ASSET MANAGEMENT LIMITED
[XNSA]>> CORDROS MILESTONE FUNDS' BID & OFFER PRICES
[XNSA]>> APPOINTMENT OF DIRECTORS (REWARD INVESTMENTS AND SERVICES LIMITED)
[XNSA]>> WEMA BANK PLC: ACTIVATION OF CODE FOR TRADING IN RIGHTS
[XNSA]>> VIRTUAL MEETING OF CHIEF EXECUTIVE OFFICERS OF TRADING LICENSE HOLDERS
[ETI]>>Corporate Disclosures-<ECOBANK TRANSNATIONAL INCORPORATED>
[FIDELITYBK]>>Corporate Disclosures-<FIDELITY BANK PLC>
Chart Of The Day - ASI Chart Vs ASI Advance Decline Line (YTD) (19-May-2025 15:10:18.752)
InfoWARE Analyst Daily Market Report (19-May-2025 15:10:14.387)
[MERVALUE]>> DAILY INDICATIVE PRICES
[XNSA]>> DAILY FUND PRICE SUBMISSION - FCMB ASSET MANAGEMENT LIMITED
[XNSA]>> EMERGING AFRICA DAILY MUTUAL FUND PRICES
[XNSA]>> NGX FIXED INCOME INDICATIVE PRICE LIST FOR MAY 19, 2025
[VSPBONDETF]>> DAILY INDICATIVE PRICES
[NEWGOLD]>> DAILY INDICATIVE PRICES
[XNSA]>> WEMA BANK PLC: ACTIVATION OF CODE FOR TRADING IN RIGHTS
[XNSA]>> VIRTUAL MEETING OF CHIEF EXECUTIVE OFFICERS OF TRADING LICENSE HOLDERS

Corporate Actions | OKOMUOIL, WEMABANK and NEM Payment is This Week!

Media Highlights 19-05-2025

Daily Business News Brief
[SIAMLETF40]>> DAILY INDICATIVE PRICES
[XNSA]>> CORDROS MILESTONE FUNDS' BID & OFFER PRICES
[AIRTELAFRI]>>Corporate Disclosures-<Airtel Africa Plc>
Chart Of The Day - ASI Chart Vs ASI Advance Decline Line (YTD) (16-May-2025 15:10:39.464)
Get IDIA - the stock trading app for the modern investor
Solutions by Business
Product Suites
Company
Contacts
- 8th Floor,
- South Atlantic Petroleum Towers,
- 1 Adeola Odeku Street,
- Victoria Island,
- Lagos, Nigeria.
- Email: solutions@infowarelimited.com
Follow Us
 |
 |
 |
 |