


InfoWARE AI Analyst Daily Market Report: 16-Apr-2025 | InfoWARE Finance
Get IDIA - the stock trading app for the modern investor


InfoWARE AI Analyst Daily Market Report: 16-Apr-2025
(Source: InfoWARE Terminal, Date: 16-Apr-2025)
Dear Investor,
NGX Daily Market Summary (Wednesday, April 16, 2025)
The Nigerian equities market experienced a moderate pullback today as the NGX All Share Index (ASI) retreated by -0.68% to close at 104,560.02. The YTD return slid to 0.65%, reflecting a market wrestling for clear direction. Despite the dip in the ASI, market turnover defied expectations – surging 25.42% to reach ₦12.86 billion versus the prior day's ₦10.25B. Market breadth was slightly positive (1.17x), powered by 27 advancers against 23 decliners. Notably, some mid-cap and ETF names posted outsized moves on both the upside and downside, while the banking sector witnessed heavy institutional activity and unusual volumes.
Key Market Trends & Breadth
- Turnover Surge: While volume fell marginally (341.76M from 359.82M), value traded rose sharply, indicating more high-ticket trades (institutions). This hints at selective portfolio repositioning and potential block trading.
- Advancers vs Decliners: With a 1.17x breadth (27 advancers vs 23 decliners), the session showed modest underlying strength, but with more volume down on 76 stocks and only 62 up – suggesting gain concentration among fewer stocks.
Top Gainers & Losers of the Day
| Symbol | Name | % Change | RSI | MACD |
|---|---|---|---|---|
| VSPBONDETF | Vetiva S&P NG Sovereign Bond ETF | +25.47% | 46.6 | -7.81 |
| NEWGOLD | NewGold ETF | +25.31% | 46.5 | 495.90 |
| ABBEYBDS | Abbey Building Society | +9.99% | 99.6 (extremely overbought) | 0.66 |
| SOVRENINS | Sovereign Trust Insurance | +7.69% | 46.2 | -0.04 |
| NGXGROUP | Nigerian Exchange Group | +7.30% | 65.8 | 1.00 |
| Symbol | Name | % Change | RSI | MACD |
|---|---|---|---|---|
| IMG | Industrial & Medical Gases Nig. | -10.00% | 99.99 (extremely overbought) | 0.00 |
| GUINEAINS | Guinea Insurance | -9.52% | 50.4 | -0.01 |
| DAARCOMM | Daar Communications | -7.94% | 48.5 | -0.012 |
| CILEASING | C & I Leasing | -7.89% | 46.1 | -0.063 |
| CUSTODIAN | Custodian and Allied | -5.62% | 41.3 | -0.64 |
- ETF Surge/Dip: VSPBONDETF and NEWGOLD ETFs showed extreme price volatility, up 25%+, while NEWGOLD’s high MACD/volume hints at speculative or hedging moves. Such outsized ETF action often precedes market sentiment shifts.
- ABBEYBDS: Remarkable 9.99% jump, with an RSI of 99.6, showing extreme overbought levels—a strong caution of potential short-term exhaustion or reversal despite broad momentum.
- IMG: Highly unusual – down 10% with RSI at 99.99! This rare combo (overbought with a large single-day loss) strongly suggests capitulation after an overextended run.
- NGXGROUP: Maintains upside momentum (RSI 65.8, positive MACD), showing buying interest possibly ahead of corporate news or sector rotation into capital markets-linked stocks.
Deep Insights, Predictions & Unusual Activity
- Turnover Implications: The sharp Naira value rise despite a lower overall volume signals institutions are bidding up preferred names—look for follow-through in liquid large-caps, especially banks.
- Advancers vs Decliners: Number of advancers just edges decliners, but more stocks saw volume fall (76 vs 62 up) — a stealth sign that buying is narrowly focused.
-
Unusual Volume Flags (see table below):
- GEREGU Power: Trades at 579% above average volume (5M vs 0.74M, unchanged price) — may indicate either absorption at current level or a large hand rebalancing.
- GTCO, FCMB, CHAMS: Trading at more than double average volumes, but price action diverges. GTCO (-1.58%) and CHAMS (-4.76%) sold down, FCMB (-1.09%); clear sign that institutional exits may be underway in banking and fintech/processing.
- UPDCREIT: -8.2% decline on 262% volume surge hints at institutional exit or a fund facing redemption pressure.
-
YTD Gainer/Loser Table Trends:
- ABBEYBDS (+171.7% YTD): Momentum darling, but flashing caution with extreme RSI.
- VSPBONDETF, NEWGOLD: Feature among top short-term gainers, yet both have negative/flat YTD, highlighting volatility rather than sustained uptrend.
- High Beta Risks: Several top-momentum stocks have high Betas (e.g., VSPBONDETF -3.08), indicating wild swings that can be treacherous for the unwary.
- Bearish Tables: GTCO, ZENITHBANK, UBA all in bearish momentum/trend, with YTD now flat-to-negative for most. UBA’s RSI has collapsed to 30, a classical stock oversold zone.
-
Bullish Momentum Standouts:
- VSPBONDETF, NEWGOLD, SOVRENINS, NGXGROUP: All crossed above 15DMA, confirming short-term buying pressure. However, most of these do not show "classical" overbought signals on RSI, except ABBEYBDS (99.6 — classic overheated).
- Institutional preference shifting to ETFs and defensive sectors.
-
Bearish Momentum Names:
- Key banks (GTCO, UBA, ZENITHBANK), and CHAMS have crossed below 15DMA, confirming technical selling pressure, with GTCO and UBA both on unusually high selling volume.
- UPDCREIT’s breakdown on high volume (and generous 10.87% dividend yield) could scare yield-seeking investors into monitoring further downside risk.
Contrarian Signals (Conflicting technicals)
- IMG: RSI at 99.99 (overbought extreme), but -10% loss today and -9.88% YTD — suggests a possible "blowoff" top or momentum collapse. Watch for sharp reversals.
- ABBEYBDS: Incredible price momentum (YTD +171.67%), but RSI is unsustainably high at 99.6. This could signal imminent mean-reversion—momentum traders might consider profit-taking strategies or tighter stops.
- GTCO: Despite a bearish breakdown below 15DMA (trending down, negative short-term momentum), it is the only major bank with positive YTD (+3.51%); signals near-term oversold bounce could follow after heavy selling volume.
- ZENITHBANK: Bearish technically (new lows, negative momentum) but institutional flows dominate – with over 20.17% of trade value from institutions. Contrarian investors may spot a possible bottom if flows stabilize.
Sector Heatmap & Institutional/Technical Tally
| Sector | Performance | Top Mover | Institutional | Retail | Technical Signal |
|---|---|---|---|---|---|
| ETF | Strongly Up (VSPBONDETF, NEWGOLD) | VSPBONDETF (+25%), NEWGOLD (+25%) | (Likely) | | Bullish (Price>>15DMA) |
| Banking | Weak (GTCO -1.6%, ZENITHBANK -3.9%, UBA +0.47%) | GTCO, ZENITHBANK | (Heavy - see clustering) | | Bearish (Below 15DMA, Negative MACD) |
| Insurance | Mixed/Up (SOVRENINS +7.7%, WAPIC +5.5%) | SOVRENINS, WAPIC | | | Bullish (Above 15DMA) |
| Real Estate | Down (UPDCREIT -8.2%) | UPDCREIT | Neutral | Neutral | Bearish (Break below 15DMA, High Vol) |
| Processing/Fintech | Down (CHAMS -4.7%) | CHAMS | | | Bearish (Below 15DMA, Unusual Vol) |
| Market Operators | Up (NGXGROUP +7.3%) | NGXGROUP | | | Bullish (Above 15DMA) |
| Energy/Utilities | Flat (GEREGU) | GEREGU | (High Inst.) | Low | Watch for confirmation on volumes |
Dividend-Beta Matrix — Defensive Opportunities
| Stock | Dividend Yield | Beta | Momentum | Implications |
|---|---|---|---|---|
| SOVRENINS | 3.75% | 1.12 | Bullish (Above 15DMA) | Defensive + momentum. Possible buy-on-dips for yield/tech traders. |
| WEMABANK | 5.81% | 1.25 | Neutral-Strong | High yield, but watch volatility. |
| UBA | 5.96% | 1.56 | Bearish (Below 15DMA) | Yield attractive but technicals weak. Watch for oversold reversal. |
| UPDCREIT | 10.87% | -0.11 | Bearish (Breakdown) | Very high yield, but negative momentum/REIT sells off on volume. |
| AFRIPRUD | 1.27% | 0.64 | Weak | Low beta, moderate yield—defensive, but no momentum now. |
- Special Note: Some high-dividend names (e.g., SOVRENINS, UPDCREIT) appear in both yield lists and technical momentum tables. This is a strong "yield trap risk" signal—if price continues to break down, even high yields will be punished.
Institutional Clustering Alerts
- ZENITHBANK: Accounted for a massive 20.17% of institutional trade value—yet bears control short-term. If institutional flows turn positive (e.g., reduced sell pressure), this stock could rally sharply. Watch the order book.
- ACCESSCORP: Also a favorite of institutions and retails, but with RSI nearly 31 (bottoming). Holds potential for a reversal if sell-off exhausts. Top traded by both investor classes.
- GTCO, UBA, FIDELITYBK: Heavy institutional activity, but technicals weak. Caution: possible rotational exits underway.
High Dividend Yields & Momentum: Double-Edged Swords
- SOVRENINS: Momentum is positive and yield is high – a rare bullish combination. Potential for further upside if volume persists.
- UPDCREIT: Double-digit yield (10.87%), but breakdown on technicals. Caution: chasing high yield can be risky amidst price slides!
Suggestions & Tactical Trading Ideas
- Momentum Traders: Consider trailing stops or profit-taking on ABBEYBDS and any ETF with outsized single-day moves; extreme RSI signals mean-reversion risk.
- Institutional Watchers: Monitor volume signatures in large-cap banks: heavy volume declines (GTCO, ZENITHBANK) can soon reverse if panic selling halts.
- Yield Hunters: Don’t just chase high yields (UPDCREIT); confirm with positive momentum and stable volume before entry.
- Contrarians: IMG’s blowoff move and extreme RSI may offer a short opportunity or a post-capitulation bounce — but confirm with further price action.
- Cautious Buyers: SOVRENINS combines yield and momentum—warranting a watchlist spot for both value and technical-oriented investors.
YTD Top 5 Gainers
| Name | %ChgYTD | %Chg5Dys | RSI | DivYield | Beta |
|---|---|---|---|---|---|
| ABBEYBDS | +171.67% | +32.95% | 99.6 | 1.43% | 0.69 |
| VFDGROUP | +116.22% | +9.46% | 96.9 | 0.00% | 0.11 |
| NNFM | +79.95% | -9.97% | 89.7 | 1.44% | 0.27 |
| NEWGOLD | +71.81% | +25.31% | 46.5 | 0.00% | 0.23 |
| WEMABANK | +31.32% | +8.64% | 61.5 | 5.81% | 1.25 |
YTD Top 5 Losers
| Name | %ChgYTD | %Chg5Dys | RSI | DivYield | Beta |
|---|---|---|---|---|---|
| AFRIPRUD | -39.60% | -9.00% | 33.0 | 1.27% | 0.64 |
| GUINEAINS | -35.96% | -9.52% | 50.5 | 1.96% | 1.51 |
| RTBRISCOE | -30.18% | -9.43% | 35.3 | 4.35% | -0.16 |
| INTENEGINS | -20.86% | -9.76% | 32.8 | 3.40% | 0.01 |
| SOVRENINS | -20.33% | +15.29% | 46.2 | 3.75% | 1.12 |
Market Activity & Trade Summary
-
Institutions vs Retail:
- Institutions executed 13.11% of trade count, but a commanding 67.3% of volumes and a dominant 91.47% of trade value, confirming that today's market moves were driven by large, institutionally-driven blocks.
- Retail investors participated largely in number of trades (86.89%), but their trades accounted for only 8.53% of value, reinforcing that much of today’s directional price movement was dictated by institutional flows.
-
Top Traded Symbols
- Institutional:
- ACCESSCORP (17% vol.),
- GTCO (10%),
- UBA (6.9%),
- ZENITHBANK (3.1%),
- FIDELITYBK (2.7%)
- Retail:
- ACCESSCORP,
- REGALINS,
- ZENITHBANK,
- GTCO,
- UBA
- Institutional:
-
Hidden Insight:
Institutional and retail investors are both heavily trading ACCESSCORP, GTCO, ZENITHBANK, and UBA—suggesting high sector rotation and ongoing re-pricing in banking stocks.
- With both sides trading aggressively, volatility in these stocks may persist – watch for price dislocations and swift reversals as "smart money” reclaims control.
Summary
- Bullish signals centered around select ETFs and insurance, while broad banking sector shows technically bearish and heavy institutional flows – often a late-stage correction marker or an institutional "shakeout" before accumulation.
- Monitor names with exceptional RSI (ABBEYBDS, IMG) for mean-reversion or trend reversals.
- Liquidity remains robust, and as institutional investors dominate volumes and value, traders should remain nimble and alert for post-selloff rallies, especially in the banks and large-caps.
- Uptrending, high-yield stocks (SOVRENINS, WEMABANK) offer rare risk/reward, but so do deeply oversold sector behemoths (UBA, GTCO) for bounce hunters.
FX Note: The Naira slipped -0.91% to 1604/$, an additional macro concern to watch for listed exporters and importers.
|
Top ASI Gainers Over Last 5 Trading Days
|
Top ASI Losers Over Last 5 Trading Days
|
For more detailed analysis, on InfoWARE Market Data Terminal <NSEPERF> <GO>
On InfoWARE Finance Mobile App (Android, iPhone & iPad, Windows Phone and Windows 8/10), "Top Gainers & Losers"
VETIVA S & P NIGERIA SOVEREIGN BOND ETF (VSPBONDETF) topped the advancers list closing at N251.00 with a gain of 25.47% followed by NEWGOLD EXCHANGE TRADED FUND (ETF) (NEWGOLD) which closed at N50,000.00 with a gain of 25.31%.
On the flip side INDUSTRIAL & MEDICAL GASES NIGERIA PLC (IMG) and GUINEA INSURANCE PLC. (GUINEAINS) topped the decliners log with a loss of -10.00% at a close of N34.20, and -9.52% to close the day at N0.57 respectively.
| Symbol | LClose | %Chg |
|---|---|---|
| VSPBONDETF | 251.00 | 25.47 |
| NEWGOLD | 50,000.00 | 25.31 |
| ABBEYBDS | 8.15 | 9.99 |
| SOVRENINS | 0.98 | 7.69 |
| NGXGROUP | 33.80 | 7.30 |
For more detailed analysis,
- On InfoWARE Market Data Terminal <TOPG> <GO>
- On InfoWARE Finance Mobile App ( Android, iPhone & iPad and Windows 10) , "Top Gainers & Losers"
Currency Market
In the currency market, the Naira fell 0.91%(-14.46) against the Dollar to settle at 1 to 1NSE: Bull Signal - Price crossed above 15 Day MA
This signal implies these stocks are under buying pressure and the price might continue to rise and therefore positions should be monitored closely. Further suggested analysis include looking at the overall market (ASI) to see if the uptrend is market wide, sector wide or specific to the stock. Portfolio managers tend to use this as a signal to do more research to add to their positions or lock in some profits. Typically further analysis should be done using commands like PC and RV on the InfoWARE Market Data Terminal. Another command is ALERTS to set price triggers for possible exit or entry as necessary
For more detailed analysis,
- On InfoWARE Market Data Terminal <NSEPERF> <GO>
- On InfoWARE Finance Mobile App ( Android , iPhone & iPad and Windows 10) , "Top Gainers & Losers"
| Symbol | Price | %Chg | 15DMA | PE | EPS | DivY | MktCap | Vol | Trades | Value | LstTradeTime |
|---|---|---|---|---|---|---|---|---|---|---|---|
| VSPBONDETF | 251.00 | 20.30 | 217.79 | 0.00 | 0.00 | 113.00 | 4.00 | 28.35K | 16-Apr-2025 14:31:16.393 | ||
| NEWGOLD | 50,000.00 | 20.20 | 43,346.46 | 0.00 | 0.00 | 0.00 | 0.00 | 42.00 | 6.00 | 2.06M | 16-Apr-2025 14:31:16.127 |
| SOVRENINS | 0.98 | 7.14 | 0.94 | 27.95 | 0.03 | 3.75 | 11.14B | 1.73M | 23.00 | 1.72M | 16-Apr-2025 14:30:28.917 |
| NGXGROUP | 33.80 | 6.80 | 31.96 | 0.00 | 0.00 | 2.73 | 66.39B | 2.23M | 57.00 | 73.79M | 16-Apr-2025 14:30:25.280 |
| SIAMLETF40 | 300.00 | 6.40 | 299.84 | 0.00 | 0.00 | 10.00 | 2.00 | 3.00K | 16-Apr-2025 14:31:16.157 | ||
| DEAPCAP | 0.96 | 6.25 | 0.94 | 188.84 | 0.01 | 13.76 | 1.44B | 572.55K | 11.00 | 537.42K | 16-Apr-2025 14:30:22.487 |
| WAPIC | 2.18 | 5.50 | 2.11 | 72.55 | 0.02 | 2.56 | 52.30B | 1.10M | 52.00 | 2.29M | 16-Apr-2025 14:30:30.140 |
| NB | 32.95 | 2.58 | 32.92 | 16.95 | 1.60 | 3.79 | 338.60B | 10.65M | 100.00 | 340.98M | 16-Apr-2025 14:30:24.937 |
| JAPAULGOLD | 1.89 | 2.12 | 1.88 | 0.19 | 12.01 | 0.90 | 11.84B | 1.96M | 60.00 | 3.66M | 16-Apr-2025 14:30:24.133 |
NSE: BEAR Signal - Price crossed below 15 Day MA
This signal implies these stocks are under selling pressure and the price might continue to slide and therefore positions should be monitored closely. Further suggested analysis include looking at the overall market (ASI) to see if the downtrend is market wide, sector wide or specific to the stock. If the overal market trend is upwards, then since these stocks are heading in the opposite direction, then further analysis should be done using commands like PC and RV on the InfoWARE Market Data Terminal. Another command is ALERTS to set price triggers for possible exit is necessar
For more detailed analysis,
- On InfoWARE Market Data Terminal <BEARM> <GO>
- On InfoWARE Finance Mobile App ( Android , iPhone & iPad and Windows 10)
| Symbol | Price | %Chg | 15DMA | PE | EPS | DivY | MktCap | Vol | Trades | Value | LstTradeTime |
|---|---|---|---|---|---|---|---|---|---|---|---|
| GTCO | 59.00 | -1.61 | 66.22 | 7.49 | 7.10 | 1.88 | 1,736.44B | 36.78M | 703.00 | 2.17B | 16-Apr-2025 14:30:23.457 |
| UPDC | 2.90 | -3.45 | 2.94 | 0.00 | 0.00 | 34.25 | 53.82B | 860.87K | 69.00 | 2.54M | 16-Apr-2025 14:30:29.893 |
| NGXMERIVAL | 9,923.88 | -3.69 | 10,197.89 | 12.13 | 38.38 | 0.00 | 0.00 | 154.16M | 4,142.00 | 3.59B | 16-Apr-2025 14:30:41.420 |
| ZENITHBANK | 44.00 | -4.09 | 47.86 | 3.33 | 13.30 | 2.25 | 1,381.45B | 13.96M | 863.00 | 616.95M | 16-Apr-2025 14:31:16.690 |
| CHAMS | 2.00 | -5.00 | 2.05 | 27.02 | 0.07 | 1.56 | 9.39B | 24.62M | 164.00 | 53.34M | 16-Apr-2025 14:31:15.163 |
| FGSUK2033S6 | 98.00 | -5.06 | 99.73 | 0.00 | 0.00 | 1.00 | 1.00 | 980.00 | 16-Apr-2025 14:30:38.770 | ||
| DAARCOMM | 0.58 | -8.62 | 0.61 | 0.00 | 0.00 | 0.00 | 6.96B | 712.96K | 31.00 | 411.07K | 16-Apr-2025 14:30:22.373 |
| FGSUK2032S5 | 92.01 | -8.68 | 96.84 | 0.00 | 0.00 | 1.00K | 1.00 | 920.10K | 16-Apr-2025 14:30:38.557 | ||
| UPDCREIT | 5.60 | -8.93 | 5.86 | 9.09 | 0.57 | 10.87 | 14.94B | 3.07M | 54.00 | 17.08M | 16-Apr-2025 14:30:46.953 |
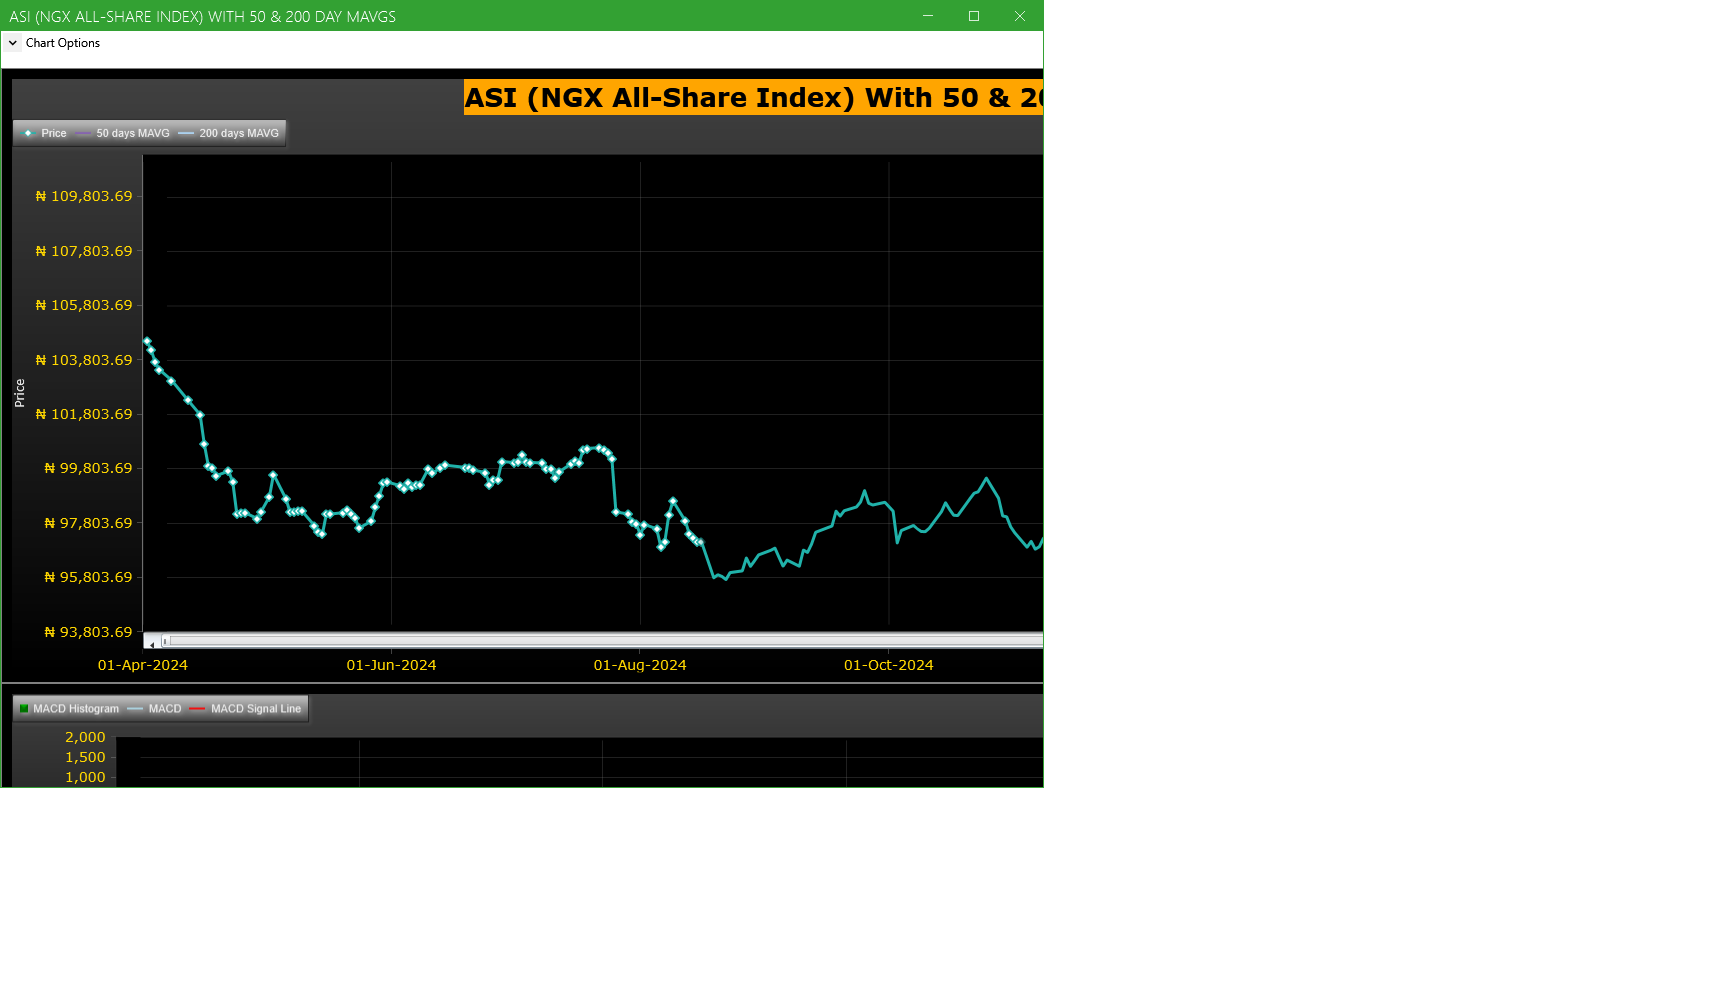
Market Trend - ASI (NGX All-Share-Index) With 50 & 200 Day MAvgs Chart
Technical traders typically use the 50 & 200 day moving averages to aid in choosing
where to enter or exit a position, which then causes these levels to act as strong
support or resistance. As a general guideline, if the price is above a moving average,
the trend is up. If the price is below a moving average, the trend is down.
It is important to note that critics of technical analysis say that moving averages act
as support and resistance because so many traders use these indicators to inform their
trading decisions. Also moving averages tend to work quite well in strong trending conditions
but poorly in choppy or ranging conditions.
Trading Strategies: Crossovers
Crossovers are one of the main moving average strategies. The first type is a price crossover,
which is when the price crosses above or below a moving average to signal a potential change
in trend. Another strategy is to apply two moving averages to a chart: one longer and one
shorter. When the shorter-term MA crosses above the longer-term MA, it is a buy signal, as
it indicates that the trend is shifting up. This is known as a golden cross. Meanwhile, when
the shorter-term MA crosses below the longer-term MA, it is a sell signal, as it indicates that
the trend is shifting down. This is known as a dead/death cross
For more detailed analysis,
- On InfoWARE Market Data Terminal <CI> <GO>
- On InfoWARE Finance Mobile App ( Android , iPhone & iPad and Windows 10) , "Research"
Unusual Volume: Volume traded is more than double the 90 day moving average (All exchanges; ASI & ASem). For more detailed analysis,
- On InfoWARE Market Data Terminal <UV> <GO>
- On InfoWARE Finance Mobile App ( Android , iPhone & iPad and Windows 10)
| Symbol | Name | Volume | 90DAvgVol | %VolChg | Price | LClose | %Chg | Trades | Value |
|---|---|---|---|---|---|---|---|---|---|
| GTCO | GUARANTY TRUST HOLDING COMPANY PLC | 36.78M | 16.35M | 124.99 | 59.00 | 59.95 | -1.58 | 703 | 2.17B |
| FCMB | FCMB GROUP PLC. | 28.77M | 12.49M | 130.41 | 9.10 | 9.20 | -1.09 | 332 | 261.89M |
| CHAMS | CHAMS PLC | 24.62M | 6.82M | 260.85 | 2.00 | 2.10 | -4.76 | 164 | 53.34M |
| GEREGU | GEREGU Power PLC | 5.00M | 735.95K | 579.46 | 1,141.50 | 1,141.50 | 0.00 | 69 | 5.14B |
| UPDCREIT | UPDC REAL ESTATE INVESTMENT TRUST | 3.07M | 847.57K | 262.34 | 5.60 | 6.10 | -8.20 | 54 | 17.08M |
Investment Insights - High Div. Stocks
Dividend stocks distribute a portion of the company earnings to investors on a regular basis and they can a great choice for investors looking for regular income. As an investment or trading strategy, high dividend yield equities provide annual cash payments as against mostly capital gains in the price of a stock. The list in the table below represent the highest dividend paying stocks from the list of the most liquid stocks in the NSE top 30.
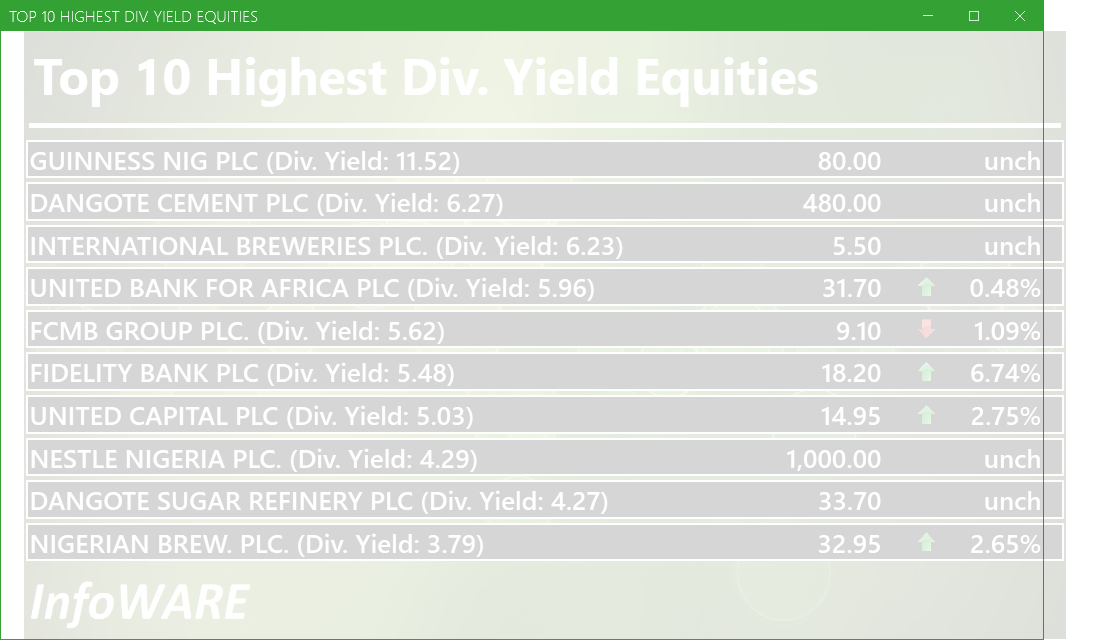
For more detailed analysis,
- On InfoWARE Market Data Terminal <HYIELD> <GO>
- On InfoWARE Finance Mobile App ( Android , iPhone & iPad and Windows 10) , "Research"
Investment Insights - Stocks outperforming the ASI but with approximately the same risk
These list of stocks represent equities that are less risky than the ASI but doing better than the ASI (All Shares Index) using the YTD (Year to Date) returns as the measure. The risk is measured by Beta. Beta is an assessment of a stock's tendency to undergo price changes, (its volatility), as well as its potential returns compared to the ASI. It is expressed as a ratio, where a score of 1 represents performance comparable to the ASI, and returns above or below the market may receive scores greater or lower than 1.
For a full list of both positively and negatively corelated stocks visit InfoWARE Market Data Terminal
- On InfoWARE Market Data Terminal <BANL> <GO>
- On InfoWARE Finance Mobile App ( Android , iPhone & iPad and Windows 10)
| Symbol | DivYield | PE | EPS | Beta | %ChgYTD | ASIYTDReturn | BetaDiff |
|---|---|---|---|---|---|---|---|
| HONYFLOUR | 1.40 | 16.28 | 0.31 | 0.99 | 58.53 | 0.65 | 0.01 |
| FIDELITYBK | 5.48 | 13.24 | 1.17 | 0.89 | 7.06 | 0.65 | 0.11 |
| NB | 3.79 | 16.95 | 1.60 | 0.79 | 2.97 | 0.65 | 0.21 |
| UNILEVER | 2.81 | 67.09 | 0.40 | 0.75 | 5.69 | 0.65 | 0.25 |
| HMCALL | 0.00 | 0.00 | 0.00 | -0.74 | 7.19 | 0.65 | 0.26 |
| VETGOODS | 0.00 | 0.71 | 15.41 | 0.65 | 0.29 | ||
| VETGRIF30 | 0.00 | 0.71 | 6.49 | 0.65 | 0.29 | ||
| ABBEYBDS | 1.43 | 0.00 | 0.00 | 0.70 | 171.67 | 0.65 | 0.30 |
| NEM | 6.52 | 24.99 | 0.37 | 0.69 | 7.50 | 0.65 | 0.31 |
| TANTALIZER | 1.50 | 0.00 | 0.00 | 0.69 | 6.22 | 0.65 | 0.31 |
African Markets
| Name | LClose | Change | %Chg |
|---|---|---|---|
| BRVM Stock Exchange | 290.79 | 1.59 | 0.55 |
| Botswana Stock Exchange | 10,113.04 | 0.00 | 0.00 |
| Egyptian Exchange | 30,810.70 | 730.94 | 2.43 |
| Ghana Stock Exchange | 6,100.93 | 1.22 | 0.02 |
| Casablanca Stock Exchange | 16,070.49 | -306.24 | -1.87 |
| Malawi Stock Exchange | 294,562.18 | -1,837.68 | -0.62 |
| Nigeria Stock Exchange | 104,563.34 | -220.05 | -0.21 |
| Nairobi Securities Exchange | 126.78 | 1.02 | 0.81 |
| Rwanda Stock Exchange | 148.96 | 0.00 | 0.00 |
| Uganda Securities Exchange | 1,262.37 | -32.37 | -2.50 |
Nigeria Market Indexes
| Symbol | LClose | %Chg | WTD% | MTD% | QTD% | YTD% | MktCap | Trades |
|---|---|---|---|---|---|---|---|---|
| ASI | 103,851.88 | -0.68 | -0.65 | -1.61 | -1.61 | 0.65 | 11,298 | |
| NGX30 | 3,848.89 | -0.72 | -0.72 | -1.80 | -1.80 | 0.89 | 6,507 | |
| NGXAFRBVI | 2,387.79 | -7.09 | -7.01 | -10.34 | -10.34 | -3.75 | 3,642 | |
| NGXAFRHDYI | 16,171.37 | -0.69 | -1.56 | -2.84 | -2.84 | -5.03 | 2,899 | |
| NGXASEM | 1,588.92 | 0.00 | 0.00 | 0.06 | 0.06 | 0.33 | 2 | |
| NGXBNK | 1,061.06 | -4.67 | -4.78 | -8.59 | -8.59 | -2.42 | 3,742 | |
| NGXCG | 2,825.41 | -2.88 | -2.99 | -6.15 | -6.15 | -0.14 | 6,463 | |
| NGXCNSMRGDS | 1,808.87 | 0.34 | 1.06 | -0.37 | -0.37 | 4.30 | 868 | |
| NGXCOMMDTY | 1,002.53 | 0.00 | 0.00 | -0.10 | -0.10 | 0.25 | ||
| NGXGROWTH | 7,405.89 | 0.00 | -0.50 | 0.19 | 0.19 | -4.60 | 35 | |
| NGXINDUSTR | 3,473.16 | 0.00 | 0.00 | -0.48 | -0.48 | -2.76 | 435 | |
| NGXINS | 642.90 | 0.80 | 0.95 | -5.50 | -5.50 | -18.23 | 1,528 | |
| NGXLOTUSISLM | 7,458.57 | 0.00 | 0.02 | -1.27 | -1.27 | 7.04 | 1,172 | |
| NGXMAINBOARD | 4,998.23 | -0.57 | -0.53 | -1.25 | -1.25 | -0.11 | 7,869 | |
| NGXMERIGRW | 6,757.68 | 1.69 | 1.71 | -1.49 | -1.49 | 3.59 | 1,343 | |
| NGXMERIVAL | 9,923.88 | -3.56 | -2.84 | -3.59 | -3.59 | -4.86 | 4,142 | |
| NGXOILGAS | 2,411.83 | -0.05 | -0.05 | -1.42 | -1.42 | -11.04 | 159 | |
| NGXPENBRD | 1,873.67 | 0.02 | 0.01 | -0.80 | -0.80 | 2.30 | 9,607 | |
| NGXPENSION | 4,706.49 | 0.09 | -0.21 | -1.67 | -1.67 | 3.80 | 7,012 | |
| NGXPREMIUM | 10,059.23 | -0.17 | -0.16 | -1.05 | -1.05 | 3.35 | 3,394 | |
| NGXSOVBND | 651.45 | 0.00 | 0.36 | 3.92 | 3.92 | 8.30 | 0 |
For more detailed analysis,
- On InfoWARE Market Data Terminal <MKTINS> <GO>
- On InfoWARE Finance Mobile App ( Android, iPhone & iPad and Windows 10) , "Market Indexes"
Find the topic interesting? Will like to comment? Contact Us at solutions@infowarelimited.com
Top News

InfoWARE AI Analyst Weekly Market Report: 17-Apr-2025
InfoWARE AI Analyst Daily Market Report: 17-Apr-2025
Chart Of The Day - ASI Chart Vs ASI Advance Decline Line (YTD) (17-Apr-2025 15:13:14.880)
InfoWARE AI Analyst Daily Market Report: 17-Apr-2025

[ABCTRANS]>>Notice of Meeting -<ABC TRANSPORT PLC>
[MEYER]>>Notice of Meeting -<MEYER PLC>
[OKOMUOIL]>>Notice of Meeting -<OKOMU OIL PALM PLC.>
[MERGROWTH]>> DAILY INDICATIVE PRICES
[XNSA]>> DAILY FUND PRICE SUBMISSION - FCMB ASSET MANAGEMENT LIMITED
[XNSA]>> PUBLIC HOLIDAY
[XNSA]>> FACTS BEHIND THE RIGHTS ISSUE PRESENTATION BY WEMA BANK PLC
[AIRTELAFRI]>>Corporate Disclosures-<Airtel Africa Plc>
[STANBIC]>>Notice of Meeting -<STANBIC IBTC HOLDINGS PLC>
[BUACEMENT]>>Notice of Meeting -<BUA Cement Plc>
[XNSA]>> NGX FIXED INCOME INDICATIVE PRICE LIST FOR APR 17, 2025
[VETINDETF]>> DAILY INDICATIVE PRICES
[NEWGOLD]>> DAILY INDICATIVE PRICES
[XNSA]>> WEMA BANK PLC: ACTIVATION OF CODE FOR TRADING IN RIGHTS

Daily Business News Brief
[SOVRENINS]>>Corporate Disclosures-<SOVEREIGN TRUST INSURANCE PLC>
[SIAMLETF40]>>DAILY INDICATIVE PRICES
[XNSA]>> NOTIFICATION OF PRICE ADJUSTMENT
MARKET PERFORMANCE REPORT & DAILY PRICE LIST

CardinalStone Earnings Update - Access Holdings Plc FY'24 Audited results - Interest Earning Assets expansion bolsters gross earnings growth
Market Summary 16-04-2025
Chart Of The Day - ASI Chart Vs ASI Advance Decline Line (YTD) (16-Apr-2025 15:07:14.944)
InfoWARE AI Analyst Daily Market Report: 16-Apr-2025
ACCESS HOLDINGS - FY 2024 QUICK TAKE
[VFDGROUP]>>Notice of Meeting -<VFD Group Plc>
[NEWGOLD]>> DAILY INDICATIVE PRICES
Get IDIA - the stock trading app for the modern investor
Solutions by Business
Product Suites
Company
Contacts
- 8th Floor,
- South Atlantic Petroleum Towers,
- 1 Adeola Odeku Street,
- Victoria Island,
- Lagos, Nigeria.
- Email: solutions@infowarelimited.com
Follow Us
 |
 |
 |
 |