


Chart Of The Day - ASI Chart Vs ASI Advance Decline Line (YTD) (10-Jun-2025 15:15:48.378) | InfoWARE Finance
Get IDIA - the stock trading app for the modern investor


Chart Of The Day - ASI Chart Vs ASI Advance Decline Line (YTD) (10-Jun-2025 15:15:48.378)
(Source: InfoWARE Terminal, Date: 10-Jun-2025)
Dear Investor,
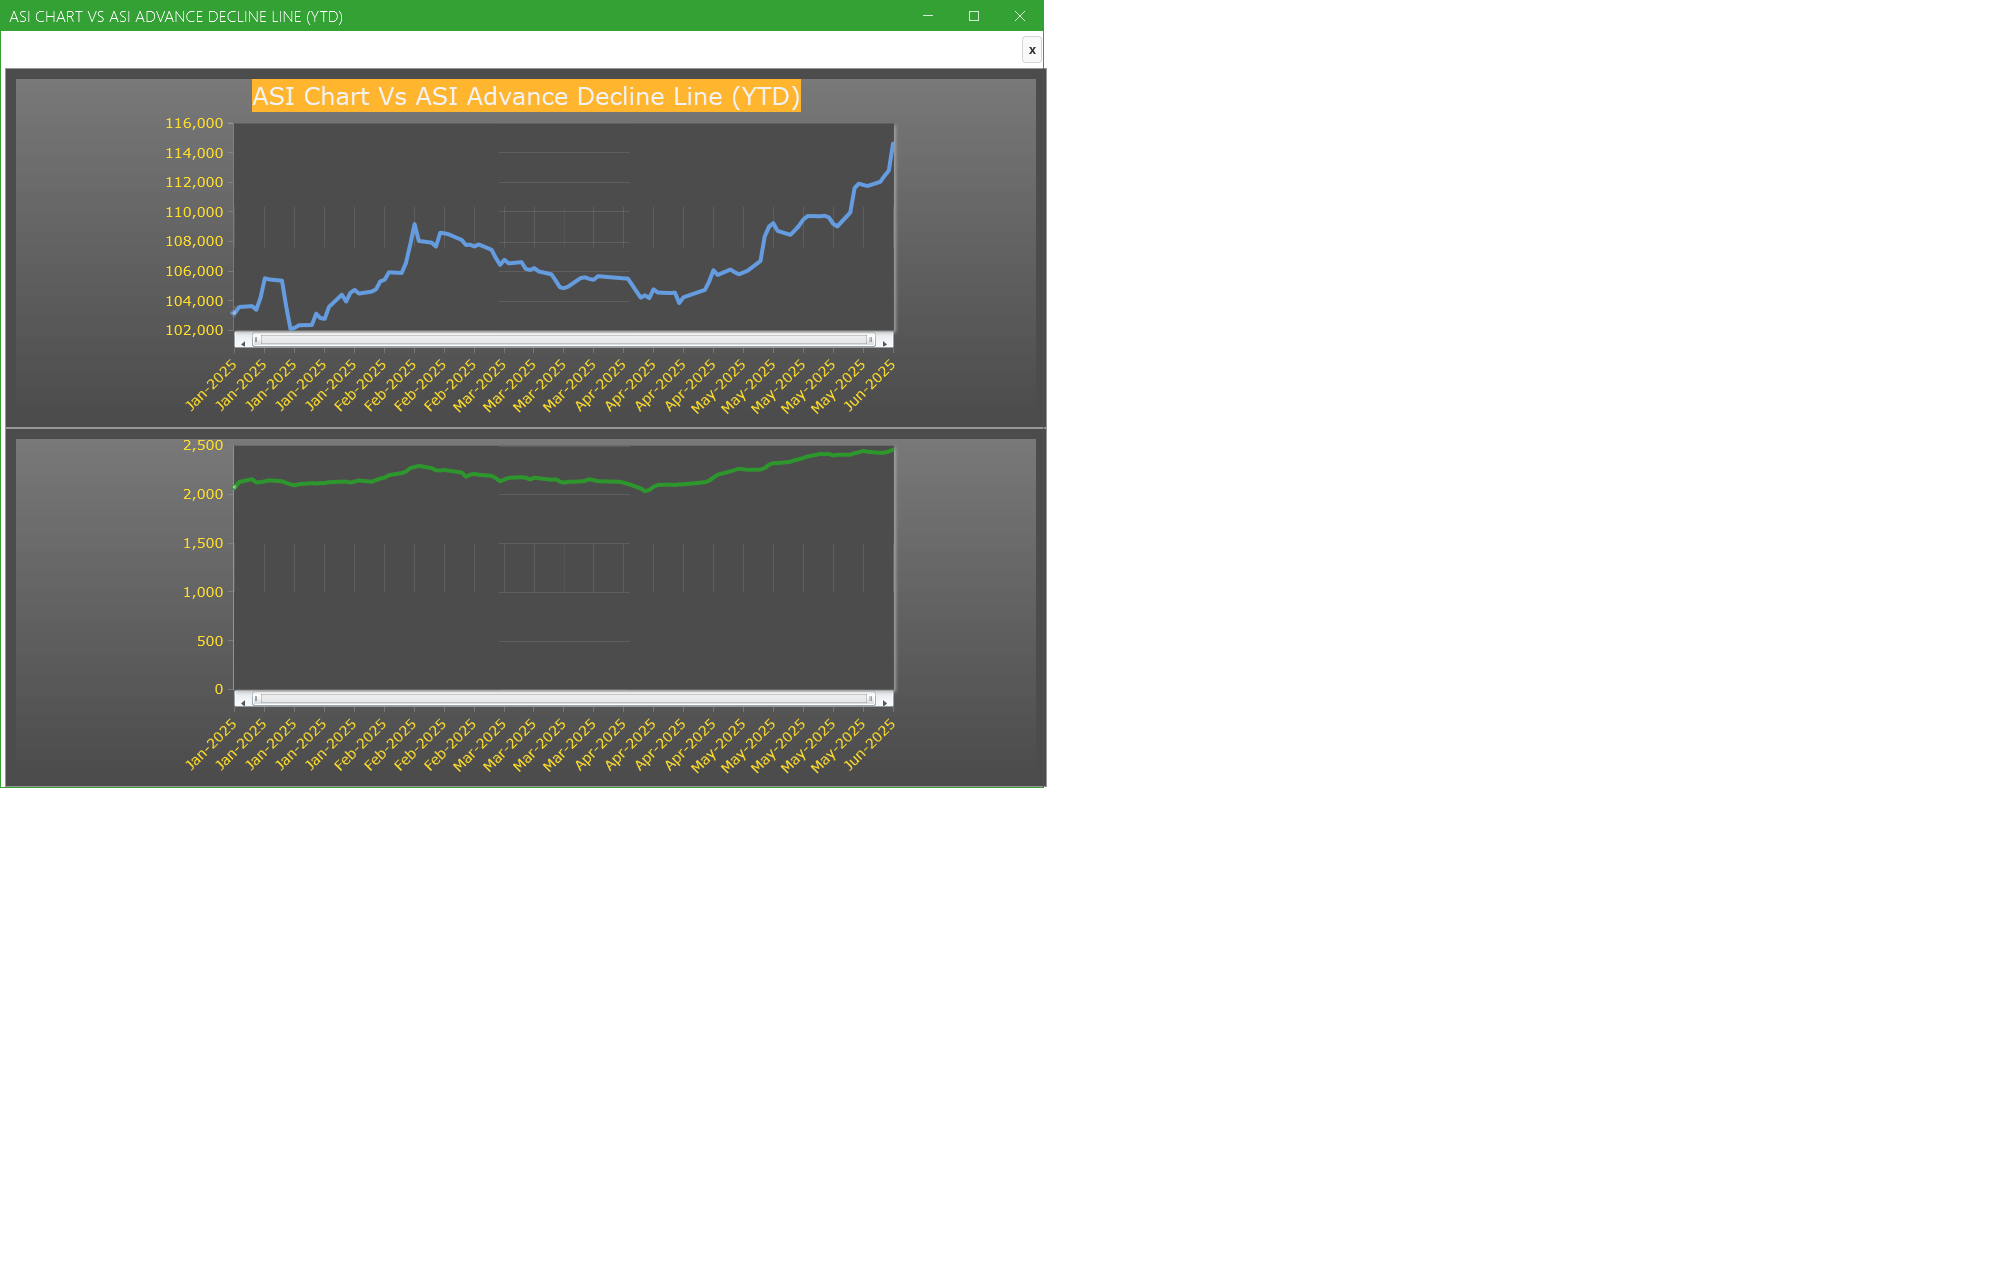
Chart Of The Day - ASI Chart Vs ASI Advance Decline Line (YTD) - 10-Jun-2025 15:15:48.378
Chart of the day: ASI Chart Vs ASI Advance Decline Line (YTD) - Market breath
The A/D line is used to show market sentiment, as it tells traders whether there are more stocks rising or falling. It is used to confirm price trends in major indexes, and can also warn of reversals when divergence occurs.
Key Takeaways
- The advance/decline line (A/D) is a breadth indicator used to show how many stocks are participating in a stock market rally or decline.
- When major indexes are rallying, a rising A/D line confirms the uptrend showing strong participation.
- If major indexes are rallying and the A/D line is falling, it shows that fewer stocks are participating in the rally which means the index could be nearing the end of its rally.
- When major indexes are declining, a falling advance/decline line confirms the downtrend.
- If major indexes are declining and the A/D line is rising, fewer stocks are declining over time, which means the index may be near the end of its decline.
(Definition Source: Investopedia.com)
For more detailed analysis,
- On InfoWARE Finance Mobile App ( Android, iPhone & iPad and Windows 10) , "Research"
Find the topic interesting? Will like to comment? Contact Us at solutions@infowarelimited.com
Top News

Chart Of The Day - ASI Chart Vs ASI Advance Decline Line (YTD) (11-Jun-2025 15:12:45.811)
InfoWARE AI Analyst Daily Market Report: 11-Jun-2025

[STACO]>> Earning Forcast - <Q3-2025> ?-<STACO INSURANCE PLC>
[STACO]>> Earning Forcast - <Q3-2024> ?-<STACO INSURANCE PLC>
[XNSA]>> PUBLIC HOLIDAY
[MERGROWTH]>> DAILY INDICATIVE PRICES
[XNSA]>> CORDROS MILESTONE FUNDS' BID & OFFER PRICES
[XNSA]>> SUSPENSION IN TRADING OF THE SHARES OF NOTORE CHEMICAL INDUSTRIES PLC
[XNSA]>> CIS ACADEMY TRAINING ON "BOND ANALYSIS, VALUATION & TRADING
[AIRTELAFRI]>>Corporate Disclosures-<Airtel Africa Plc>
[ETRANZACT]>>Notice of Meeting -<E-TRANZACT INTERNATIONAL PLC>
[LOTUSHAL15]>> DAILY INDICATIVE PRICES
[VSPBONDETF]>> DAILY INDICATIVE PRICES
[XNSA]>> NGX FIXED INCOME INDICATIVE PRICE LIST FOR JUN 11, 2025
[REGALINS]>> Earning Forcast - <Q3-2025> ?-<REGENCY ALLIANCE INSURANCE PLC>
[XNSA]>> RESIGNATION OF MANAGING DIRECTOR
[XNSA]>> MARIMPEX FINANCE AND INVESTMENT CO. LIMITED - CHANGE OF COMPANY NAME
[XNSA]>> RESIGNATION OF A DIRECTOR
[XNSA]>> DAILY FUND PRICE SUBMISSION - FCMB ASSET MANAGEMENT LIMITED
[SIAMLETF40]>> DAILY INDICATIVE PRICES
[XNSA]>> H1 2025 BUSINESS CONTINUITY/DISASTER RECOVERY TEST
[LEARNAFRCA]>> Earning Forcast - <Q2-2025> ?-<LEARN AFRICA PLC>
Chart Of The Day - ASI Chart Vs ASI Advance Decline Line (YTD) (10-Jun-2025 15:15:48.378)
InfoWARE AI Analyst Daily Market Report: 10-Jun-2025
[UPL]>> Earning Forcast - <Q2-2025> ?-<UNIVERSITY PRESS PLC.>
[AIICO]>> Earning Forcast - <Q3-2025> ?-<AIICO INSURANCE PLC.>
[XNSA]>> CIS ACADEMY TRAINING ON "BOND ANALYSIS, VALUATION & TRADING
[XNSA]>> OFF MARKET TRADE
[XNSA]>> DAILY FUND PRICE SUBMISSION - FCMB ASSET MANAGEMENT LIMITED
[XNSA]>> NGX FIXED INCOME INDICATIVE PRICE LIST FOR JUN 10, 2025
Get IDIA - the stock trading app for the modern investor
Solutions by Business
Product Suites
Company
Contacts
- 8th Floor,
- South Atlantic Petroleum Towers,
- 1 Adeola Odeku Street,
- Victoria Island,
- Lagos, Nigeria.
- Email: solutions@infowarelimited.com
Follow Us
 |
 |
 |
 |