


InfoWARE AI Analyst Daily Market Report: 29-Sep-2025 | InfoWARE Finance
Get IDIA - the stock trading app for the modern investor


InfoWARE AI Analyst Daily Market Report: 29-Sep-2025
(Source: InfoWARE Terminal, Date: 29-Sep-2025)
Dear Investor,
NGX Daily Market Summary – Monday, September 29, 2025
Welcome to your first trading day recap for the final week of September! The NGX All-Share Index (ASI) gained +0.17% today, closing at 142,133.03, with the year-to-date return at an impressive +37.99%. Despite a flat open, positive momentum in select sectors helped cap gains, though market breadth remained soft. Turnover shrank notably, while advances failed to outpace decliners. Noteworthy, volumes surged for a handful of stocks — a sign of shifting interest among both institutional and retail players.
Previous Week’s Recap
Last week was characterized by profit-taking and sector rotation, but persistent strength in momentum stocks helped the ASI post a modest overall gain. Defensive sectors and high-yield names began attracting cautious institutional buying, even as growth names saw choppier action. Signs of divergence between the broader market and outperforming pockets is becoming more pronounced — a theme to watch as the quarter draws to a close.
Key Takeaways & Market Breadth
- Market Breadth: Breath remained weak at 0.69x, with 27 advancers but 39 decliners. Volume rose for 76 stocks, declined for 64.
- Turnover: Market turnover slumped -30.06% from the previous session, to 11.61B Naira — a pronounced sign of caution or consolidation as Q3 winds down.
- Unusual Volume: Stand-out surges in FIRSTHOLDCO (+168% vol), UPL (+169% vol), FIDSON (+116% vol), and GEREGU (+239% vol) suggest institutional repositioning or speculative flows.
Top Gainers & Losers
| Stock | %Change | RSI | MACD |
|---|---|---|---|
| THOMASWY | +10.00% | 57.6 | -0.006 |
| LIVINGTRUST | +9.90% | 55.5 | +0.066 |
| ETERNA | +9.86% | 41.2 | -1.73 |
| STANBICETF30 | +9.78% | 54.2 | +3.05 |
| CAVERTON | +9.28% | 47.5 | +0.010 |
| MANSARD | -10.00% | 52.3 | +0.371 |
| UPL | -9.85% | 52.3 | +0.092 |
| LEARNAFRCA | -9.72% | 51.9 | +0.144 |
| JBERGER | -8.70% | 54.6 | +3.72 |
| CORNERST | -7.42% | 49.3 | +0.028 |
- THOMASWY takes the top spot with a 10% surge, riding strong short-term momentum and a leading YTD gain.
- MANSARD, UPL, LEARNAFRCA all drop over -9.7%, each also featuring in YTD loser tables, suggesting sustained bearish pressure.
- CAVERTON and ETERNA show strong gains with bullish momentum signals (close above 15DMA).
Year-To-Date (YTD) Top Gainers & Losers (as of Today)
| Gainer | %ChgYTD | RSI | MACD | Loser | %ChgYTD | RSI | MACD |
|---|---|---|---|---|---|---|---|
| THOMASWY | +91.05% | 57.6 | -0.006 | CUSTODIAN | +151.46% | 53.3 | +2.57 |
| OMATEK | +52.50% | 48.2 | -0.059 | MANSARD | +59.65% | 52.3 | +0.37 |
| LIVINGTRUST | +29.22% | 55.5 | +0.066 | UPL | +40.26% | 52.3 | +0.092 |
| EUNISELL | +86.82% | 66.8 | +2.45 | LEARNAFRCA | +44.44% | 51.9 | +0.144 |
| CHAMS | +71.43% | 56.0 | +0.16 | CORNERST | +47.98% | 49.3 | +0.028 |
- Interestingly, MANSARD, UPL, LEARNAFRCA, CORNERST are top 5 YTD gainers yet were among today's biggest losers, indicating risk of near-term reversal or excessive overbought conditions unwinding.
Momentum & Technical Patterns
- Bullish Momentum: Stocks closing above their 15DMA: ETERNA (up 8.97%, RSI 41.17), CAVERTON (up 8.49%, RSI 47.50), OMATEK (up 6.56%, RSI 48.21), FIDSON (up 3.50%, RSI 55.48) — all show continued buying interest with moderate-to-positive RSI and no overbought signals, pointing to a healthy uptrend.
- Bearish Momentum: Notable breakdowns below 15DMA: JBERGER (-9.52%), UPL (-10.93%), CUSTODIAN (-2.33%). These stocks are experiencing selling pressure with RSI readings in the 51–55 zone — not oversold, so expect further downside risk if sellers persist.
Unusual Volume Focus
- FIRSTHOLDCO had volume over 2.5x its 90-day average with no price movement, suggesting large-scale accumulation/distribution.
- UPL (also top loser and YTD gainer) was heavily traded on its price fall — may point to forced liquidation or stop-loss cascade.
- FIDSON’s uptick in both price and volume adds conviction to its bullish momentum crossover.
- EUNISELL’s unusual volume and strong recent YTD outperformance warrant a watch for potential follow-through.
Contrarian Signals
- Stocks such as CUSTODIAN (YTD gainer, now top loser with RSI 53.3 and a bullish MACD) could mean a short-lived pullback with an eventual resumption of the uptrend.
- MANSARD is both a YTD gainer and a top daily loser, with mid-level RSI (52) and a positive MACD, suggesting a pause rather than a trend reversal.
- UPL, LEARNAFRCA, and CORNERST fit a similar pattern — their sharp daily drops on sustained bullish YTD momentum may attract contrarian traders looking for pullback entries.
Sector Heatmap (relative performance & technical trends)
| Sector | Momentum (15DMA/50DMA) | Key Technicals |
|---|---|---|
| Banking | ↗️ ZENITHBANK, FIDELITYBK strong vol | Volume leaders, institutional-heavy |
| Oil & Gas | ETERNA, CAVERTON bullish cross, OANDO bearish | High beta, mixed signals |
| Pharmaceuticals | FIDSON bullish, NEIMETH bearish breakdown | FIDSON unusual volume |
| Insurance | MANSARD, CORNERST negative spikes | Weak; profit-taking evident |
Dividend-Beta Matrix (Defensive Opportunity Spotting)
| Stock | DivYield | Beta | Implication |
|---|---|---|---|
| CAVERTON | 5.52% | 0.98 | Defensive, bullish crossover |
| FIDSON | 4.14% | 0.25 | Defensive, momentum, accumulation |
| MANSARD | 4.59% | 0.62 | Value+yield, but at risk short-term |
| CORNERST | 5.28% | 0.93 | Similar to MANSARD, on pullback watch |
- High-dividend, low-beta stocks showing up in momentum tables (CAVERTON, FIDSON) are prime candidates for defensive yield seekers, especially amid weak market breadth.
Institutional Clustering Alerts
- ZENITHBANK continues attracting heavy institutional flow, commanding a whopping 10.2% of institutional trade value with a trade count share of 0.72%. Institutional volume was over 18.3M units (over 4x retail participation). Watch for breakout or further accumulation.
- FIRSTHOLDCO and ARADEL also saw heavy institutional action. FIRSTHOLDCO's flat price despite massive volume hints at subtle "hand-off" between institutions.
Market Activity/Trades Analysis
- Institutional Investors: Accounted for 39.9% of trades but dominated 60.1% of total volume and a striking 84.1% of value. This points to institutions driving the market's big moves as Q3 window-dressing nears.
- Retail Investors: Higher count but lower value/volume — continuing a recent trend of retail "churn” while institutional players dictate the larger flows.
- Top Institutional Focus: ZENITHBANK, ARADEL, MTNN, FIRSTHOLDCO, ELLAHLAKES. Financials and energy remain ground zero for institutional volume, hinting at risk-on rotation and possible Q4 positioning.
- Top Retail Focus: STERLINGNG, MTNN, ZENITHBANK, ACCESSCORP, FIDELITYBK. Notice the cross-over in MTNN and ZENITHBANK, but value traded is far more significant on the institutional side.
- Patterns/Correlations: Stocks heavily bought by institutions (e.g., ZENITHBANK, FIRSTHOLDCO) also saw large volumes and price stability, while retail-heavy names (STERLINGNG) saw choppier price action.
Currency Market
- Naira weakened modestly by -0.04% to 1,491/$, in line with overall risk-off tone and possible end-of-quarter repatriations.
Trader Suggestions
- Consider accumulating CAVERTON or FIDSON for both yield and momentum, especially if market breadth rebounds.
- Contrarians could monitor sharp movers like UPL, MANSARD, LEARNAFRCA for short-term mean reversion.
- Institutions’ clustering in ZENITHBANK, FIRSTHOLDCO, ARADEL warrants a close watch. A breakout may follow if accumulation persists.
- Stay cautious in insurance; profit-taking and technical breakdowns suggest more pain near-term unless oversold conditions emerge.
- Monitor volumes closely: Unusual volume without price movement (FIRSTHOLDCO, GEREGU) can precede abrupt shifts. Unusual volume with sharp moves (FIDSON, UPL) suggests trend amplification.
Summary Chart: Retail vs Institutional Focus – Top 5 Traded Symbols
| Investor Type | Top Symbols | Sector(s) |
|---|---|---|
| Institutional | ZENITHBANK, ARADEL, MTNN, FIRSTHOLDCO, ELLAHLAKES | Banking, Oil & Gas, Telecom, Power, Agriculture |
| Retail | STERLINGNG, MTNN, ZENITHBANK, ACCESSCORP, FIDELITYBK | Banking, Telecom, Financials |
- Key insight: Institutional and retail overlap in MTNN and ZENITHBANK highlights broad interest, but retail activity is more fragmented across smaller-cap financials.
Key: Positive | Negative
While the index continues its upward grind with institutionals in the driver’s seat, weak breadth, falling turnover, and sharp profit-taking in prior big winners add a layer of caution. But for astute investors, rotating into overlooked dividend yielders showing fresh bullish momentum (like CAVERTON, FIDSON) might offer solid risk-adjusted opportunities. Stay alert for reversals in recent high-flyers and watch volume spikes for early trend shifts!
|
Top ASI Gainers Over Last 5 Trading Days
|
Top ASI Losers Over Last 5 Trading Days
|
For more detailed analysis, on InfoWARE Market Data Terminal <NSEPERF> <GO>
On InfoWARE Finance Mobile App (Android, iPhone & iPad, Windows Phone and Windows 8/10), "Top Gainers & Losers"
THOMAS WYATT NIG. PLC. (THOMASWY) topped the advancers list closing at N3.63 with a gain of 10.00% followed by SFS REAL ESTATE INVESTMENT TRUST (SFSREIT) which closed at N346.55 with a gain of 10.00%.
On the flip side MANSARD INSURANCE PLC (MANSARD) and UNIVERSITY PRESS PLC. (UPL) topped the decliners log with a loss of -10.00% at a close of N14.40, and -9.85% to close the day at N5.40 respectively.
| Symbol | LClose | %Chg |
|---|---|---|
| THOMASWY | 3.63 | 10.00 |
| SFSREIT | 346.55 | 10.00 |
| LIVINGTRUST | 5.66 | 9.90 |
| ETERNA | 30.65 | 9.86 |
| STANBICETF30 | 494.00 | 9.78 |
| Symbol | LClose | %Chg |
|---|---|---|
| MANSARD | 14.40 | -10.00 |
| UPL | 5.40 | -9.85 |
| LEARNAFRCA | 6.50 | -9.72 |
| JBERGER | 136.50 | -8.70 |
| CORNERST | 5.86 | -7.42 |
For more detailed analysis,
- On InfoWARE Market Data Terminal <TOPG> <GO>
- On InfoWARE Finance Mobile App ( Android, iPhone & iPad and Windows 10) , "Top Gainers & Losers"
Currency Market
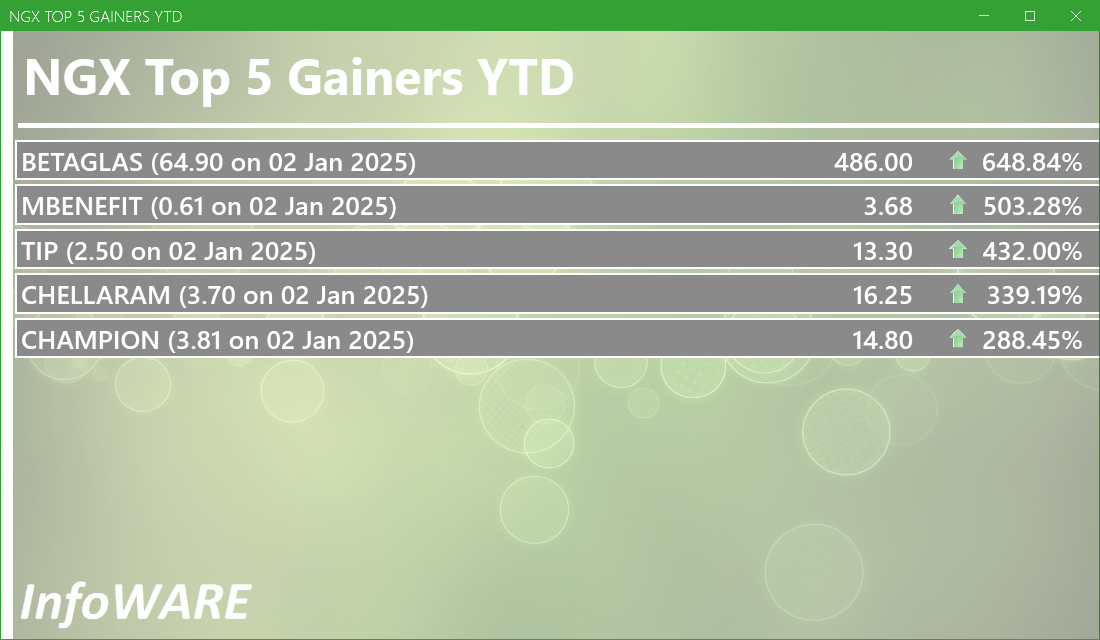
In the currency market, the Naira fell 0.04%(-0.64) against the Dollar to settle at 1 to 1Investment Insights - Top 5 Gainers YTD
These stocks are the best performers whose price has risen faster than the market as a whole with the best returns year to date. Momentum investors believe that stocks that have outperformed the market will often continue to do so because the factors that caused them to outperform will not suddenly disappear. In addition, other investors seeking to benefit from the stock’s outperformance will often purchase the stock, further bidding its price higher and pushing the stock higher still
For more detailed analysis,
- On InfoWARE Market Data Terminal <T5YTD2> <GO>
- On InfoWARE Finance Mobile App ( Android , iPhone & iPad and Windows 10) , "Research"
NSE: Bull Signal - Price crossed above 15 Day MA
This signal implies these stocks are under buying pressure and the price might continue to rise and therefore positions should be monitored closely. Further suggested analysis include looking at the overall market (ASI) to see if the uptrend is market wide, sector wide or specific to the stock. Portfolio managers tend to use this as a signal to do more research to add to their positions or lock in some profits. Typically further analysis should be done using commands like PC and RV on the InfoWARE Market Data Terminal. Another command is ALERTS to set price triggers for possible exit or entry as necessary
For more detailed analysis,
- On InfoWARE Market Data Terminal <NSEPERF> <GO>
- On InfoWARE Finance Mobile App ( Android , iPhone & iPad and Windows 10) , "Top Gainers & Losers"
| Symbol | Price | %Chg | 15DMA | PE | EPS | DivY | MktCap | Vol | Trades | Value | LstTradeTime |
|---|---|---|---|---|---|---|---|---|---|---|---|
| ETERNA | 30.65 | 8.97 | 30.56 | 29.51 | 0.75 | 0.68 | 39.97B | 399.57K | 57.00 | 12.25M | 29-Sep-2025 15:03:38.860 |
| CAVERTON | 6.83 | 8.49 | 6.69 | 1.15 | 1.57 | 5.52 | 22.88B | 3.15M | 182.00 | 21.38M | 29-Sep-2025 15:03:39.667 |
| OMATEK | 1.22 | 6.56 | 1.18 | 6.82 | 0.10 | 0.00 | 3.59B | 7.86M | 156.00 | 9.67M | 29-Sep-2025 15:03:39.637 |
| FIDSON | 42.90 | 3.50 | 42.78 | 22.54 | 0.64 | 4.14 | 98.46B | 1.73M | 281.00 | 69.90M | 29-Sep-2025 15:03:39.870 |
NSE: BEAR Signal - Price crossed below 15 Day MA
This signal implies these stocks are under selling pressure and the price might continue to slide and therefore positions should be monitored closely. Further suggested analysis include looking at the overall market (ASI) to see if the downtrend is market wide, sector wide or specific to the stock. If the overal market trend is upwards, then since these stocks are heading in the opposite direction, then further analysis should be done using commands like PC and RV on the InfoWARE Market Data Terminal. Another command is ALERTS to set price triggers for possible exit is necessar
For more detailed analysis,
- On InfoWARE Market Data Terminal <BEARM> <GO>
- On InfoWARE Finance Mobile App ( Android , iPhone & iPad and Windows 10)
| Symbol | Price | %Chg | 15DMA | PE | EPS | DivY | MktCap | Vol | Trades | Value | LstTradeTime |
|---|---|---|---|---|---|---|---|---|---|---|---|
| NGXPREMIUM | 13,715.02 | -0.13 | 13,728.58 | 2,048.74 | 238.70 | 0.00 | 0.00 | 99.44M | 6,899.00 | 5.42B | 29-Sep-2025 15:03:47.933 |
| NGXOILGAS | 2,433.95 | -0.51 | 2,435.10 | 8.74 | 228.15 | 0.00 | 0.00 | 8.39M | 1,726.00 | 1.77B | 29-Sep-2025 15:03:48.087 |
| MCNICHOLS | 3.60 | -1.11 | 3.63 | 26.80 | 0.05 | 5.88 | 2.59B | 691.14K | 54.00 | 2.45M | 29-Sep-2025 15:03:41.867 |
| CUSTODIAN | 43.00 | -2.33 | 43.80 | 3.80 | 3.29 | 1.20 | 252.92B | 748.79K | 184.00 | 33.12M | 29-Sep-2025 15:03:38.913 |
| ROYALEX | 2.18 | -3.21 | 2.19 | 0.00 | 0.00 | 7.81 | 11.22B | 2.77M | 134.00 | 6.02M | 29-Sep-2025 15:03:37.810 |
| NEIMETH | 6.00 | -3.33 | 6.15 | 125.52 | 0.02 | 3.38 | 25.64B | 1.60M | 104.00 | 9.85M | 29-Sep-2025 15:03:39.757 |
| CADBURY | 63.00 | -4.21 | 65.38 | 33.25 | 0.64 | 1.88 | 118.33B | 786.24K | 184.00 | 50.15M | 29-Sep-2025 15:03:37.800 |
| FTNCOCOA | 5.70 | -4.56 | 5.83 | 0.00 | 0.00 | 1.60 | 22.23B | 1.88M | 182.00 | 10.75M | 29-Sep-2025 15:03:39.323 |
| VSPBONDETF | 203.00 | -4.93 | 207.08 | 0.00 | 0.00 | 9.31K | 9.00 | 1.89M | 29-Sep-2025 15:03:37.467 | ||
| NEWGOLD | 51,200.00 | -5.47 | 53,381.36 | 0.00 | 0.00 | 0.00 | 0.00 | 1.00 | 1.00 | 51.20K | 29-Sep-2025 15:03:37.713 |
| OANDO | 46.00 | -6.52 | 47.35 | 24.10 | 2.53 | 1.15 | 571.85B | 5.50M | 743.00 | 248.47M | 29-Sep-2025 15:03:39.450 |
| JBERGER | 136.50 | -9.52 | 145.69 | 16.73 | 10.31 | 1.74 | 218.40B | 370.44K | 164.00 | 50.72M | 29-Sep-2025 15:03:39.273 |
| UPL | 5.40 | -10.93 | 5.95 | 7.13 | 0.59 | 0.60 | 2.33B | 2.50M | 38.00 | 13.54M | 29-Sep-2025 15:03:37.837 |
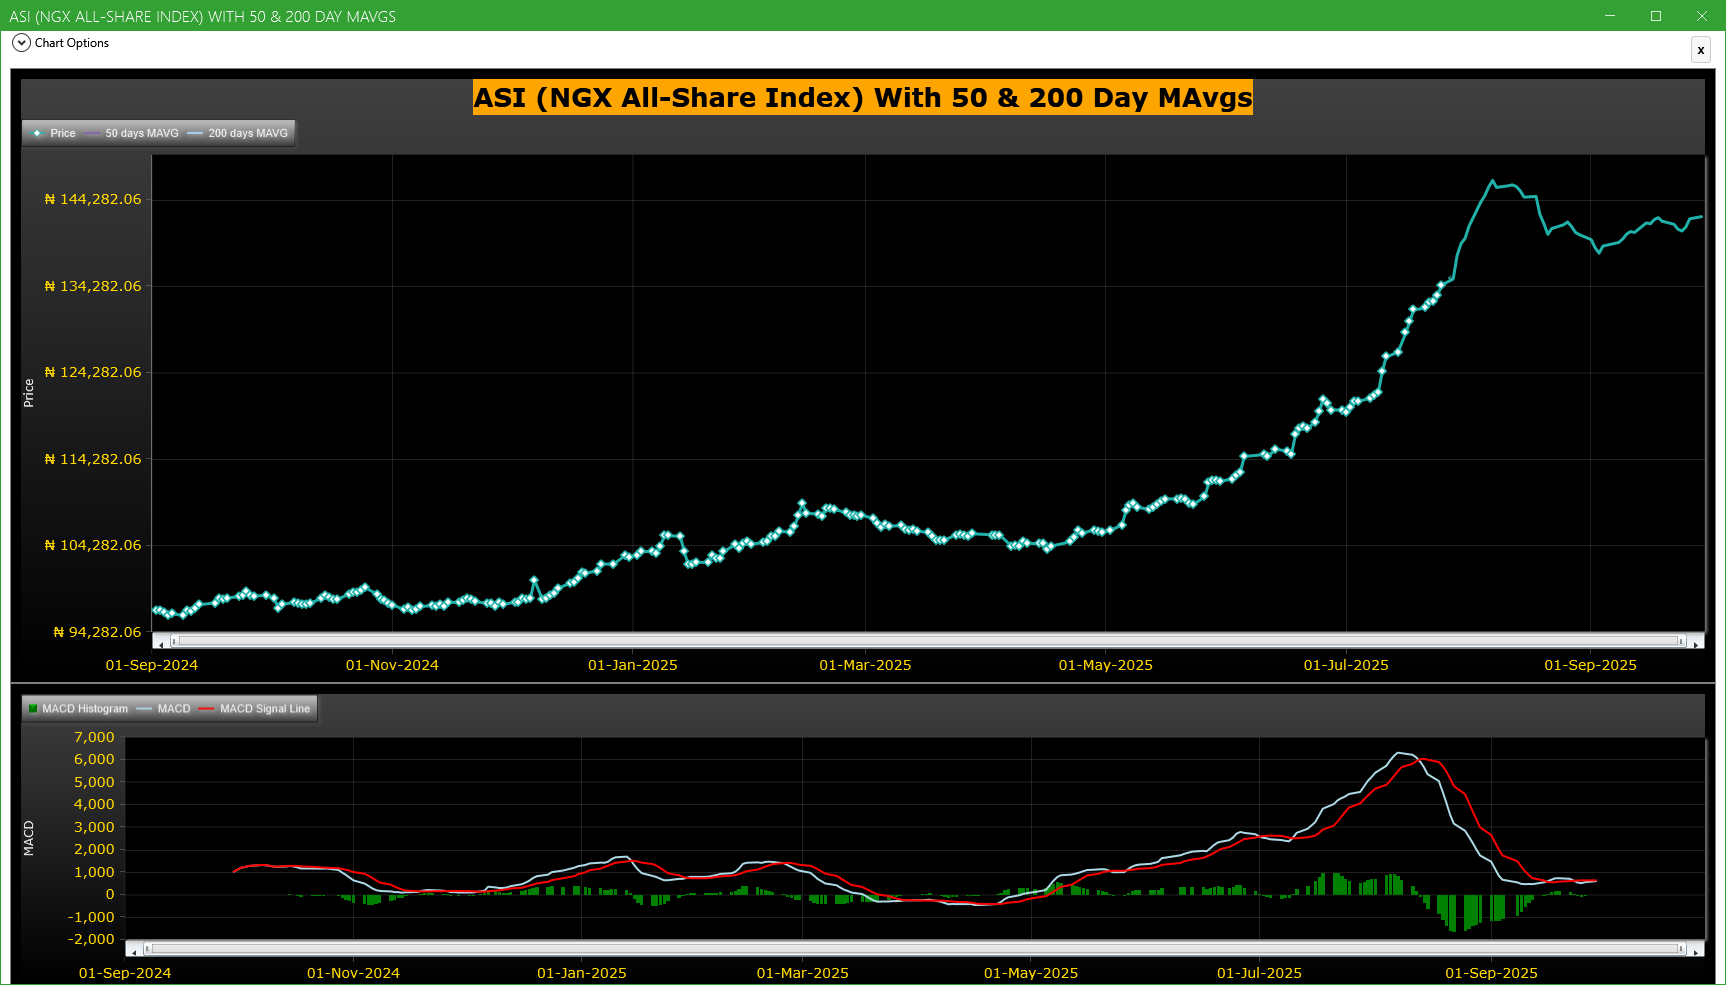
Market Trend - ASI (NGX All-Share-Index) With 50 & 200 Day MAvgs Chart
Technical traders typically use the 50 & 200 day moving averages to aid in choosing
where to enter or exit a position, which then causes these levels to act as strong
support or resistance. As a general guideline, if the price is above a moving average,
the trend is up. If the price is below a moving average, the trend is down.
It is important to note that critics of technical analysis say that moving averages act
as support and resistance because so many traders use these indicators to inform their
trading decisions. Also moving averages tend to work quite well in strong trending conditions
but poorly in choppy or ranging conditions.
Trading Strategies: Crossovers
Crossovers are one of the main moving average strategies. The first type is a price crossover,
which is when the price crosses above or below a moving average to signal a potential change
in trend. Another strategy is to apply two moving averages to a chart: one longer and one
shorter. When the shorter-term MA crosses above the longer-term MA, it is a buy signal, as
it indicates that the trend is shifting up. This is known as a golden cross. Meanwhile, when
the shorter-term MA crosses below the longer-term MA, it is a sell signal, as it indicates that
the trend is shifting down. This is known as a dead/death cross
For more detailed analysis,
- On InfoWARE Market Data Terminal <CI> <GO>
- On InfoWARE Finance Mobile App ( Android , iPhone & iPad and Windows 10) , "Research"
Unusual Volume: Volume traded is more than double the 90 day moving average (All exchanges; ASI & ASem). For more detailed analysis,
- On InfoWARE Market Data Terminal <UV> <GO>
- On InfoWARE Finance Mobile App ( Android , iPhone & iPad and Windows 10)
| Symbol | Name | Volume | 90DAvgVol | %VolChg | Price | LClose | %Chg | Trades | Value |
|---|---|---|---|---|---|---|---|---|---|
| FIRSTHOLDCO | FIRST HOLDCO PLC | 47.49M | 17.74M | 167.72 | 31.00 | 31.00 | 0.00 | 426 | 1.47B |
| UPL | UNIVERSITY PRESS PLC. | 2.50M | 930.74K | 168.84 | 5.40 | 5.99 | -9.85 | 38 | 13.54M |
| FIDSON | FIDSON HEALTHCARE PLC | 1.73M | 797.54K | 116.39 | 42.90 | 41.40 | 3.62 | 281 | 69.90M |
| GEREGU | GEREGU Power PLC | 702.63K | 206.94K | 239.53 | 1,141.50 | 1,141.50 | 0.00 | 87 | 721.88M |
| EUNISELL | EUNISELL INTERLINKED PLC | 646.94K | 210.50K | 207.33 | 36.00 | 33.60 | 7.14 | 89 | 23.12M |
Investment Insights - High Div. Stocks
Dividend stocks distribute a portion of the company earnings to investors on a regular basis and they can a great choice for investors looking for regular income. As an investment or trading strategy, high dividend yield equities provide annual cash payments as against mostly capital gains in the price of a stock. The list in the table below represent the highest dividend paying stocks from the list of the most liquid stocks in the NSE top 30.
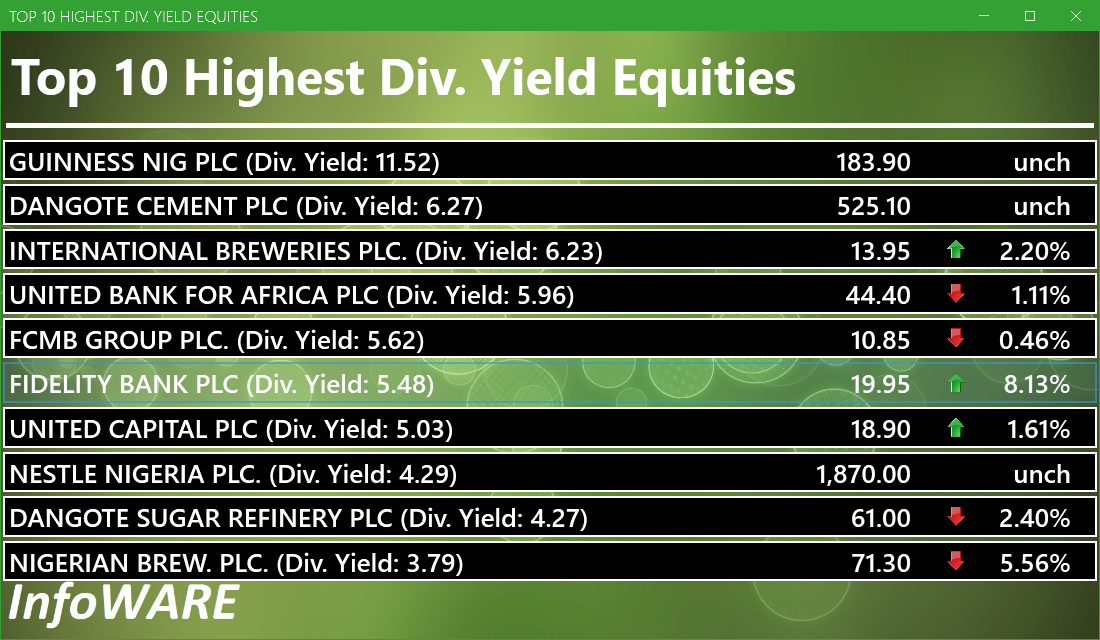
For more detailed analysis,
- On InfoWARE Market Data Terminal <HYIELD> <GO>
- On InfoWARE Finance Mobile App ( Android , iPhone & iPad and Windows 10) , "Research"
Investment Insights - Stocks outperforming the ASI but with approximately the same risk
These list of stocks represent equities that are less risky than the ASI but doing better than the ASI (All Shares Index) using the YTD (Year to Date) returns as the measure. The risk is measured by Beta. Beta is an assessment of a stock's tendency to undergo price changes, (its volatility), as well as its potential returns compared to the ASI. It is expressed as a ratio, where a score of 1 represents performance comparable to the ASI, and returns above or below the market may receive scores greater or lower than 1.
For a full list of both positively and negatively corelated stocks visit InfoWARE Market Data Terminal
- On InfoWARE Market Data Terminal <BANL> <GO>
- On InfoWARE Finance Mobile App ( Android , iPhone & iPad and Windows 10)
| Symbol | DivYield | PE | EPS | Beta | %ChgYTD | ASIYTDReturn | BetaDiff |
|---|---|---|---|---|---|---|---|
| HONYFLOUR | 1.40 | 16.28 | 0.31 | 0.99 | 217.92 | 37.99 | 0.01 |
| CAVERTON | 5.52 | 1.15 | 1.57 | 0.98 | 167.84 | 37.99 | 0.02 |
| ROYALEX | 7.81 | 0.00 | 0.00 | 0.96 | 98.18 | 37.99 | 0.04 |
| CORNERST | 5.28 | 8.62 | 0.35 | 0.93 | 47.98 | 37.99 | 0.07 |
| UNIVINSURE | 0.00 | 0.00 | 0.00 | 0.83 | 58.33 | 37.99 | 0.17 |
| FTNCOCOA | 1.60 | 0.00 | 0.00 | 0.79 | 203.19 | 37.99 | 0.21 |
| NB | 3.79 | 16.95 | 1.60 | 0.79 | 122.81 | 37.99 | 0.21 |
| MAYBAKER | 3.75 | 58.94 | 0.14 | 0.78 | 72.34 | 37.99 | 0.22 |
| UNILEVER | 2.81 | 67.09 | 0.40 | 0.75 | 102.78 | 37.99 | 0.25 |
| VETGOODS | 0.00 | 0.71 | 104.65 | 37.99 | 0.29 |
African Markets
| Name | LClose | Change | %Chg |
|---|---|---|---|
| BRVM Stock Exchange | 324.71 | -0.46 | -0.14 |
| Botswana Stock Exchange | 10,610.53 | 0.00 | 0.00 |
| Egyptian Exchange | 35,671.43 | -276.80 | -0.77 |
| Ghana Stock Exchange | 8,120.00 | 73.23 | 0.91 |
| Johannesburg Stock Exchange | 106,700.13 | 899.31 | 0.85 |
| Lusaka Stock Exchange | 25,183.74 | 97.84 | 0.39 |
| Casablanca Stock Exchange | 19,342.98 | -87.44 | -0.45 |
| Malawi Stock Exchange | 578,342.42 | 0.00 | 0.00 |
| Nigeria Stock Exchange | 142,133.02 | 974.00 | 0.69 |
| Nairobi Securities Exchange | 177.89 | 0.09 | 0.05 |
| Namibian Stock Exchange | 1,903.04 | -1.71 | -0.09 |
| Rwanda Stock Exchange | 179.31 | 0.00 | 0.00 |
| Tunis Stock Exchange | 12,417.07 | 6.21 | 0.05 |
| Uganda Securities Exchange | 1,460.36 | -1.46 | -0.10 |
Nigeria Market Indexes
| Symbol | LClose | %Chg | WTD% | MTD% | QTD% | YTD% | MktCap | Trades |
|---|---|---|---|---|---|---|---|---|
| ASI | 142,377.54 | 0.17 | 0.00 | 1.90 | 18.90 | 37.99 | 27,972 | |
| NGX30 | 5,193.07 | 0.26 | 0.00 | 1.89 | 9.94 | 36.13 | 15,728 | |
| NGXAFRBVI | 3,549.95 | -0.07 | 0.00 | 1.85 | 0.18 | 43.10 | 5,269 | |
| NGXAFRHDYI | 22,292.18 | -1.34 | 0.00 | -1.06 | 6.59 | 30.92 | 6,639 | |
| NGXASEM | 1,538.10 | 0.00 | 0.00 | 0.00 | -3.57 | -2.88 | 6 | |
| NGXBNK | 1,516.20 | 0.47 | 0.00 | 0.31 | 0.36 | 39.43 | 7,920 | |
| NGXCG | 4,033.85 | 0.03 | 0.00 | -0.02 | 17.31 | 42.58 | 13,772 | |
| NGXCNSMRGDS | 3,377.17 | -0.58 | 0.00 | 5.88 | -2.64 | 94.72 | 3,360 | |
| NGXCOMMDTY | 1,101.95 | 0.00 | 0.00 | 3.17 | 5.22 | 10.19 | 1,681 | |
| NGXGROWTH | 14,772.50 | 1.63 | 0.00 | 31.90 | 55.35 | 90.30 | 385 | |
| NGXINDUSTR | 5,074.05 | 1.59 | 0.00 | 2.87 | 44.03 | 42.07 | 2,087 | |
| NGXINS | 1,195.24 | -3.43 | 0.00 | -6.84 | 61.83 | 52.03 | 1,863 | |
| NGXLOTUSISLM | 11,732.96 | 0.02 | 0.00 | 2.75 | 22.54 | 68.39 | 5,201 | |
| NGXMAINBOARD | 6,993.56 | 0.31 | 0.00 | 3.04 | 18.56 | 39.76 | 20,150 | |
| NGXMERIGRW | 9,904.06 | 0.25 | 0.00 | -1.10 | 2.61 | 51.83 | 3,513 | |
| NGXMERIVAL | 13,498.58 | -0.71 | 0.00 | 0.96 | 12.98 | 29.42 | 6,003 | |
| NGXOILGAS | 2,433.95 | -0.51 | 0.00 | 2.67 | 1.75 | -10.22 | 1,726 | |
| NGXPENBRD | 2,637.35 | 0.19 | 0.00 | 1.82 | 14.70 | 43.99 | 22,567 | |
| NGXPENSION | 6,672.88 | -0.07 | 0.00 | 0.80 | 5.01 | 47.17 | 17,442 | |
| NGXPREMIUM | 13,715.02 | -0.13 | 0.00 | -0.34 | 19.57 | 40.91 | 6,899 | |
| NGXSOVBND | 657.27 | 0.00 | 0.00 | -0.24 | 0.58 | 9.26 | 0 |
For more detailed analysis,
- On InfoWARE Market Data Terminal <MKTINS> <GO>
- On InfoWARE Finance Mobile App ( Android, iPhone & iPad and Windows 10) , "Market Indexes"
Find the topic interesting? Will like to comment? Contact Us at solutions@infowarelimited.com
Top News

Chart Of The Day - ASI Chart Vs ASI Advance Decline Line (YTD) (02-Oct-2025 15:10:29.073)
InfoWARE AI Analyst Daily Market Report: 02-Oct-2025

[XNSA]>> RESIGNATION OF A DIRECTOR
[VETBANK]>> DAILY INDICATIVE PRICES
[VETBANK]>> DAILY INDICATIVE PRICES
[XNSA]>> LIFTING OF SUSPENSION OF INTERNATIONAL ENERGY INSURANCE PLC
[XNSA]>> APPOINTMENT OF A DIRECTOR
[XNSA]>> OFF MARKET TRADE
[XNSA]>> NGX FIXED INCOME INDICATIVE PRICE LIST FOR OCT 02, 2025
[XNSA]>> EXECUTIVE CAPACITY DEVELOPMENT COURSE ON NIGERIA CAPITAL MARKET
[XNSA]>> UPDATED- SAVE THE DATE: 29TH ANNUAL STOCKBROKERS CONFERENCE
[XNSA]>> AELP CAPACITY BUILDING & ASSDA FORUM
[SIAMLETF40]>> DAILY INDICATIVE PRICES
InfoWARE AI Analyst Daily Market Report: 30-Sep-2025
Chart Of The Day - ASI Chart Vs ASI Advance Decline Line (YTD) (30-Sep-2025 15:06:58.117)
InfoWARE AI Analyst Daily Market Report: 30-Sep-2025
[XNSA]>> DAILY FUND PRICE SUBMISSION - FCMB ASSET MANAGEMENT LIMITED
[XNSA]>> PUBLIC HOLIDAY
[VSPBONDETF]>> DAILY INDICATIVE PRICES
[XNSA]>> EXECUTIVE CAPACITY DEVELOPMENT COURSE ON NIGERIA CAPITAL MARKET
[XNSA]>> NGX FIXED INCOME INDICATIVE PRICE LIST FOR SEP 30, 2025
[XNSA]>> CORDROS MILESTONE FUNDS' BID & OFFER PRICES
[LOTUSHAL15]>> DAILY INDICATIVE PRICES
[XNSA]>> LISTING OF 14,143,244,747 ORDINARY SHARES OF WEMA BANK PLC
[XNSA]>> UPDATED- SAVE THE DATE: 29TH ANNUAL STOCKBROKERS CONFERENCE
[XNSA]>> AELP CAPACITY BUILDING & ASSDA FORUM
[SIAMLETF40]>> DAILY INDICATIVE PRICES
Chart Of The Day - ASI Chart Vs ASI Advance Decline Line (YTD) (29-Sep-2025 15:09:38.971)
InfoWARE AI Analyst Daily Market Report: 29-Sep-2025
[LOTUSHAL15]>> DAILY INDICATIVE PRICES
Get IDIA - the stock trading app for the modern investor
Solutions by Business
Product Suites
Company
Contacts
- 8th Floor,
- South Atlantic Petroleum Towers,
- 1 Adeola Odeku Street,
- Victoria Island,
- Lagos, Nigeria.
- Email: solutions@infowarelimited.com
Follow Us
 |
 |
 |
 |