


InfoWARE AI Analyst Daily Market Report: 30-Sep-2025 | InfoWARE Finance
Get IDIA - the stock trading app for the modern investor


InfoWARE AI Analyst Daily Market Report: 30-Sep-2025
(Source: InfoWARE Terminal, Date: 30-Sep-2025)
Dear Investor,
NGX Daily Market Summary – Tuesday, September 30, 2025
The NGX All Share Index (ASI) ended the day modestly higher, closing at 142,377.56, up 0.23%, building the year-to-date return to a robust 38.31%. The session saw a pronounced surge in both trading volume (1.21B shares; previous day: 383.91M) and market turnover (₦28.26B; previous: ₦11.61B, up 143.48%), signposting a flush of institutional activity. Despite the positive close, market breadth was negative (0.89x), with 31 advancers versus 35 decliners, reflecting underlying rotation and selective bullishness. Most of today’s trading was institutional-driven, with several stocks recording unusual volumes, and notable price action in the likes of UPDC (top gainer) and ENAMELWA (top loser). Below, we unpack sector moves, top gainers/losers, technical momentum, and hidden signals for traders and investors.
Market Breadth & Significant Trends
- Negative Breadth, Positive Index: The ASI advanced 0.23% despite more decliners (35) than advancers (31), indicating rallies concentrated in heavyweight or high-liquidity stocks.
- Volume & Turnover Spike: Institutional orders dominated, accounting for 93.85% of trade value and 88.70% of volume, suggesting portfolio reallocations or block trades underpinning the rise.
- 64 stocks saw volume gains versus 76 with lower volume, pointing to selective accumulation/distribution.
- Unusual Volume Surprises: FIDELITYBK dramatically outperformed (volume 2328% over 90-day average), signaling either institutional entry or a possible re-rating underway.
Top 5 Gainers & Losers – 1 Day
| Top 5 Gainers | |||||||
|---|---|---|---|---|---|---|---|
| Stock | Close (₦) | % Change | RSI | MACD | 15DMA/50DMA Sparkline | Beta | PE |
| UPDC | 6.61 | 9.98% | 50.6 | 0.039 | 6.01/6.23 | 1.10 | 0 |
| ENAMELWA | 38.60 | 9.97% | 52.0 | 0.71 | 35.33/33.59 | 0.00 | 27.1 |
| ETERNA | 33.70 | 9.95% | 47.3 | -1.57 | 30.74/35.95 | 1.34 | 29.5 |
| ARADEL | 615.00 | 9.82% | 53.8 | 18.23 | 563.81/529.3 | 6.33 | 0.0 |
| TIP | 14.60 | 9.77% | 55.7 | 0.25 | 12.47/12.95 | 0.0 | n/a |
| Top 5 Losers | |||||||
| Stock | Close (₦) | % Change | RSI | MACD | 15DMA/50DMA Sparkline | Beta | PE |
| UNIONDICON | 8.10 | -10.00% | 45.4 | -0.26 | 9.51/10.16 | -0.02 | 0 |
| STANBICETF30 | 450.00 | -8.91% | 59.0 | 8.63 | 423.3/448.8 | -0.23 | n/a |
| CHAMPION | 13.75 | -7.09% | 47.4 | -0.09 | 15.72/15.69 | 0.16 | 412.8 |
| ROYALEX | 2.05 | -5.96% | 51.9 | 0.06 | 2.18/2.08 | 0.96 | 0 |
| WEMABANK | 17.0 | -5.56% | 43.0 | -0.68 | 20.13/21.61 | 1.25 | 216.9 |
Key Insights & Patterns
- Turnover Surge Implications: The massive jump in turnover (+143.48%) is institution-driven. Institutions snapped up names like FIDELITYBK, ZENITHBANK, and ARADEL, which also showed strong volume metrics and bullish technical crosses. This can foreshadow sustained accumulation and further price upside in these names, attractive for momentum and swing traders.
- Advancers vs Decliners: Despite green index print, negative breadth implies gains are narrowly distributed; traders should avoid generalized bullishness and focus on leaders.
-
Stocks with Unusual Volumes:
- FIDELITYBK: Volume up over 2,328% vs 90D avg, price up 5%. Both MACD and Moving Average crosses show strong bullish momentum with institutional buying fingerprints.
- NCR: Over 121,740% of 90D average, up 5.26% – likely a technical or fundamental event, warrants further investigation.
- EUNISELL: Up 137.91% on volume, with price up 9.72%, present in YTD gainers (104.98% YTD).
-
Year-to-Date (YTD) Top Gainers:
Stock Price %ChgYTD RSI MACD DivY PE THOMASWY 3.63 108.95% 61.65 0.0598 1.05 0 EUNISELL 36.00 104.98% 70.31 2.80 0.31 0 LIVINGTRUST 5.66 39.04% 60.85 0.129 1.67 35.77 TIP 13.30 484% 55.71 0.25 0 n/a ETERNA 30.65 38.68% 47.27 -1.57 0.68 29.5 -
Year-to-Date Top Losers:
Stock Price %ChgYTD RSI MACD DivY PE CUSTODIAN 43.00 138.60% 51.83 2.27 1.20 3.80 UNIONDICON 9.00 12.50% 45.45 -0.26 6.25 0 MANSARD 14.40 59.65% 45.88 0.22 4.59 31.16 UPL 5.40 40.26% 45.55 0.05 0.59 7.12 CHAMPION 14.80 260.89% 47.37 -0.09 0.41 412.8 - Bullish Momentum Stocks (price above 15DMA): TRANSCORP, FIDELITYBK, and VITAFOAM, among others, have all triggered bullish crossovers—helpful for short-term traders.
- Bearish Momentum Stocks (price < 15DMA): WAPCO, ETI, and ETRANZACT signal caution – price breakdown below support, possibly further sell-offs.
- Stocks with RSI above 70: EUNISELL (70.3) flags overbought – riding high on momentum but may be due for consolidation soon.
- Overlap Alert: EUNISELL and ETERNA feature both as current gainers and in YTD top performers – signals momentum names still attracting strong interest. FIDELITYBK also notable for institutional rotation across technical and fundamental screens.
- Stocks with High Dividend Yield & Active: VITAFOAM yields 7.03%, presents bullish technicals and unusual volume—a blend of income and near-term price appreciation potential.
Contrarian Signals (Conflicting Indicators)
- CHAMPION: Despite a lackluster -9.8% YTD and a drop today, MACD is flirting with bullish values (slightly negative), and RSI is neutral (47.4), indicating possible basing rather than further collapse. Opportunity for nimble reversal traders.
- STANBICETF30: Large negative move but RSI is a strong 59 and MACD is positive (8.63)—bullish divergence amid severe decline.
- FIDELITYBK: RSI at 49.2 (neutral, but after a big run), MACD slightly negative, but enormous volume and bullish crossover above 15DMA—possible short-term overbought but longer-term upside.
Sector Heatmaps (Performance & Technical Trends)
| Sector | Top Movers & Technicals | Retail Vs Institutional Activity | Momentum |
|---|---|---|---|
| Banking |
Up: FIDELITYBK (+5.26%), ZENITHBANK, UBA Down: GTCO (-0.1%), WEMABANK (-5.56%) |
FIDELITYBK: 831 Inst. trades, high value; ZENITHBANK: 1.43% Inst. trade count, 11.1% Inst. value share. | Bullish crossovers: FIDELITYBK, TRANSCORP. Watch out: UBA, GTCO falling. |
| Integrated Oil & Gas | ARADEL (Inst. driven surge, Top 5 gainer, bullish MACD 18.23) | ARADEL: 0.46% Inst. trades, 2.8% Inst. volume; large value given high nominal price/share | Strong bullish technicals; MACD, price above 15DMA & 50DMA |
| Insurance | CONHALLPLC (Above 15DMA, bullish setup, low PE, small div yield) | Less institutional flow, but steadily rising volumes | Bullish: Above 15DMA, low Beta |
| IT Services | NCR (Huge volume spike, +5.26%, technical event likely) | Volatility suggests possible news; volume driven by possible block trades | Watch for follow-through. |
| Household Durables | VITAFOAM: High yield 7.03%, above 15DMA, major volume | Moderate institutional, strong retail flow | Bullish with defensive positioning |
Dividend-Beta Matrix (Defensive Opportunities)
| Stock | Div. Yield (%) | Beta | Technical Outlook |
|---|---|---|---|
| VITAFOAM | 7.03 | 0.47 | Bullish momentum, above 15DMA, low risk, income + price appreciation |
| FIDELITYBK | 5.48 | 0.89 | Bullish, longstanding institutional buyer interest |
| CONHALLPLC | 2.08 | 0.96 | Bullish, but watch valuation (PE 69.63) |
Institutional Clustering Alerts
- ZENITHBANK: Institutional trades account for 20.17% of total market value by institutions—a clear signal of accumulation. Blocks like these often precede sustained moves in blue chips.
- FIDELITYBK: ~80% institutional volume (790M shares), with price above 15DMA and bullish momentum, is a clear sign of rotational buying.
- ARADEL: Despite modest trade count, high Institutional value—signals big money presence; watch for follow-through volume.
High Dividend Names with Bullish/Bearish Flags
- VITAFOAM: High dividend, bullish technicals, above 15DMA, attractive for defensive investors and swing traders.
- FIDELITYBK: High yield (5.48%), strong momentum, but may warrant caution for short-termers after today's explosive move.
- CONHALLPLC: Decent yield (2.08%), but high PE (69.63x)—momentum could trump value short-term.
- Banks: UBA and ZENITHBANK: Under accumulation, though ZENITHBANK had slight price dip today.
Trader Suggestions (Opportunities & Cautions)
- Ride the Flow: FIDELITYBK and ARADEL: Both under major institutional accumulation, solid technicals – momentum swing positions can be established, but trail stops after outsized up-moves.
- PSI for Defensive Portfolios: VITAFOAM – High yield, strong momentum, moderate beta makes it appealing as a defensive core holding.
- Cautious on Overextended: EUNISELL (RSI 70.3, >100% YTD): Due for mean-reversion or volatility spike shortly.
- Rotation Plays: Focus on sectors with lagging breadth but strong institutional prints (Banking, Oil & Gas), but avoid those breaking under 15DMA or where technicals are softening (ETI, WAPCO).
- Bullish Breakouts: TRANSCORP and CONHALLPLC, both above 15DMA, moderate betas—potential for momentum chases.
- Short-Term Contrarians: Consider CHAMPION or STANBICETF30 for possible snapback after recent sharp drops, especially if volume spikes materialize.
Top 5 YTD Gainers & Losers (Tuesday Special)
| YTD Gainers | |||||
|---|---|---|---|---|---|
| Stock | Price | %ChgYTD | RSI | MACD | DivY |
| TIP | 13.30 | 484% | 55.71 | 0.25 | 0.0 |
| CUSTODIAN | 43.00 | 138.60% | 51.83 | 2.27 | 1.2 |
| UNIONDICON | 9.00 | 12.50% | 45.45 | -0.26 | 6.25 |
| MANSARD | 14.40 | 59.65% | 45.88 | 0.22 | 4.59 |
| UPL | 5.40 | 40.26% | 45.55 | 0.05 | 0.59 |
| YTD Losers | |||||
|---|---|---|---|---|---|
| Stock | Price | %ChgYTD | RSI | MACD | DivY |
| WEMABANK | 18.00 | 86.81% | 42.99 | -0.68 | 5.81 |
| AIICO | 3.65 | 122.93% | 48.35 | 0.09 | 4.13 |
| VETBANK | 14.00 | 25.69% | 46.17 | -0.0021 | 0.0 |
Market Activity & Trade Summary Analysis
-
Retail vs. Institutional:
- Institutional: 1,900 trades (36.8% of total count), but 88.7% of volume and 93.9% of gross value—a classic sign of large-block, high-conviction trades.
- Retail: 26,142 trades (63.2% of trades) but only 11.3% of volume. Suggests retail is firmly in smaller tickets—great liquidity for institutions looking to accumulate.
-
Top Institutional Traded Stocks:
- FIDELITYBK – 81 Inst. trades, 790.6M volume, ₦15.88B value (institutional accumulation signal!)
- ZENITHBANK – 400 Inst. trades, 47.8M volume, ₦3.3B value
- ARADEL – 130 Inst. trades, 1.4M volume, ₦835.7M value
- UBA – 110 Inst. trades, 15M volume, ₦652.7M value
- ACCESSCORP – 74 Inst. trades, 7.3M volume, ₦186.9M value
-
Top Retail Traded Stocks:
- STERLINGNG – 2,193 trades, 14.1M volume, ₦110.3M value
- MTNN – 1,287 trades, 155K volume, ₦65.6M value
- ZENITHBANK – 1,267 trades, 1.6M volume, ₦110.5M value
- UBA – 1,127 trades, 2.3M volume, ₦101.7M value
- GTCO – 1,029 trades, 687K volume, ₦64.4M value
- Institutions favor FIDELITYBK and ZENITHBANK (banks with good liquidity and earnings) while retail continues to churn STERLINGNG, UBA, and MTNN (popular but less pronounced in institutional moves).
- Correlation/Patterns: The convergence of unusual institutional activity in FIDELITYBK with its technical breakouts and price quality suggests institutional "smart money” is betting on earnings/valuation catalysts. Watch ARADEL, ZENITHBANK, FIDELITYBK for sustained moves.
- For retail investors: Banks remain liquid and actively traded, offering tactical short-term opportunities—trend with strong institutions or position opposite (contrarian, for mean-reversion plays).
Hidden Insights & Takeaways
- Institutions are dictating trend; follow their flow for momentum.
- Gainers are concentrated in few stocks and sectors; breadth is weak—time for selectivity, not index-wide bullishness.
- FIDELITYBK, VITAFOAM, and ARADEL are today’s "three to watch” – showing technical, fundamental, and flow strength.
- Yield plus technical strength is rare—ride VITAFOAM if you seek both.
- Be wary of hyped names with overextended RSI or massive short-term moves; consider trailing stops.
- Bearish momentum (WAPCO, ETI): Avoid new longs.
Opportunities & Cautions (Summary Tips)
- Stay with strength—FIDELITYBK and ARADEL for momentum. Rotate to VITAFOAM for defense/income plus upside.
- Institutions are clearly interested in banks; retail should either ride coattails or go contrarian with strict risk.
- Banks and select oil names are seeing both fundamental and flow support.
- Apply caution on names with exhausted RSI (EUNISELL). Trailing stops, not new buys, on such overextended names.
- For short-term traders: CHAMPION, STANBICETF30 offer reversal trades on snapback potential, but high risk, high reward.
|
Top ASI Gainers Over Last 5 Trading Days
|
Top ASI Losers Over Last 5 Trading Days
|
For more detailed analysis, on InfoWARE Market Data Terminal <NSEPERF> <GO>
On InfoWARE Finance Mobile App (Android, iPhone & iPad, Windows Phone and Windows 8/10), "Top Gainers & Losers"
UPDC PLC (UPDC) topped the advancers list closing at N6.61 with a gain of 9.98% followed by NIGERIAN ENAMELWARE PLC. (ENAMELWA) which closed at N38.60 with a gain of 9.97%.
On the flip side UNION DICON SALT PLC. (UNIONDICON) and STANBIC IBTC ETF 30 (STANBICETF30) topped the decliners log with a loss of -10.00% at a close of N8.10, and -8.91% to close the day at N450.00 respectively.
| Symbol | LClose | %Chg |
|---|---|---|
| UPDC | 6.61 | 9.98 |
| ENAMELWA | 38.60 | 9.97 |
| ETERNA | 33.70 | 9.95 |
| ARADEL | 615.00 | 9.82 |
| TIP | 14.60 | 9.77 |
| Symbol | LClose | %Chg |
|---|---|---|
| UNIONDICON | 8.10 | -10.00 |
| STANBICETF30 | 450.00 | -8.91 |
| CHAMPION | 13.75 | -7.09 |
| ROYALEX | 2.05 | -5.96 |
| WEMABANK | 17.00 | -5.56 |
For more detailed analysis,
- On InfoWARE Market Data Terminal <TOPG> <GO>
- On InfoWARE Finance Mobile App ( Android, iPhone & iPad and Windows 10) , "Top Gainers & Losers"
Currency Market
In the currency market, the Naira was unchanged against the dollar at 1 to 1NSE: Bull Signal - Price crossed above 15 Day MA
This signal implies these stocks are under buying pressure and the price might continue to rise and therefore positions should be monitored closely. Further suggested analysis include looking at the overall market (ASI) to see if the uptrend is market wide, sector wide or specific to the stock. Portfolio managers tend to use this as a signal to do more research to add to their positions or lock in some profits. Typically further analysis should be done using commands like PC and RV on the InfoWARE Market Data Terminal. Another command is ALERTS to set price triggers for possible exit or entry as necessary
For more detailed analysis,
- On InfoWARE Market Data Terminal <NSEPERF> <GO>
- On InfoWARE Finance Mobile App ( Android , iPhone & iPad and Windows 10) , "Top Gainers & Losers"
| Symbol | Price | %Chg | 15DMA | PE | EPS | DivY | MktCap | Vol | Trades | Value | LstTradeTime |
|---|---|---|---|---|---|---|---|---|---|---|---|
| TRANSCORP | 49.90 | 7.82 | 46.31 | 0.00 | 0.00 | 0.23 | 2,028.33B | 4.94M | 258.00 | 235.98M | 30-Sep-2025 14:30:52.163 |
| VETINDETF | 47.50 | 5.26 | 46.90 | 0.00 | 0.00 | 80.42K | 5.00 | 3.39M | 30-Sep-2025 14:30:52.660 | ||
| FIDELITYBK | 21.00 | 5.00 | 20.53 | 13.24 | 1.17 | 5.48 | 608.47B | 793.04M | 831.00 | 15.88B | 30-Sep-2025 14:30:52.030 |
| VFDGROUP | 10.90 | 3.67 | 10.89 | 0.00 | 0.00 | 0.00 | 0.00 | 7.18M | 256.00 | 76.73M | 30-Sep-2025 14:30:13.577 |
| NGXOILGAS | 2,523.05 | 3.53 | 2,445.83 | 8.74 | 228.15 | 0.00 | 0.00 | 352.85K | 303.00 | 213.08M | 30-Sep-2025 14:30:30.103 |
| CONHALLPLC | 4.12 | 3.16 | 4.06 | 69.63 | 0.03 | 2.08 | 44.10B | 3.69M | 96.00 | 15.00M | 30-Sep-2025 14:30:08.980 |
| FIRSTHOLDCO | 31.50 | 1.59 | 31.23 | 0.00 | 0.00 | 15.53M | 369.00 | 482.08M | 30-Sep-2025 14:30:54.843 | ||
| VITAFOAM | 79.80 | 1.00 | 79.75 | 8.66 | 2.56 | 7.03 | 99.82B | 1.88M | 154.00 | 146.25M | 30-Sep-2025 14:30:13.603 |
NSE: BEAR Signal - Price crossed below 15 Day MA
This signal implies these stocks are under selling pressure and the price might continue to slide and therefore positions should be monitored closely. Further suggested analysis include looking at the overall market (ASI) to see if the downtrend is market wide, sector wide or specific to the stock. If the overal market trend is upwards, then since these stocks are heading in the opposite direction, then further analysis should be done using commands like PC and RV on the InfoWARE Market Data Terminal. Another command is ALERTS to set price triggers for possible exit is necessar
For more detailed analysis,
- On InfoWARE Market Data Terminal <BEARM> <GO>
- On InfoWARE Finance Mobile App ( Android , iPhone & iPad and Windows 10)
| Symbol | Price | %Chg | 15DMA | PE | EPS | DivY | MktCap | Vol | Trades | Value | LstTradeTime |
|---|---|---|---|---|---|---|---|---|---|---|---|
| WAPCO | 125.10 | -0.76 | 125.69 | 24.60 | 2.87 | 2.70 | 2,015.09B | 9.84M | 353.00 | 1.27B | 30-Sep-2025 14:30:52.843 |
| NGXMERIVAL | 13,361.63 | -1.02 | 13,494.68 | 12.13 | 38.38 | 0.00 | 0.00 | 911.03M | 6,991.00 | 22.31B | 30-Sep-2025 14:30:30.053 |
| ETI | 36.00 | -1.39 | 36.23 | 5.00 | 5.10 | 2.00 | 660.58B | 1.53M | 125.00 | 54.71M | 30-Sep-2025 14:30:09.273 |
| ETRANZACT | 16.00 | -4.38 | 16.17 | 171.51 | 0.04 | 1.48 | 147.20B | 566.90K | 94.00 | 8.83M | 30-Sep-2025 14:30:09.290 |
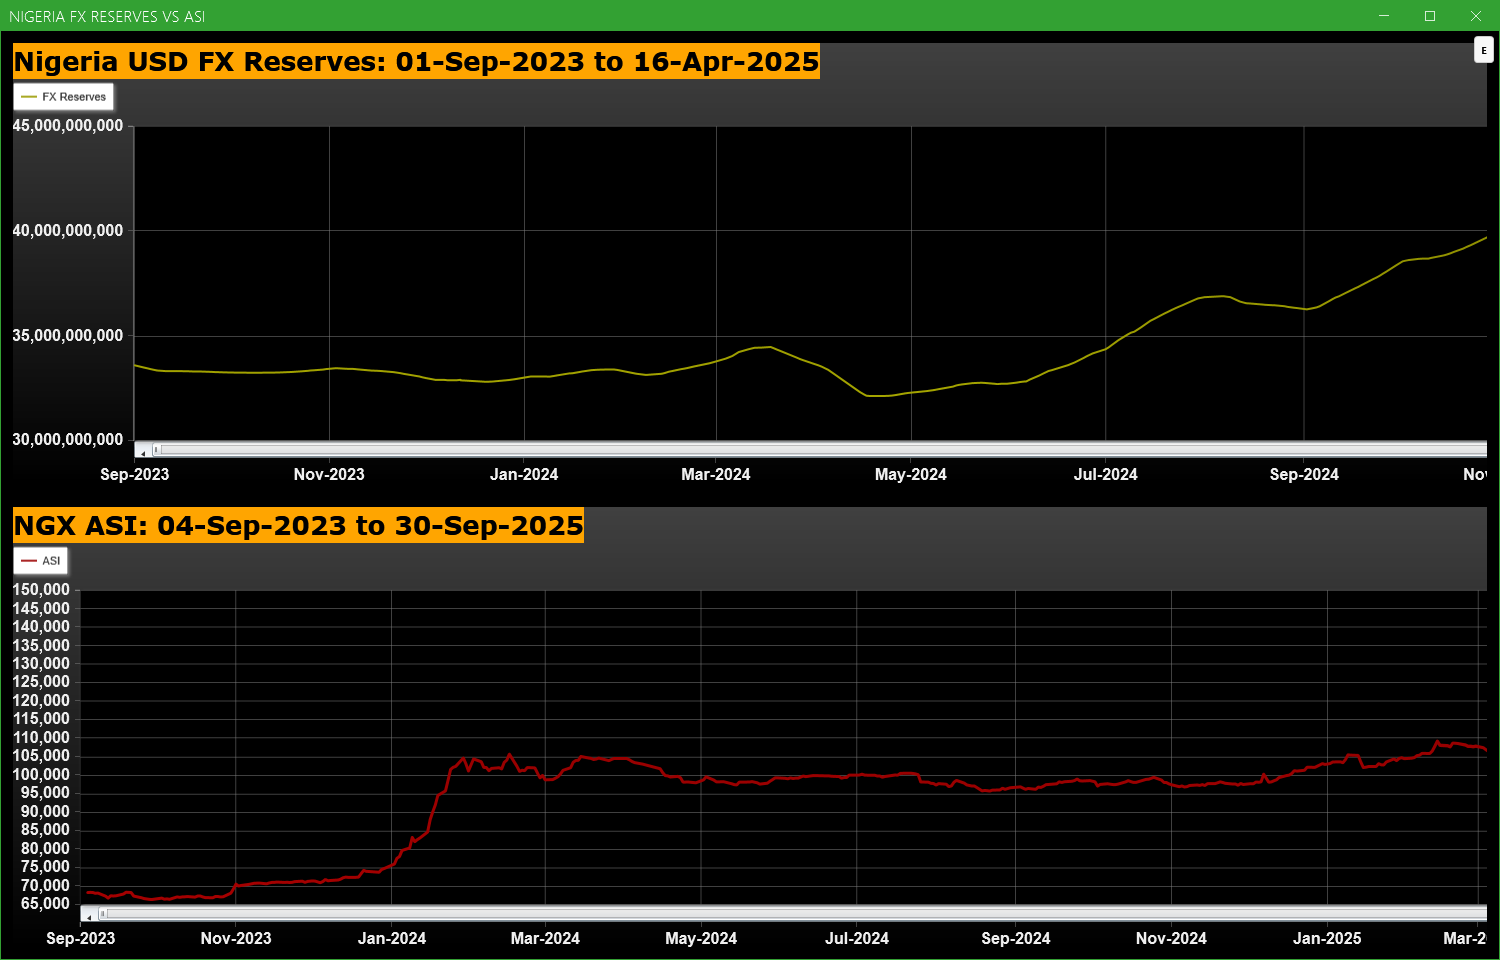
Economic Indicators - Nigeria FX Reserves Vs ASI Chart
Nigeria FX Reserves are assets held on reserve by CBN in foreign currencies. These reserves are used to back liabilities and influence monetary policy. Given the nature of the Nigeria economy, FX Reserves can appear to have an outsize influence on the economy and hence on the capital market. The chart below allows comparison of FX Reserves against the ASI to make investment decisions
For more detailed analysis,
- On InfoWARE Market Data Terminal <CI> <GO>
- On InfoWARE Finance Mobile App ( Android , iPhone & iPad and Windows 10) , "Research"
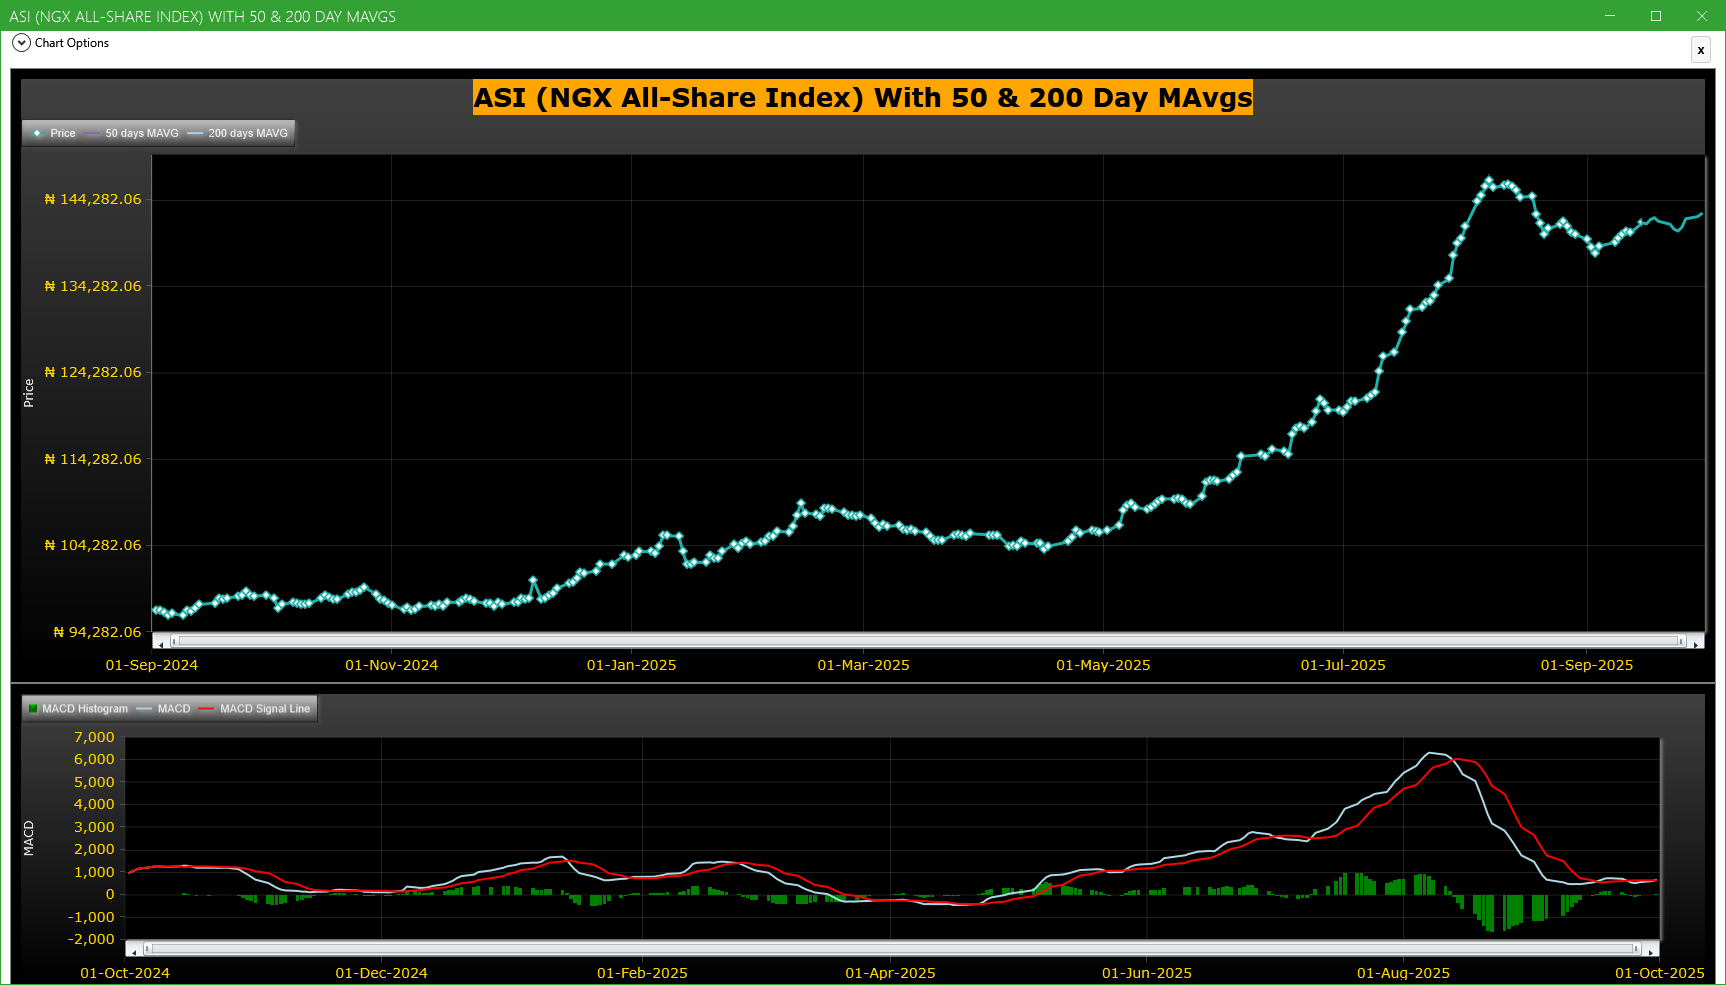
Market Trend - ASI (NGX All-Share-Index) With 50 & 200 Day MAvgs Chart
Technical traders typically use the 50 & 200 day moving averages to aid in choosing
where to enter or exit a position, which then causes these levels to act as strong
support or resistance. As a general guideline, if the price is above a moving average,
the trend is up. If the price is below a moving average, the trend is down.
It is important to note that critics of technical analysis say that moving averages act
as support and resistance because so many traders use these indicators to inform their
trading decisions. Also moving averages tend to work quite well in strong trending conditions
but poorly in choppy or ranging conditions.
Trading Strategies: Crossovers
Crossovers are one of the main moving average strategies. The first type is a price crossover,
which is when the price crosses above or below a moving average to signal a potential change
in trend. Another strategy is to apply two moving averages to a chart: one longer and one
shorter. When the shorter-term MA crosses above the longer-term MA, it is a buy signal, as
it indicates that the trend is shifting up. This is known as a golden cross. Meanwhile, when
the shorter-term MA crosses below the longer-term MA, it is a sell signal, as it indicates that
the trend is shifting down. This is known as a dead/death cross
For more detailed analysis,
- On InfoWARE Market Data Terminal <CI> <GO>
- On InfoWARE Finance Mobile App ( Android , iPhone & iPad and Windows 10) , "Research"
Unusual Volume: Volume traded is more than double the 90 day moving average (All exchanges; ASI & ASem). For more detailed analysis,
- On InfoWARE Market Data Terminal <UV> <GO>
- On InfoWARE Finance Mobile App ( Android , iPhone & iPad and Windows 10)
| Symbol | Name | Volume | 90DAvgVol | %VolChg | Price | LClose | %Chg | Trades | Value |
|---|---|---|---|---|---|---|---|---|---|
| FIDELITYBK | FIDELITY BANK PLC | 793.04M | 32.66M | 2,328.03 | 21.00 | 19.95 | 5.26 | 831 | 15.88B |
| NCR | NCR (NIGERIA) PLC. | 66.77M | 54.80K | 121,740.70 | 16.00 | 15.20 | 5.26 | 43 | 1.07B |
| VITAFOAM | VITAFOAM NIG PLC. | 1.88M | 899.43K | 109.01 | 79.80 | 79.00 | 1.01 | 154 | 146.25M |
| EUNISELL | EUNISELL INTERLINKED PLC | 524.78K | 220.58K | 137.91 | 39.50 | 36.00 | 9.72 | 61 | 19.90M |
| GEREGU | GEREGU Power PLC | 461.89K | 218.07K | 111.81 | 1,141.50 | 1,141.50 | 0.00 | 53 | 474.55M |
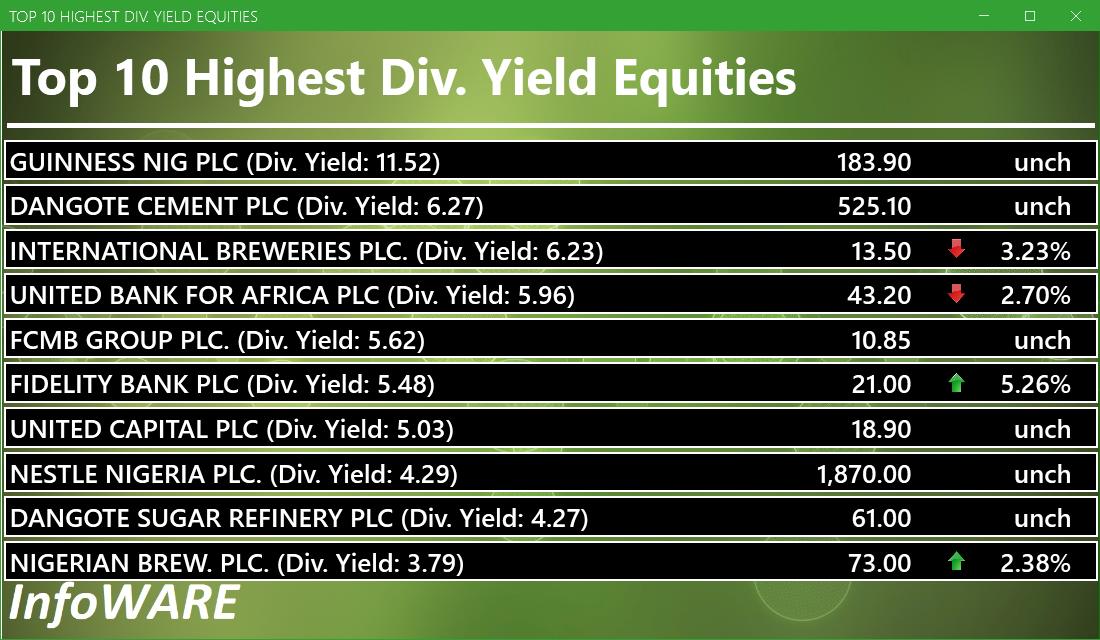
Investment Insights - High Div. Stocks
Dividend stocks distribute a portion of the company earnings to investors on a regular basis and they can a great choice for investors looking for regular income. As an investment or trading strategy, high dividend yield equities provide annual cash payments as against mostly capital gains in the price of a stock. The list in the table below represent the highest dividend paying stocks from the list of the most liquid stocks in the NSE top 30.
For more detailed analysis,
- On InfoWARE Market Data Terminal <HYIELD> <GO>
- On InfoWARE Finance Mobile App ( Android , iPhone & iPad and Windows 10) , "Research"
African Markets
| Name | LClose | Change | %Chg |
|---|---|---|---|
| BRVM Stock Exchange | 323.48 | -1.23 | -0.38 |
| Egyptian Exchange | 36,391.00 | 224.23 | 0.62 |
| Ghana Stock Exchange | 8,161.85 | 42.22 | 0.52 |
| Johannesburg Stock Exchange | 107,243.56 | 544.17 | 0.51 |
| Lusaka Stock Exchange | 25,222.37 | 37.78 | 0.15 |
| Casablanca Stock Exchange | 18,980.22 | -363.67 | -1.88 |
| Malawi Stock Exchange | 578,388.78 | 57.83 | 0.01 |
| Nigeria Stock Exchange | 142,377.56 | 241.63 | 0.17 |
| Nairobi Securities Exchange | 176.68 | -1.21 | -0.68 |
| Namibian Stock Exchange | 1,913.83 | 10.85 | 0.57 |
| Rwanda Stock Exchange | 179.20 | -0.11 | -0.06 |
| Tunis Stock Exchange | 12,440.85 | 23.59 | 0.19 |
| Uganda Securities Exchange | 1,468.72 | 8.32 | 0.57 |
Nigeria Market Indexes
| Symbol | LClose | %Chg | WTD% | MTD% | QTD% | YTD% | MktCap | Trades |
|---|---|---|---|---|---|---|---|---|
| ASI | 142,710.46 | 0.23 | 0.23 | 2.14 | 19.18 | 38.31 | 26,308 | |
| NGX30 | 5,211.19 | 0.35 | 0.35 | 2.24 | 10.32 | 36.60 | 15,500 | |
| NGXAFRBVI | 3,526.63 | -0.66 | -0.66 | 1.18 | -0.48 | 42.16 | 5,553 | |
| NGXAFRHDYI | 22,176.23 | -0.52 | -0.52 | -1.58 | 6.04 | 30.24 | 6,225 | |
| NGXASEM | 1,538.10 | 0.00 | 0.00 | 0.00 | -3.57 | -2.88 | 5 | |
| NGXBNK | 1,514.11 | -0.14 | -0.14 | 0.17 | 0.22 | 39.24 | 8,429 | |
| NGXCG | 4,038.18 | 0.11 | 0.11 | 0.09 | 17.43 | 42.73 | 13,363 | |
| NGXCNSMRGDS | 3,370.91 | -0.19 | -0.19 | 5.68 | -2.82 | 94.36 | 3,215 | |
| NGXCOMMDTY | 1,121.70 | 1.79 | 1.79 | 5.02 | 7.11 | 12.17 | ||
| NGXGROWTH | 15,077.12 | 2.06 | 2.06 | 34.62 | 58.55 | 94.22 | 299 | |
| NGXINDUSTR | 5,068.68 | -0.11 | -0.11 | 2.76 | 43.88 | 41.92 | 2,032 | |
| NGXINS | 1,191.04 | -0.35 | -0.35 | -7.16 | 61.26 | 51.50 | 1,769 | |
| NGXLOTUSISLM | 11,858.00 | 1.07 | 1.07 | 3.84 | 23.85 | 70.18 | 4,535 | |
| NGXMAINBOARD | 7,026.94 | 0.48 | 0.48 | 3.54 | 19.12 | 40.43 | 19,530 | |
| NGXMERIGRW | 9,827.09 | -0.78 | -0.78 | -1.87 | 1.81 | 50.65 | 5,354 | |
| NGXMERIVAL | 13,361.63 | -1.01 | -1.01 | -0.06 | 11.83 | 28.10 | 6,991 | |
| NGXOILGAS | 2,523.05 | 3.66 | 3.66 | 6.43 | 5.47 | -6.94 | 303 | |
| NGXPENBRD | 2,646.28 | 0.34 | 0.34 | 2.17 | 15.09 | 44.48 | 21,921 | |
| NGXPENSION | 6,724.36 | 0.77 | 0.77 | 1.58 | 5.82 | 48.31 | 16,967 | |
| NGXPREMIUM | 13,682.97 | -0.23 | -0.23 | -0.58 | 19.29 | 40.58 | 6,479 | |
| NGXSOVBND | 657.27 | 0.00 | 0.00 | -0.24 | 0.58 | 9.26 | 0 |
For more detailed analysis,
- On InfoWARE Market Data Terminal <MKTINS> <GO>
- On InfoWARE Finance Mobile App ( Android, iPhone & iPad and Windows 10) , "Market Indexes"
Find the topic interesting? Will like to comment? Contact Us at solutions@infowarelimited.com
Top News

Chart Of The Day - ASI Chart Vs ASI Advance Decline Line (YTD) (02-Oct-2025 15:10:29.073)
InfoWARE AI Analyst Daily Market Report: 02-Oct-2025

[XNSA]>> RESIGNATION OF A DIRECTOR
[VETBANK]>> DAILY INDICATIVE PRICES
[VETBANK]>> DAILY INDICATIVE PRICES
[XNSA]>> LIFTING OF SUSPENSION OF INTERNATIONAL ENERGY INSURANCE PLC
[XNSA]>> APPOINTMENT OF A DIRECTOR
[XNSA]>> OFF MARKET TRADE
[XNSA]>> NGX FIXED INCOME INDICATIVE PRICE LIST FOR OCT 02, 2025
[XNSA]>> EXECUTIVE CAPACITY DEVELOPMENT COURSE ON NIGERIA CAPITAL MARKET
[XNSA]>> UPDATED- SAVE THE DATE: 29TH ANNUAL STOCKBROKERS CONFERENCE
[XNSA]>> AELP CAPACITY BUILDING & ASSDA FORUM
[SIAMLETF40]>> DAILY INDICATIVE PRICES
InfoWARE AI Analyst Daily Market Report: 30-Sep-2025
Chart Of The Day - ASI Chart Vs ASI Advance Decline Line (YTD) (30-Sep-2025 15:06:58.117)
InfoWARE AI Analyst Daily Market Report: 30-Sep-2025
[XNSA]>> DAILY FUND PRICE SUBMISSION - FCMB ASSET MANAGEMENT LIMITED
[XNSA]>> PUBLIC HOLIDAY
[VSPBONDETF]>> DAILY INDICATIVE PRICES
[XNSA]>> EXECUTIVE CAPACITY DEVELOPMENT COURSE ON NIGERIA CAPITAL MARKET
[XNSA]>> NGX FIXED INCOME INDICATIVE PRICE LIST FOR SEP 30, 2025
[XNSA]>> CORDROS MILESTONE FUNDS' BID & OFFER PRICES
[LOTUSHAL15]>> DAILY INDICATIVE PRICES
[XNSA]>> LISTING OF 14,143,244,747 ORDINARY SHARES OF WEMA BANK PLC
[XNSA]>> UPDATED- SAVE THE DATE: 29TH ANNUAL STOCKBROKERS CONFERENCE
[XNSA]>> AELP CAPACITY BUILDING & ASSDA FORUM
[SIAMLETF40]>> DAILY INDICATIVE PRICES
Chart Of The Day - ASI Chart Vs ASI Advance Decline Line (YTD) (29-Sep-2025 15:09:38.971)
InfoWARE AI Analyst Daily Market Report: 29-Sep-2025
[LOTUSHAL15]>> DAILY INDICATIVE PRICES
Get IDIA - the stock trading app for the modern investor
Solutions by Business
Product Suites
Company
Contacts
- 8th Floor,
- South Atlantic Petroleum Towers,
- 1 Adeola Odeku Street,
- Victoria Island,
- Lagos, Nigeria.
- Email: solutions@infowarelimited.com
Follow Us
 |
 |
 |
 |