


InfoWARE AI Analyst Daily Market Report: 02-Oct-2025 | InfoWARE Finance
Get IDIA - the stock trading app for the modern investor


InfoWARE AI Analyst Daily Market Report: 02-Oct-2025
(Source: InfoWARE Terminal, Date: 02-Oct-2025)
Dear Investor,
🏦 NGX Daily Market Summary – Thursday, October 2, 2025
The Nigerian Exchange (NGX) All Share Index (ASI) gained 0.19% today to close at 142,710.48, sustaining its upward momentum with a remarkable 38.57% YTD gain. Despite the positive index movement, market turnover fell by -13.20% to ₦24.53B on significantly lighter volume (654.12M vs yesterday's 1.21B), suggesting institutional participants took a more defensive stance. The breadth was healthy at 1.46x advancers to decliners (41 up / 28 down), as large cap names and select ETFs drove gains. Key outliers, such as heavy volume in banking stocks and ETF volatility, fuel sector-specific narratives and tactical opportunities for traders.
🌐 Market Breadth & Significant Trends
- Advancers: 41 Decliners: 28 (Breadth Ratio: 1.46x)
- Volume Trends: Volumes increased for 72 stocks and decreased for 70; the drop in overall market volume and turnover (-13.2%) highlights a selective rather than broad-based risk-on mood.
- Notable ETF Swing: NEWGOLD ETF surged +13.28% (💎 leadership in safe-haven/inflation-hedge play), while GREENWETF plunged -10.00%, reinforcing volatility in alternative assets.
🚀 Top Gainers & Losers (Daily)
| Stock | Price | % Change | RSI | Beta | PE |
|---|---|---|---|---|---|
| NEWGOLD ETF | 58,000.00 | +13.28% | 48.34 | 0.23 | 0.00 |
| STANBICETF30 | 495.00 | +10.00% | 53.03 | -0.23 | N/A |
| GREENWETF | 232.21 | +10.00% | 42.17 | 0.83 | N/A |
| PZ | 37.95 | +10.00% | 50.44 | 0.56 | 44.17 |
| ETERNA | 37.05 | +9.94% | 53.09 | 1.34 | 29.51 |
| Top Loser: MERVALUE | 179.20 | -9.95% | 50.22 | 4.95 | N/A |
| RTBRISCOE | 3.37 | -9.89% | 54.09 | -0.16 | 0.00 |
| THOMASWY | 3.58 | -9.82% | 65.29 | 0.02 | 0.00 |
| SOVRENINS | 2.72 | -9.33% | 52.97 | 1.12 | 27.95 |
| INTENEGINS | 3.08 | -7.78% | 52.47 | 0.01 | 0.52 |
- ETF Step Change: Flight to safety/lower correlation to ASI through ETFs like NEWGOLD; aggressive profit-taking on GREENWETF after its sharp run.
- Retail Action: Heavier swings and volume in small/micro caps (RTBRISCOE, SOVRENINS, INTENEGINS), indicating speculative short-term trading activity.
- Momentum Standouts: ETERNA and PZ posting double-digit gains with positive RSI and bullish price action.
📈 Market Momentum – Technical Table Highlights
-
Bullish Crossovers:
- Multiple gainers (NEWGOLD, GREENWETF, PZ) also crossed above their 15-day moving averages – confirming short-term bullish momentum. However, note that RSI is not in overbought territory for these, suggesting further upside is possible.
-
Bearish Warnings:
- Key stocks crossing below their 15DMA include VITAFOAM, FIDELITYBK, HONYFLOUR, and notably RTBRISCOE, which is also a top daily and YTD loser.
-
Unusual Volume:
Symbol Name Volume % vol chg Price % Chg UBA United Bank for Africa 152.14M +491% 43.00 -0.46% WEMABANK Wema Bank 152.05M +1,693% 17.30 +1.76% FIRSTHOLDCO First Holdings 111.80M +493% 31.00 -1.59% STANBIC Stanbic IBTC 31.03M +1,009% 109.00 0.00% PZ P Z Cussons 8.90M +230% 37.95 +10.00% - Banking dominance: The surge in trading activity in major banks (UBA, WEMABANK, FIRSTHOLDCO) highlights institutional rotation and possibly early accumulation or risk-off hedging.
- PZ: Unusual volume with major price rally — momentum traders should monitor closely for continuation or signs of exhaustion.
-
RSI Insights:
- No stock in the top YTD gainers or bullish signals table currently sets off an overbought (RSI > 70) or oversold (RSI < 30) alarm. EUNISELL has RSI 74.54 (slightly cautionary for overbought); rest remain within trend-continuation zones.
- THOMASWY, while a loser today, has a high RSI (65.29), suggesting profit-taking — possible volatility ahead.
-
Bullish & Bearish Overlaps:
- Stocks like PZ, ETERNA, GREENWETF and NEWGOLD appear on both gainers and bullish 15DMA crossover tables. They are leading the short-term tactical momentum trade.
🔍 Contrarian Signals
- MERVALUE ETF: Despite an RSI of 50.22 (neutral), MERVALUE's MACD has just crossed negative and is among the biggest YTD losers (-10.27% YTD), yet volatility remains low. This signals low conviction behind the down move — possible reversal watch.
- RTBRISCOE: RSI 54.09 (no oversold), but persistent sell-off YTD (-9.89% today) with bearish momentum and a 15DMA breakdown, but volume is not spiking — unclear whether capitulation or slow bleed.
- EUNISELL: Appears as a top YTD gainer (+104.98% YTD), and RSI is high (74.54 – possible short-term overbought). Approaching profit-taking territory.
- GREENWETF: +10% price action but only mid-range RSI, with recent bullish 15DMA crossover. This mix could attract both momentum chasers and cautious swing traders.
🔥 Sector Heatmap
| Sector | Directional Bias | Main Driver(s) | Notes / Technicals |
|---|---|---|---|
| Banking | Bullish Rotation | UBA, WEMABANK, FIRSTHOLDCO | Unusual volume; some price hesitation; mean reversion opportunity |
| ETF/Commodities | Volatile (Mixed) | NEWGOLD (up), GREENWETF (swing) | Safe-haven bid, tactical risk-off; technical breakouts |
| Consumer Goods | Bullish | PZ | Strong move on high volume, positive technicals |
| Insurance & Microcaps | Bearish | SOVRENINS, INTENEGINS, RTBRISCOE | Persistent weakness leading YTD underperformance |
| Oil & Gas | Bullish | ETERNA, ARADEL | YTD outperformance; healthy RSI and MACD trends |
- Institutional action heavily focused in large cap banks (banking trade value: >80% institutional).
💸 Dividend-Beta Matrix – Defensive Opportunities
| Stock | Div. Yield % | Beta | Notes |
|---|---|---|---|
| VITAFOAM | 7.03 | 0.47 | High dividend, low beta. Currently in bearish momentum (15DMA breakdown); income investors should watch for base formation. |
| FIDELITYBK | 5.48 | 0.89 | Banks offer yield but now technically weak. Bearish momentum short-term—watch for support tests for possible entries. |
| PZ | 4.59 | 0.56 | Dividend and momentum stock; unusual volume and technical upside may attract both value and growth buyers. |
| SOVRENINS | 3.75 | 1.12 | High yield but high beta = riskier. Present as YTD & daily loser and in bearish momentum table. |
| NAHCO | 6.66 | 0.65 | Steady yield, low beta. On bullish list; possible sector rotation play. |
- Big Picture: High dividend names like VITAFOAM and FIDELITYBK turning bearish short-term. Watch closely—a bounce from these areas often produces strong moves and income defensiveness.
⚡ Institutional Clustering Alerts
- ZENITHBANK: Accounts for 20.17% of institutional trade value share today. Suggests aggressive positioning/rotation; smart money may be prepping for next leg up or hedging post recent rallies.
-
Banks overall: UBA, WEMABANK, GTCO, ARADEL— all featured heavily in institutional top trades.
Banks collectively represent the majority of institutional volume and value today. - Retail vs Institutional: Institutional investors constitute 35.84% of trade count but dominate volume (80.25%) and value (93.28%). Top retail traded symbols slightly more diversified, institutional sharply focused on large caps.
🧐 Suggestions for Traders
- Momentum: Watch NEWGOLD, PZ, and ETERNA for momentum continuation (given volume and strong technicals), but trail stops as short-term swings can transition to profit-taking.
- Contrarian Bounce: Stocks like MERVALUE and VITAFOAM (high yield, technical pressure, but not oversold) could be staging grounds for reversal traders.
- Profit-taking Caution: EUNISELL is becoming extremely overbought (RSI 74.5, +100% YTD)—manage risk if already long.
- Sector Rotation: Institutional rotation into banks and out of some consumer/insurance names is tactical. Watch moving average crossovers for the next sector wave.
- Volume Clues: Whenever banks post 5x to 17x usual volume, a large move often follows in subsequent sessions. Track for breakout or reversal.
📈 Market Activity Insights
- Retail vs Institutional Profile: Institutional dominated banks (ZENITHBANK, GTCO, UBA) and large caps; retail activity more spread (STERLINGNG, ACCESSCORP, UBA).
-
Top Institutional Trades:
Symbol Inst. Vol % Inst. Vol ZENITHBANK 45.35M 5.77% GTCO 25.37M 3.23% ARADEL 1.81M 0.23% UBA 149.54M 19.04% WEMABANK 146.78M 18.69% -
Top Retail Trades:
Symbol Retail Vol % Retail Vol STERLINGNG 11.98M 1.52% ZENITHBANK 1.74M 0.22% MTNN 172.94K 0.02% UBA 2.60M 0.33% ACCESSCORP 3.21M 0.41% - Insight: Pattern shows "crowding" in banks by both institutional and retail traders—a potential precursor to volatility spikes and larger breakouts/trend reversals in banking sector.
- Volume-to-Value Disparity: Despite just 1640 institutional trades (to 31,137 retail), institutions accounted for over 93% of traded value and 80% of volume — indicating "big hands" are still steering market direction.
🔄 Hidden & Subtle Trends
- ETF action signals asset allocation shifts. Rotation toward NEWGOLD and away from equity ETFs (GREENWETF, MERVALUE) may foreshadow broader macro hedging.
- Momentum without overbought signals. Few stocks are flashing classical overbought RSI levels: upside could continue near-term, but watch for overextensions (EUNISELL warrants caution).
- High yielders turning bearish. Defensive dividend names are not immune to short-term corrections—income chasing should be tactical, not passive.
- Unusual volume precedes big moves. Banks with explosive volume (esp. UBA, WEMABANK, FIRSTHOLDCO) have a history of leading the index in subsequent sessions.
- RSI/MACD/MAs: Many gainers show positive MACD and 15DMA above 50DMA (see sparklines below), confirming trend strength and supporting follow-through plays.
💹 Trading Ideas Summary
- Momentum Continuation: Consider PZ, ETERNA, and NEWGOLD while uptrends persist; mind position sizing.
- Tactical Contrarian: VITAFOAM, MERVALUE, SOVRENINS for value hunters or short squeezes—wait for reversal signal confirmation.
- Yield with Technical Watch: FIDELITYBK/NAHCO: Monitor for re-entry when base forms.
- Banking Rotation: Use explosive volumes as early warning for index leadership or sharp reversals.
- Risk Caution: Beware of crowded trades and overbought signals—use trailing stops and diversify.
|
Top ASI Gainers Over Last 5 Trading Days
|
Top ASI Losers Over Last 5 Trading Days
|
For more detailed analysis, on InfoWARE Market Data Terminal <NSEPERF> <GO>
On InfoWARE Finance Mobile App (Android, iPhone & iPad, Windows Phone and Windows 8/10), "Top Gainers & Losers"
NEWGOLD EXCHANGE TRADED FUND (ETF) (NEWGOLD) topped the advancers list closing at N58,000.00 with a gain of 13.28% followed by GREENWICH ASSET ETF (GREENWETF) which closed at N232.21 with a gain of 10.00%.
On the flip side MERISTEM VALUE EXCHANGE TRADED FUND (MERVALUE) and R T BRISCOE PLC. (RTBRISCOE) topped the decliners log with a loss of -9.95% at a close of N179.20, and -9.89% to close the day at N3.37 respectively.
| Symbol | LClose | %Chg |
|---|---|---|
| NEWGOLD | 58,000.00 | 13.28 |
| GREENWETF | 232.21 | 10.00 |
| PZ | 37.95 | 10.00 |
| STANBICETF30 | 495.00 | 10.00 |
| ETERNA | 37.05 | 9.94 |
| Symbol | LClose | %Chg |
|---|---|---|
| MERVALUE | 179.20 | -9.95 |
| RTBRISCOE | 3.37 | -9.89 |
| THOMASWY | 3.58 | -9.82 |
| SOVRENINS | 2.72 | -9.33 |
| INTENEGINS | 3.08 | -7.78 |
For more detailed analysis,
- On InfoWARE Market Data Terminal <TOPG> <GO>
- On InfoWARE Finance Mobile App ( Android, iPhone & iPad and Windows 10) , "Top Gainers & Losers"
Currency Market
In the currency market, the Naira fell 0.06%(-0.87) against the Dollar to settle at 1 to 1NSE: Bull Signal - Price crossed above 15 Day MA
This signal implies these stocks are under buying pressure and the price might continue to rise and therefore positions should be monitored closely. Further suggested analysis include looking at the overall market (ASI) to see if the uptrend is market wide, sector wide or specific to the stock. Portfolio managers tend to use this as a signal to do more research to add to their positions or lock in some profits. Typically further analysis should be done using commands like PC and RV on the InfoWARE Market Data Terminal. Another command is ALERTS to set price triggers for possible exit or entry as necessary
For more detailed analysis,
- On InfoWARE Market Data Terminal <NSEPERF> <GO>
- On InfoWARE Finance Mobile App ( Android , iPhone & iPad and Windows 10) , "Top Gainers & Losers"
| Symbol | Price | %Chg | 15DMA | PE | EPS | DivY | MktCap | Vol | Trades | Value | LstTradeTime |
|---|---|---|---|---|---|---|---|---|---|---|---|
| FGSUK2031S4 | 96.94 | 17.47 | 86.54 | 0.00 | 0.00 | 1.00 | 1.00 | 969.40 | 02-Oct-2025 14:31:04.903 | ||
| NEWGOLD | 58,000.00 | 11.72 | 53,654.68 | 0.00 | 0.00 | 0.00 | 0.00 | 1.00 | 1.00 | 58.00K | 02-Oct-2025 14:30:53.370 |
| GREENWETF | 232.21 | 9.09 | 226.33 | 0.00 | 0.00 | 70.00 | 2.00 | 16.25K | 02-Oct-2025 14:30:53.333 | ||
| PZ | 37.95 | 9.09 | 34.65 | 44.17 | 0.50 | 4.59 | 150.68B | 8.90M | 104.00 | 337.57M | 02-Oct-2025 14:30:18.867 |
| TANTALIZER | 2.49 | 5.62 | 2.44 | 0.00 | 0.00 | 1.50 | 8.00B | 3.04M | 122.00 | 7.07M | 02-Oct-2025 14:30:19.890 |
| NEIMETH | 6.15 | 4.88 | 6.13 | 125.52 | 0.02 | 3.38 | 26.28B | 622.95K | 91.00 | 3.88M | 02-Oct-2025 14:30:17.880 |
| DAARCOMM | 1.10 | 1.82 | 1.09 | 0.00 | 0.00 | 0.00 | 13.20B | 2.43M | 112.00 | 2.67M | 02-Oct-2025 14:30:14.313 |
| NGXGROUP | 60.00 | 1.67 | 59.12 | 0.00 | 0.00 | 2.73 | 117.85B | 662.95K | 78.00 | 39.56M | 02-Oct-2025 14:30:17.943 |
| NAHCO | 106.00 | 0.94 | 105.47 | 92.98 | 0.41 | 6.66 | 206.60B | 1.33M | 179.00 | 141.84M | 02-Oct-2025 14:30:17.707 |
| NGXCG | 4,050.89 | 0.31 | 4,041.52 | 443.35 | 327.97 | 0.00 | 0.00 | 482.72M | 15,742.00 | 22.69B | 02-Oct-2025 14:30:34.333 |
NSE: BEAR Signal - Price crossed below 15 Day MA
This signal implies these stocks are under selling pressure and the price might continue to slide and therefore positions should be monitored closely. Further suggested analysis include looking at the overall market (ASI) to see if the downtrend is market wide, sector wide or specific to the stock. If the overal market trend is upwards, then since these stocks are heading in the opposite direction, then further analysis should be done using commands like PC and RV on the InfoWARE Market Data Terminal. Another command is ALERTS to set price triggers for possible exit is necessar
For more detailed analysis,
- On InfoWARE Market Data Terminal <BEARM> <GO>
- On InfoWARE Finance Mobile App ( Android , iPhone & iPad and Windows 10)
| Symbol | Price | %Chg | 15DMA | PE | EPS | DivY | MktCap | Vol | Trades | Value | LstTradeTime |
|---|---|---|---|---|---|---|---|---|---|---|---|
| VITAFOAM | 79.80 | 0.00 | 79.84 | 8.66 | 2.56 | 7.03 | 99.82B | 258.24K | 142.00 | 20.64M | 02-Oct-2025 14:30:20.857 |
| VETGOODS | 35.00 | -0.57 | 35.12 | 0.00 | 0.00 | 4.02K | 4.00 | 140.69K | 02-Oct-2025 14:30:53.410 | ||
| HONYFLOUR | 21.75 | -1.15 | 21.79 | 16.28 | 0.31 | 1.40 | 172.48B | 1.10M | 438.00 | 24.05M | 02-Oct-2025 14:30:16.467 |
| FIRSTHOLDCO | 31.00 | -1.61 | 31.26 | 0.00 | 0.00 | 111.80M | 510.00 | 3.49B | 02-Oct-2025 14:30:56.907 | ||
| FIDELITYBK | 20.50 | -2.44 | 20.52 | 13.24 | 1.17 | 5.48 | 593.98B | 6.44M | 1,018.00 | 130.62M | 02-Oct-2025 14:30:53.137 |
| CONHALLPLC | 4.00 | -3.00 | 4.05 | 69.63 | 0.03 | 2.08 | 42.82B | 2.47M | 79.00 | 9.99M | 02-Oct-2025 14:30:14.117 |
| RTBRISCOE | 3.37 | -10.98 | 3.56 | 0.00 | 0.00 | 4.35 | 3.96B | 1.37M | 56.00 | 4.70M | 02-Oct-2025 14:30:53.147 |
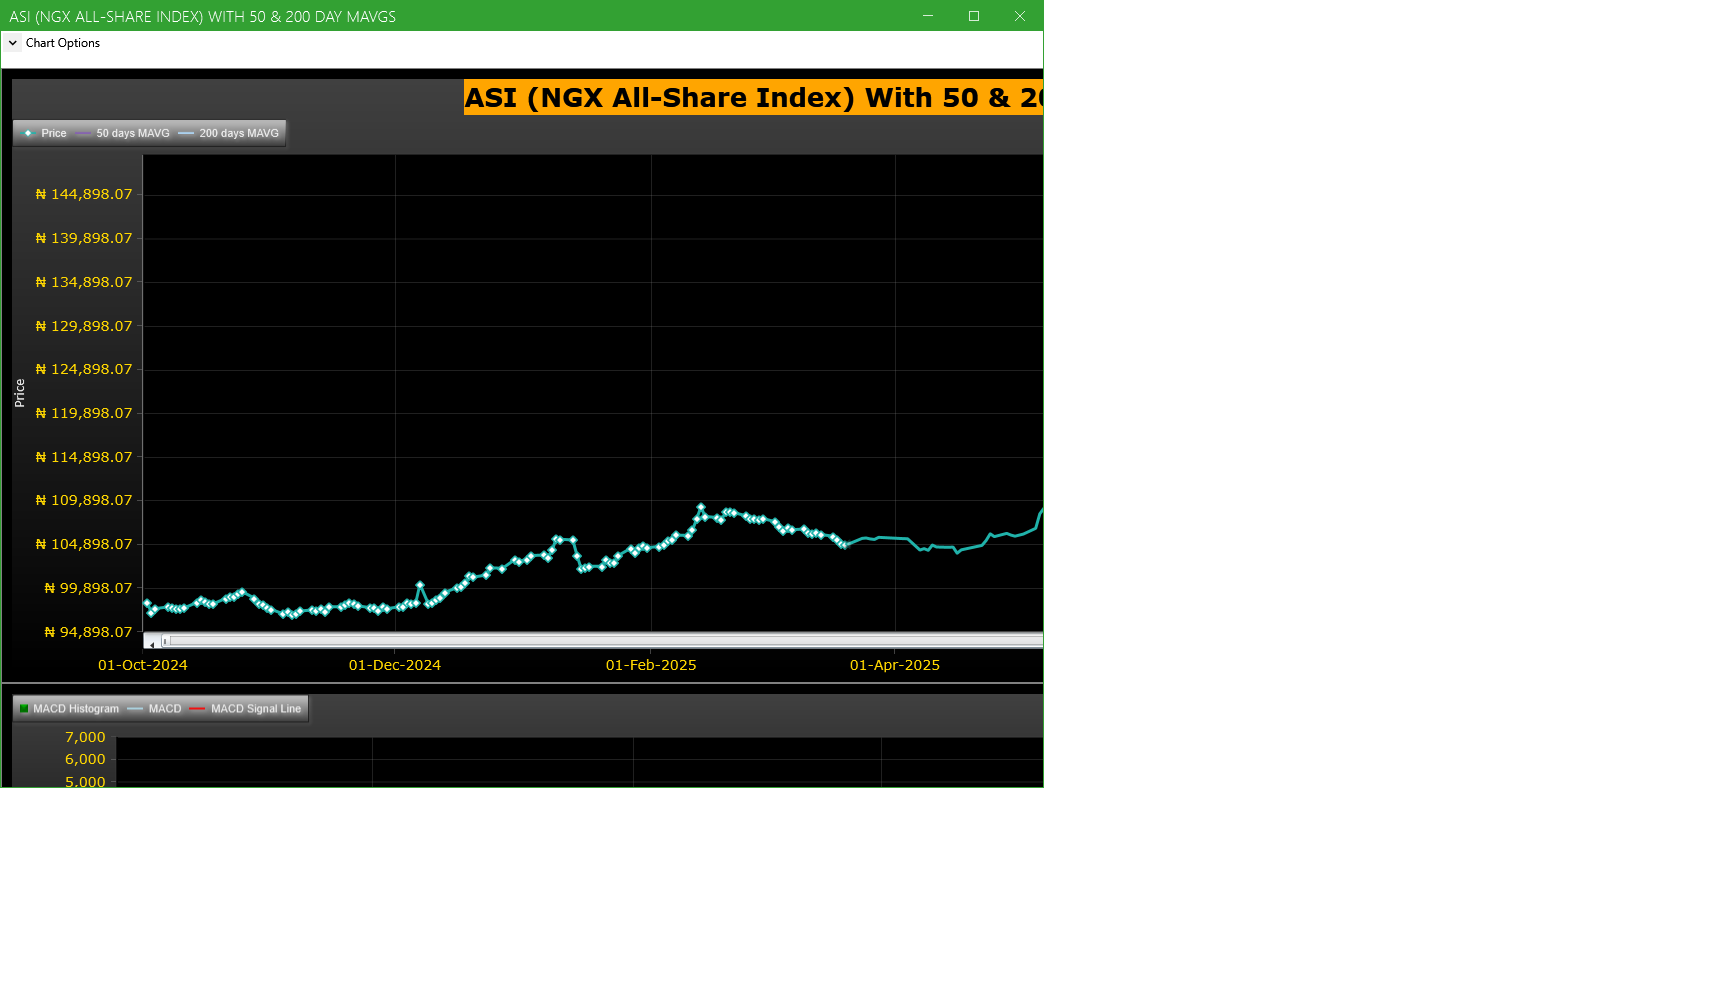
Market Trend - ASI (NGX All-Share-Index) With 50 & 200 Day MAvgs Chart
Technical traders typically use the 50 & 200 day moving averages to aid in choosing
where to enter or exit a position, which then causes these levels to act as strong
support or resistance. As a general guideline, if the price is above a moving average,
the trend is up. If the price is below a moving average, the trend is down.
It is important to note that critics of technical analysis say that moving averages act
as support and resistance because so many traders use these indicators to inform their
trading decisions. Also moving averages tend to work quite well in strong trending conditions
but poorly in choppy or ranging conditions.
Trading Strategies: Crossovers
Crossovers are one of the main moving average strategies. The first type is a price crossover,
which is when the price crosses above or below a moving average to signal a potential change
in trend. Another strategy is to apply two moving averages to a chart: one longer and one
shorter. When the shorter-term MA crosses above the longer-term MA, it is a buy signal, as
it indicates that the trend is shifting up. This is known as a golden cross. Meanwhile, when
the shorter-term MA crosses below the longer-term MA, it is a sell signal, as it indicates that
the trend is shifting down. This is known as a dead/death cross
For more detailed analysis,
- On InfoWARE Market Data Terminal <CI> <GO>
- On InfoWARE Finance Mobile App ( Android , iPhone & iPad and Windows 10) , "Research"
Unusual Volume: Volume traded is more than double the 90 day moving average (All exchanges; ASI & ASem). For more detailed analysis,
- On InfoWARE Market Data Terminal <UV> <GO>
- On InfoWARE Finance Mobile App ( Android , iPhone & iPad and Windows 10)
| Symbol | Name | Volume | 90DAvgVol | %VolChg | Price | LClose | %Chg | Trades | Value |
|---|---|---|---|---|---|---|---|---|---|
| UBA | UNITED BANK FOR AFRICA PLC | 152.14M | 25.73M | 491.27 | 43.00 | 43.20 | -0.46 | 1,514 | 6.54B |
| WEMABANK | WEMA BANK PLC. | 152.05M | 8.48M | 1,693.52 | 17.30 | 17.00 | 1.76 | 866 | 2.52B |
| FIRSTHOLDCO | FIRST HOLDCO PLC | 111.80M | 18.83M | 493.61 | 31.00 | 31.50 | -1.59 | 510 | 3.49B |
| STANBIC | STANBIC IBTC HOLDINGS PLC | 31.03M | 2.80M | 1,009.17 | 109.00 | 109.00 | 0.00 | 551 | 3.41B |
| PZ | P Z CUSSONS NIGERIA PLC. | 8.90M | 2.70M | 229.89 | 37.95 | 34.50 | 10.00 | 104 | 337.57M |
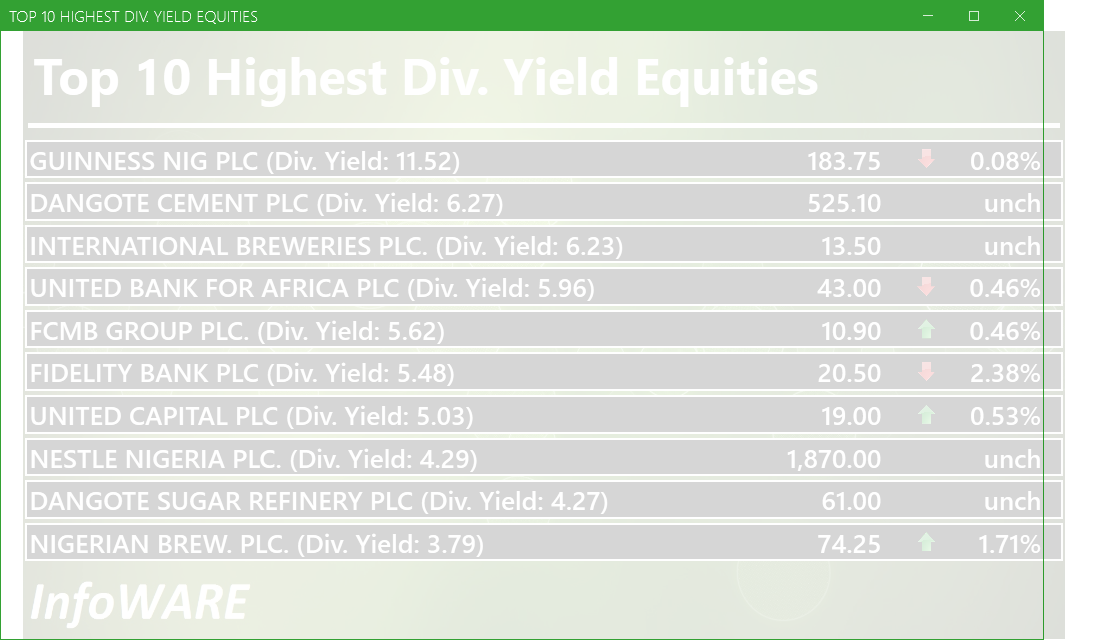
Investment Insights - High Div. Stocks
Dividend stocks distribute a portion of the company earnings to investors on a regular basis and they can a great choice for investors looking for regular income. As an investment or trading strategy, high dividend yield equities provide annual cash payments as against mostly capital gains in the price of a stock. The list in the table below represent the highest dividend paying stocks from the list of the most liquid stocks in the NSE top 30.
For more detailed analysis,
- On InfoWARE Market Data Terminal <HYIELD> <GO>
- On InfoWARE Finance Mobile App ( Android , iPhone & iPad and Windows 10) , "Research"
African Markets
| Name | LClose | Change | %Chg |
|---|---|---|---|
| BRVM Stock Exchange | 325.21 | 1.42 | 0.44 |
| Egyptian Exchange | 36,769.18 | 99.01 | 0.27 |
| Ghana Stock Exchange | 8,330.55 | 162.54 | 1.99 |
| Johannesburg Stock Exchange | 108,649.81 | 712.39 | 0.66 |
| Lusaka Stock Exchange | 25,239.39 | -2.52 | -0.01 |
| Casablanca Stock Exchange | 18,371.20 | -654.48 | -3.44 |
| Malawi Stock Exchange | 592,771.29 | 13,553.69 | 2.34 |
| Nairobi Securities Exchange | 178.16 | 1.41 | 0.80 |
| Namibian Stock Exchange | 1,928.47 | 5.77 | 0.30 |
| Rwanda Stock Exchange | 179.20 | 0.00 | 0.00 |
| Uganda Securities Exchange | 1,466.26 | -1.91 | -0.13 |
Nigeria Market Indexes
| Symbol | LClose | %Chg | WTD% | MTD% | QTD% | YTD% | MktCap | Trades |
|---|---|---|---|---|---|---|---|---|
| ASI | 142,979.44 | 0.19 | 0.42 | 0.00 | 0.00 | 38.57 | 30,726 | |
| NGX30 | 5,218.02 | 0.13 | 0.48 | 0.00 | 0.00 | 36.78 | 18,368 | |
| NGXAFRBVI | 3,549.58 | 0.65 | -0.01 | 0.00 | 0.00 | 43.08 | 6,551 | |
| NGXAFRHDYI | 22,260.41 | 0.38 | -0.14 | 0.00 | 0.00 | 30.73 | 7,254 | |
| NGXASEM | 1,538.10 | 0.00 | 0.00 | 0.00 | 0.00 | -2.88 | 5 | |
| NGXBNK | 1,516.75 | 0.17 | 0.04 | 0.00 | 0.00 | 39.48 | 9,740 | |
| NGXCG | 4,050.89 | 0.31 | 0.42 | 0.00 | 0.00 | 43.18 | 15,742 | |
| NGXCNSMRGDS | 3,382.79 | 0.35 | 0.17 | 0.00 | 0.00 | 95.05 | 3,836 | |
| NGXCOMMDTY | 1,121.85 | 0.01 | 1.81 | 0.00 | 0.00 | 12.18 | ||
| NGXGROWTH | 15,071.97 | -0.03 | 2.03 | 0.00 | 0.00 | 94.15 | 344 | |
| NGXINDUSTR | 5,067.83 | -0.02 | -0.12 | 0.00 | 0.00 | 41.89 | 2,505 | |
| NGXINS | 1,196.10 | 0.42 | 0.07 | 0.00 | 0.00 | 52.14 | 1,678 | |
| NGXLOTUSISLM | 11,871.16 | 0.11 | 1.18 | 0.00 | 0.00 | 70.37 | 5,428 | |
| NGXMAINBOARD | 7,044.70 | 0.25 | 0.73 | 0.00 | 0.00 | 40.78 | 22,861 | |
| NGXMERIGRW | 9,903.17 | 0.77 | -0.01 | 0.00 | 0.00 | 51.81 | 6,284 | |
| NGXMERIVAL | 13,368.02 | 0.05 | -0.97 | 0.00 | 0.00 | 28.16 | 8,080 | |
| NGXOILGAS | 2,525.98 | 0.12 | 3.78 | 0.00 | 0.00 | -6.83 | 406 | |
| NGXPENBRD | 2,651.11 | 0.18 | 0.52 | 0.00 | 0.00 | 44.74 | 25,680 | |
| NGXPENSION | 6,737.79 | 0.20 | 0.97 | 0.00 | 0.00 | 48.61 | 20,107 | |
| NGXPREMIUM | 13,691.66 | 0.06 | -0.17 | 0.00 | 0.00 | 40.67 | 7,521 | |
| NGXSOVBND | 657.27 | 0.00 | 0.00 | 0.00 | 0.00 | 9.26 | 0 |
For more detailed analysis,
- On InfoWARE Market Data Terminal <MKTINS> <GO>
- On InfoWARE Finance Mobile App ( Android, iPhone & iPad and Windows 10) , "Market Indexes"
Find the topic interesting? Will like to comment? Contact Us at solutions@infowarelimited.com
Top News

Chart Of The Day - ASI Chart Vs ASI Advance Decline Line (YTD) (02-Oct-2025 15:10:29.073)
InfoWARE AI Analyst Daily Market Report: 02-Oct-2025

[XNSA]>> RESIGNATION OF A DIRECTOR
[VETBANK]>> DAILY INDICATIVE PRICES
[VETBANK]>> DAILY INDICATIVE PRICES
[XNSA]>> LIFTING OF SUSPENSION OF INTERNATIONAL ENERGY INSURANCE PLC
[XNSA]>> APPOINTMENT OF A DIRECTOR
[XNSA]>> OFF MARKET TRADE
[XNSA]>> NGX FIXED INCOME INDICATIVE PRICE LIST FOR OCT 02, 2025
[XNSA]>> EXECUTIVE CAPACITY DEVELOPMENT COURSE ON NIGERIA CAPITAL MARKET
[XNSA]>> UPDATED- SAVE THE DATE: 29TH ANNUAL STOCKBROKERS CONFERENCE
[XNSA]>> AELP CAPACITY BUILDING & ASSDA FORUM
[SIAMLETF40]>> DAILY INDICATIVE PRICES
InfoWARE AI Analyst Daily Market Report: 30-Sep-2025
Chart Of The Day - ASI Chart Vs ASI Advance Decline Line (YTD) (30-Sep-2025 15:06:58.117)
InfoWARE AI Analyst Daily Market Report: 30-Sep-2025
[XNSA]>> DAILY FUND PRICE SUBMISSION - FCMB ASSET MANAGEMENT LIMITED
[XNSA]>> PUBLIC HOLIDAY
[VSPBONDETF]>> DAILY INDICATIVE PRICES
[XNSA]>> EXECUTIVE CAPACITY DEVELOPMENT COURSE ON NIGERIA CAPITAL MARKET
[XNSA]>> NGX FIXED INCOME INDICATIVE PRICE LIST FOR SEP 30, 2025
[XNSA]>> CORDROS MILESTONE FUNDS' BID & OFFER PRICES
[LOTUSHAL15]>> DAILY INDICATIVE PRICES
[XNSA]>> LISTING OF 14,143,244,747 ORDINARY SHARES OF WEMA BANK PLC
[XNSA]>> UPDATED- SAVE THE DATE: 29TH ANNUAL STOCKBROKERS CONFERENCE
[XNSA]>> AELP CAPACITY BUILDING & ASSDA FORUM
[SIAMLETF40]>> DAILY INDICATIVE PRICES
Chart Of The Day - ASI Chart Vs ASI Advance Decline Line (YTD) (29-Sep-2025 15:09:38.971)
InfoWARE AI Analyst Daily Market Report: 29-Sep-2025
[LOTUSHAL15]>> DAILY INDICATIVE PRICES
Get IDIA - the stock trading app for the modern investor
Solutions by Business
Product Suites
Company
Contacts
- 8th Floor,
- South Atlantic Petroleum Towers,
- 1 Adeola Odeku Street,
- Victoria Island,
- Lagos, Nigeria.
- Email: solutions@infowarelimited.com
Follow Us
 |
 |
 |
 |