


InfoWARE AI Analyst Daily Market Report: 03-Oct-2025 | InfoWARE Finance
Get IDIA - the stock trading app for the modern investor


InfoWARE AI Analyst Daily Market Report: 03-Oct-2025
(Source: InfoWARE Terminal, Date: 03-Oct-2025)
Dear Investor,
Market Summary: Friday, October 3, 2025
The NGX All Share Index (ASI) posted a +0.42% gain today, closing at 142,979.46, maintaining robust momentum with year-to-date returns at +39.16%. While the headline move was positive, trading volume fell to 528M (down -19.25% from yesterday), and market turnover dropped a sharp -30.71% to ₦17.00B. Advancers outnumbered decliners by 1.57x (44 vs 28), signaling bullish breadth, though volumes and value hinted at selective participation as the session ended ahead of the weekend.
Key Market Trends
- Market Breadth: 44 advancing stocks vs 28 decliners suggests a resilient, albeit selective, risk appetite.
- Volumes: While advances led declines, total market volume dropped and turnover shrank, pointing to a lack of conviction among institutional players or early positioning ahead of potential catalysts.
- Advance/Decline Volume Split: 71 stocks had rising volumes and 71 saw declines—a rare tie, highlighting sector and stock specificity rather than a market-wide rotation.
Top Market Gainers & Losers
| Gainers | % Change | Losers | % Change |
|---|---|---|---|
| UACN | +10.00% | GREENWETF | -10.00% |
| ENAMELWA | +9.97% | MERVALUE | -10.00% |
| ELLAHLAKES | +9.96% | JBERGER | -9.96% |
| PZ | +9.88% | THOMASWY | -9.50% |
| JOHNHOLT | -9.43% |
- UACN and ENAMELWA surged nearly 10%, backed by modest RSI (not overbought), suggesting possible continuation of momentum.
- GREENWETF collapsed -10%—ironically, despite also being a week’s top gainer. Large ETF swings may hint at erratic institutional rebalancing or arbitrage.
- MERISTEM VALUE ETF (MERVALUE) joined the loser ranks both daily and YTD, signaling a negative momentum cluster.
- PZ’s +9.88% gain was on exceptional volume—more than 655% above average—hinting at possible accumulation or short-covering.
- High volume and sharp drops in THOMASWY and JOHNHOLT point toward possible capitulation or large-holder exit.
Notable Volume/Technical Movers
- PZ (+655% volume): Strong price/volume combo. RSI is climbing but not extreme (57), MACD is positive. Possible fresh uptrend beginning.
- ETERNA: No daily price move, but volume at +301% of 90-day average—bulls/bears battling at a line in the sand; setup for a breakout next week.
- UBA (+186% volume, flat price): Massive churn but no price move—watch for directional breakout next session.
- TRIPPLE GEE (+576% volume, +8% price): Rare combination of price and volume >5x avg, suggesting strong conviction, possibly fueled by news or speculative activity.
- THOMASWY: Heavy selloff on huge volume, flagged as both daily and YTD loser. RSI remains neutral—possible oversold bounce ahead, but beware downtrend risk.
Bullish & Bearish Momentum Patterns
| Symbol | RSI | MACD | 15DMA vs 50DMA | Bullish/Bearish |
|---|---|---|---|---|
| UACN | 48.75 | -0.79 (negative, caution) | Above | Bullish |
| ELLAHLAKES | 48.20 | -0.16 | Above | Bullish |
| AIICO | 49.26 | 0.04 | Above | Bullish |
| JOHNHOLT | 56.14 | 0.29 | Below | Bearish |
| NEWGOLD | 55.97 | 596.9 | Below | Bearish |
- No stocks triggered classic overbought (RSI >70) or oversold (RSI < 30) levels, indicating "momentum with room to run.”
- Several gainers, incl. UACN and ELLAHLAKES, now trading above their 15DMA with positive or improving MACDs.
- Bearish momentum: JOHNHOLT & NEWGOLD have moved below 15DMA and are daily/YTD losers.
- Multiple overlaps: THOMASWY appears as daily loser, YTD loser, and with huge volume drop—deeply out of favor currently.
Contrarian Signals
- CHAMPION (RSI: 54.4, Bullish MACD, -9.8% YTD): Under the radar, possibly bottoming. Momentum is improving despite a poor year; mispriced opportunity?
- GREENWETF: Daily top loser but also YTD and 5D gainer, and RSI recovering—possible short-term panic or ETF rebalancing?
- JOHNHOLT: Under bearish pressure but sporting a 56 RSI and positive MACD—if selling is exhausted, a reversal bounce could be brewing.
- MERGROWTH ETF: Crossed above its 15DMA despite institutional outflows from sister fund MERVALUE—rotation or arbitrage play?
Sector Heatmaps
| Sector | Average %Chg | Leaders | Laggards | Notable Technicals |
|---|---|---|---|---|
| Banking | +0.6% | ACCESSCORP, UBA | FCMB | Volume spikes in UBA; ACCESSCORP: above 15DMA |
| Personal/Household | +9.88% | PZ | – | PZ: Massive volume (accumulation?) |
| Diversified Industries | +10.00% | UACN | JOHNHOLT | UACN above 15DMA; JOHNHOLT below |
| Insurance | +4.8% | AIICO | – | AIICO above 15DMA, bullish |
| ETF | Mixed | MERGROWTH | MERVALUE, GREENWETF, NEWGOLD | ETF sector highly volatile, divergence between value and growth |
- Financials (Banking, Insurance) saw the most institutional action, while Consumer and Diversified benefited from strong retail flows.
Dividend-Beta Matrix
| Stock | Dividend Yield | Beta | Momentum Status | Note |
|---|---|---|---|---|
| AIICO | 4.13% | 1.33 | Bullish | Strong defensive yield but high beta – good for yield-seeking risk-takers |
| RTBRISCOE | 4.35% | -0.16 | Bullish | High yield, very low beta, bullish momentum |
| JOHNHOLT | 1.25% | -0.20 | Bearish | Yield may not compensate for technical weakness |
| PZ | – | 0.55 | Bullish | Low beta, surging on volume – likely defensive inflow |
- Defensive plays: AIICO and RTBRISCOE combine high yields with bullish signals; attractive for volatility-adjusted portfolios.
- Caution: JOHNHOLT’s yield is not enough to offset the clear technical breakdown.
Institutional Clustering Alerts
- ZENITHBANK: 20.17% of all institutional traded value. This is far higher than the next most traded (ACCESSCORP: 10.18%). Watch for directional cues; heavy clustering may foreshadow block moves or portfolio rebalancing.
- UBA: Institutional value and volume surges, but price is flat—implies distribution or latent accumulation (watch for sharp price movement next week).
- ARADEL: Institutional action well above sector norm (+16.1% 5D); unusual for oil sector—potential smart-money play.
Trader Suggestions & Opportunities
- Momentum Buys: UACN, ELLAHLAKES, AIICO, PZ (all above 15DMA, solid price action, improving MACDs)
- Defensive Picks: AIICO, RTBRISCOE for their higher yield and technical strength in a mixed volume environment
- Contrarian Plays: Watch CHAMPION for mean reversion; tight stop suggested.
- ETF Opportunities: MERGROWTH’s bullish technicals and MERVALUE’s capitulation offer a potential rotation or pair trade.
- Caution: Stalling turnover and institutional reluctance may point to coming volatility—avoid overexposure.
YTD Top Gainers and Losers
| Top 5 YTD Gainers | YTD %Chg | YTD Losers | YTD %Chg |
|---|---|---|---|
| ELLAHLAKES | +347.5% | MERVALUE | -19.24% |
| NEIMETH | +168.9% | JBERGER | -20.84% |
| AIICO | +156.7% | JOHNHOLT | -7.57% |
| SOVRENINS | +123.6% | THOMASWY | -9.50% |
| PZ | +71.6% | UNIONDICON | +12.50% |
- Overlap Alert: ELLAHLAKES, AIICO, and PZ are both daily/week’s top gainers and YTD outperformers—suggesting sustainable bullish drivers.
- Serial Laggards: JOHNHOLT and THOMASWY are both on today’s loser list and among YTD’s bottom dwellers.
- Greenwich ETF (GREENWETF): Despite being a top 5-day gainer, it’s a major YTD loser, reflecting the erratic performance within the ETF space.
Market Activity & Trades: Institutional vs Retail
| Investor Type | Trade Count | % of Total Trades | Total Volume | % of Total Volume | Total Value | % of Value |
|---|---|---|---|---|---|---|
| Institutional | 1,801 | 37.84% | 376M | 69.02% | ₦17.68B | 90.03% |
| Retail | 25,313 | 62.16% | 169M | 30.98% | ₦1.96B | 9.97% |
- Institutions contributed most of the value and volume with much fewer trades—clear evidence of large block transactions, primarily in financials.
- Retail activity was vast but focused on lower-value and more liquid counters, with focus on STERLING, ACCESSCORP, ZENITHBANK, GTCO, and MTNN.
- ZENITHBANK: ₦2.0B value, 28.5M shares (strong institutional clustering)
- ACCESSCORP: ₦1.9B value, 68.7M shares (momentum strong)
- UBA: ₦3.4B value, 78M shares (highest volume, but no price move)
- GTCO: ₦3.3B value, 34M shares
- ARADEL: ₦2.3B value, stand-out volume for oil sector
- STERLINGNG: ₦82.9M value, 10.0M shares
- MTNN: ₦75.5M, 0.17M shares
- ACCESSCORP: ₦76.8M, 2.9M shares (both retail/institutional interest)
- ZENITHBANK (₦92.0M, 1.3M shares)
- GTCO (₦66.7M, 0.69M shares)
- Where retail and institutional interests overlap (especially ACCESSCORP, ZENITHBANK, and GTCO), price moves may be more pronounced next week.
- Institutional clustering in the top banks often precedes sector-wide moves—watch the Banking and Financial sector indices closely.
Hidden Insights & Subtle Patterns
- ETF Behavior: The wild swings in GREENWETF and MERVALUE, combined with MERGROWTH’s breakout, signal ongoing institutional reshuffling between value and growth; retail investors should use stop-loss orders for any ETF bets.
- Yield/Volatility Paradox: RTBRISCOE sports high dividend yield and negative beta—suitable for risk-off periods, yet also appears in bullish momentum scans.
- 15DMA Crosses: Stocks crossing above 15DMA (UACN, ELLAHLAKES, PZ, AIICO) on volume see multi-day continuity; carving out new short-term uptrends.
- High-volume flat traders (UBA): Suggests waiting for a decisive move—not a good idea to pre-emptively scale in/out.
- Unusual pattern: Simultaneous daily and YTD losers (JOHNHOLT, THOMASWY) on big volume can sometimes foretell a capitulation bottom in small/microcaps.
Trader’s Actionables
- For swing traders: UACN, ELLAHLAKES, and AIICO have bullish setups and can run further; but tight stops are crucial as macro volume trends are weakening.
- Value/income seekers: Focus on AIICO and RTBRISCOE (yields + bullish technicals) but steer clear of high-yielders in downtrends (JOHNHOLT).
- Punters/speculators: GREENWETF and MERGROWTH offer volatility and liquidity, but require strict risk controls given ETF unpredictability.
Overall, while market breadth is healthy and select stocks/sectors are breaking out on volume, the contraction in turnover and value signals a need for caution at current levels. Watch for next week’s opening for follow-through or reversal patterns, especially where institutional and retail flows intersect.
|
Top ASI Gainers Over Last 5 Trading Days
|
Top ASI Losers Over Last 5 Trading Days
|
For more detailed analysis, on InfoWARE Market Data Terminal <NSEPERF> <GO>
On InfoWARE Finance Mobile App (Android, iPhone & iPad, Windows Phone and Windows 8/10), "Top Gainers & Losers"
U A C N PLC. (UACN) topped the advancers list closing at N73.70 with a gain of 10.00% followed by GREENWICH ASSET ETF (GREENWETF) which closed at N255.43 with a gain of 10.00%.
On the flip side NEWGOLD EXCHANGE TRADED FUND (ETF) (NEWGOLD) and MERISTEM VALUE EXCHANGE TRADED FUND (MERVALUE) topped the decliners log with a loss of -11.21% at a close of N51,501.01, and -10.00% to close the day at N161.28 respectively.
| Symbol | LClose | %Chg |
|---|---|---|
| UACN | 73.70 | 10.00 |
| GREENWETF | 255.43 | 10.00 |
| ENAMELWA | 42.45 | 9.97 |
| ELLAHLAKES | 13.47 | 9.96 |
| PZ | 41.70 | 9.88 |
For more detailed analysis,
- On InfoWARE Market Data Terminal <TOPG> <GO>
- On InfoWARE Finance Mobile App ( Android, iPhone & iPad and Windows 10) , "Top Gainers & Losers"
Currency Market
In the currency market, the Naira was unchanged against the dollar at 1 to 1Investment Insights - Top 5 Gainers YTD
These stocks are the best performers whose price has risen faster than the market as a whole with the best returns year to date. Momentum investors believe that stocks that have outperformed the market will often continue to do so because the factors that caused them to outperform will not suddenly disappear. In addition, other investors seeking to benefit from the stock’s outperformance will often purchase the stock, further bidding its price higher and pushing the stock higher still
For more detailed analysis,
- On InfoWARE Market Data Terminal <T5YTD2> <GO>
- On InfoWARE Finance Mobile App ( Android , iPhone & iPad and Windows 10) , "Research"
NSE: Bull Signal - Price crossed above 15 Day MA
This signal implies these stocks are under buying pressure and the price might continue to rise and therefore positions should be monitored closely. Further suggested analysis include looking at the overall market (ASI) to see if the uptrend is market wide, sector wide or specific to the stock. Portfolio managers tend to use this as a signal to do more research to add to their positions or lock in some profits. Typically further analysis should be done using commands like PC and RV on the InfoWARE Market Data Terminal. Another command is ALERTS to set price triggers for possible exit or entry as necessary
For more detailed analysis,
- On InfoWARE Market Data Terminal <NSEPERF> <GO>
- On InfoWARE Finance Mobile App ( Android , iPhone & iPad and Windows 10) , "Top Gainers & Losers"
| Symbol | Price | %Chg | 15DMA | PE | EPS | DivY | MktCap | Vol | Trades | Value | LstTradeTime |
|---|---|---|---|---|---|---|---|---|---|---|---|
| FGS202766 | 125.00 | 20.00 | 101.80 | 0.00 | 0.00 | 45.22K | 1.00 | 56.53M | 03-Oct-2025 14:30:17.467 | ||
| UACN | 73.70 | 9.09 | 68.11 | 9.38 | 2.35 | 1.00 | 215.66B | 1.04M | 101.00 | 75.51M | 03-Oct-2025 14:30:31.877 |
| ELLAHLAKES | 13.47 | 9.06 | 12.80 | 0.00 | 0.00 | 0.00 | 26.94B | 25.95M | 640.00 | 337.65M | 03-Oct-2025 14:30:12.587 |
| BERGER | 39.70 | 8.82 | 38.86 | 14.18 | 1.22 | 1.15 | 11.51B | 381.89K | 71.00 | 14.91M | 03-Oct-2025 14:30:10.260 |
| AIICO | 4.03 | 8.44 | 3.91 | 2.01 | 0.60 | 4.13 | 147.52B | 18.45M | 509.00 | 71.65M | 03-Oct-2025 14:30:31.797 |
| MAYBAKER | 17.30 | 8.38 | 16.87 | 58.94 | 0.14 | 3.75 | 29.85B | 1.02M | 108.00 | 17.16M | 03-Oct-2025 14:30:13.333 |
| LEGENDINT | 5.60 | 8.21 | 5.37 | 0.00 | 0.00 | 872.36K | 41.00 | 4.79M | 03-Oct-2025 14:30:13.220 | ||
| RTBRISCOE | 3.67 | 8.17 | 3.57 | 0.00 | 0.00 | 4.35 | 4.32B | 716.51K | 74.00 | 2.51M | 03-Oct-2025 14:30:14.007 |
| HMCALL | 4.44 | 7.66 | 4.17 | 0.00 | 0.00 | 0.00 | 0.00 | 1.17M | 48.00 | 4.82M | 03-Oct-2025 14:30:12.943 |
| LIVESTOCK | 7.90 | 7.59 | 7.78 | 0.00 | 0.00 | 2.94 | 23.70B | 745.24K | 95.00 | 5.72M | 03-Oct-2025 14:30:13.287 |
| MERGROWTH | 429.00 | 7.23 | 402.05 | 0.00 | 0.00 | 121.00 | 3.00 | 51.91K | 03-Oct-2025 14:30:32.143 | ||
| CADBURY | 67.90 | 5.45 | 66.01 | 33.25 | 0.64 | 1.88 | 127.53B | 774.27K | 296.00 | 50.65M | 03-Oct-2025 14:30:10.350 |
| CHAMPION | 15.85 | 4.73 | 15.52 | 412.83 | 0.01 | 0.41 | 124.10B | 3.59M | 230.00 | 55.96M | 03-Oct-2025 14:30:10.420 |
| VETBANK | 15.20 | 4.61 | 14.86 | 0.00 | 0.00 | 5.00 | 1.00 | 76.00 | 03-Oct-2025 14:30:32.203 | ||
| ROYALEX | 2.20 | 3.18 | 2.16 | 0.00 | 0.00 | 7.81 | 11.32B | 6.05M | 149.00 | 13.73M | 03-Oct-2025 14:30:13.987 |
| CUTIX | 3.51 | 3.13 | 3.48 | 8.81 | 0.26 | 6.52 | 12.36B | 4.79M | 231.00 | 16.61M | 03-Oct-2025 14:30:31.810 |
| ACCESSCORP | 26.50 | 2.64 | 26.11 | 8.56 | 2.81 | 1.87 | 941.95B | 71.74M | 1,302.00 | 1.87B | 03-Oct-2025 14:30:32.270 |
| WAPCO | 126.50 | 1.19 | 125.39 | 24.60 | 2.87 | 2.70 | 2,037.64B | 3.27M | 244.00 | 413.17M | 03-Oct-2025 14:30:32.370 |
| CWG | 16.90 | 1.18 | 16.89 | 0.00 | 0.00 | 2.46 | 42.67B | 1.66M | 104.00 | 27.81M | 03-Oct-2025 14:30:12.447 |
| NGXMERIGRW | 10,007.11 | 1.04 | 9,913.62 | 34.89 | 293.99 | 0.00 | 0.00 | 57.42M | 5,098.00 | 2.35B | 03-Oct-2025 14:30:18.277 |
| HONYFLOUR | 21.95 | 0.91 | 21.72 | 16.28 | 0.31 | 1.40 | 174.07B | 1.11M | 315.00 | 24.23M | 03-Oct-2025 14:30:12.960 |
| NGXMERIVAL | 13,485.46 | 0.87 | 13,478.40 | 12.13 | 38.38 | 0.00 | 0.00 | 208.25M | 5,965.00 | 8.30B | 03-Oct-2025 14:30:18.290 |
| NGXPREMIUM | 13,725.92 | 0.25 | 13,703.09 | 2,048.74 | 238.70 | 0.00 | 0.00 | 186.09M | 6,067.00 | 8.37B | 03-Oct-2025 14:30:18.343 |
NSE: BEAR Signal - Price crossed below 15 Day MA
This signal implies these stocks are under selling pressure and the price might continue to slide and therefore positions should be monitored closely. Further suggested analysis include looking at the overall market (ASI) to see if the downtrend is market wide, sector wide or specific to the stock. If the overal market trend is upwards, then since these stocks are heading in the opposite direction, then further analysis should be done using commands like PC and RV on the InfoWARE Market Data Terminal. Another command is ALERTS to set price triggers for possible exit is necessar
For more detailed analysis,
- On InfoWARE Market Data Terminal <BEARM> <GO>
- On InfoWARE Finance Mobile App ( Android , iPhone & iPad and Windows 10)
| Symbol | Price | %Chg | 15DMA | PE | EPS | DivY | MktCap | Vol | Trades | Value | LstTradeTime |
|---|---|---|---|---|---|---|---|---|---|---|---|
| FG162029S1 | 98.00 | 0.00 | 98.13 | 0.00 | 65.40B | 0.00 | 0.00 | 0.00 | 03-Oct-2025 14:30:16.583 | ||
| VFDGROUP | 10.75 | -1.40 | 10.88 | 0.00 | 0.00 | 0.00 | 0.00 | 4.15M | 195.00 | 44.57M | 03-Oct-2025 14:30:14.603 |
| FCMB | 10.70 | -1.87 | 10.74 | 104.31 | 0.09 | 5.62 | 211.89B | 13.31M | 376.00 | 139.66M | 03-Oct-2025 14:30:12.730 |
| DAARCOMM | 1.03 | -6.80 | 1.09 | 0.00 | 0.00 | 0.00 | 12.36B | 2.32M | 80.00 | 2.53M | 03-Oct-2025 14:30:12.473 |
| JOHNHOLT | 7.20 | -10.42 | 7.87 | 8.80 | 0.91 | 1.25 | 2.80B | 320.99K | 16.00 | 2.34M | 03-Oct-2025 14:30:13.150 |
| NEWGOLD | 51,501.01 | -12.62 | 53,488.08 | 0.00 | 0.00 | 0.00 | 0.00 | 16.00 | 6.00 | 904.15K | 03-Oct-2025 14:30:32.167 |
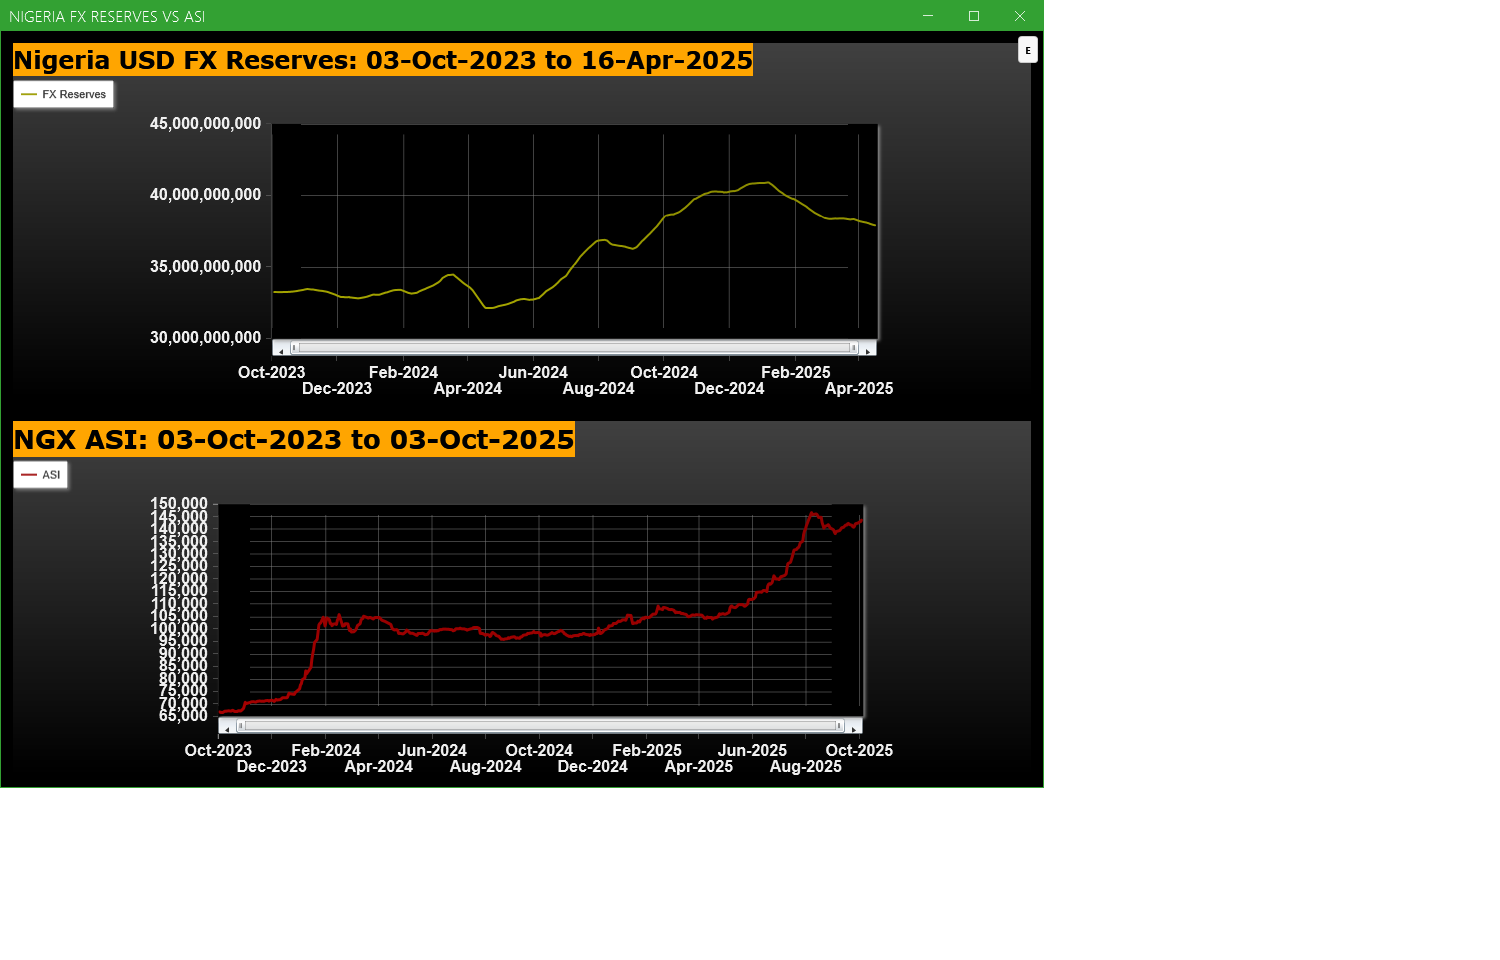
Economic Indicators - Nigeria FX Reserves Vs ASI Chart
Nigeria FX Reserves are assets held on reserve by CBN in foreign currencies. These reserves are used to back liabilities and influence monetary policy. Given the nature of the Nigeria economy, FX Reserves can appear to have an outsize influence on the economy and hence on the capital market. The chart below allows comparison of FX Reserves against the ASI to make investment decisions
For more detailed analysis,
- On InfoWARE Market Data Terminal <CI> <GO>
- On InfoWARE Finance Mobile App ( Android , iPhone & iPad and Windows 10) , "Research"
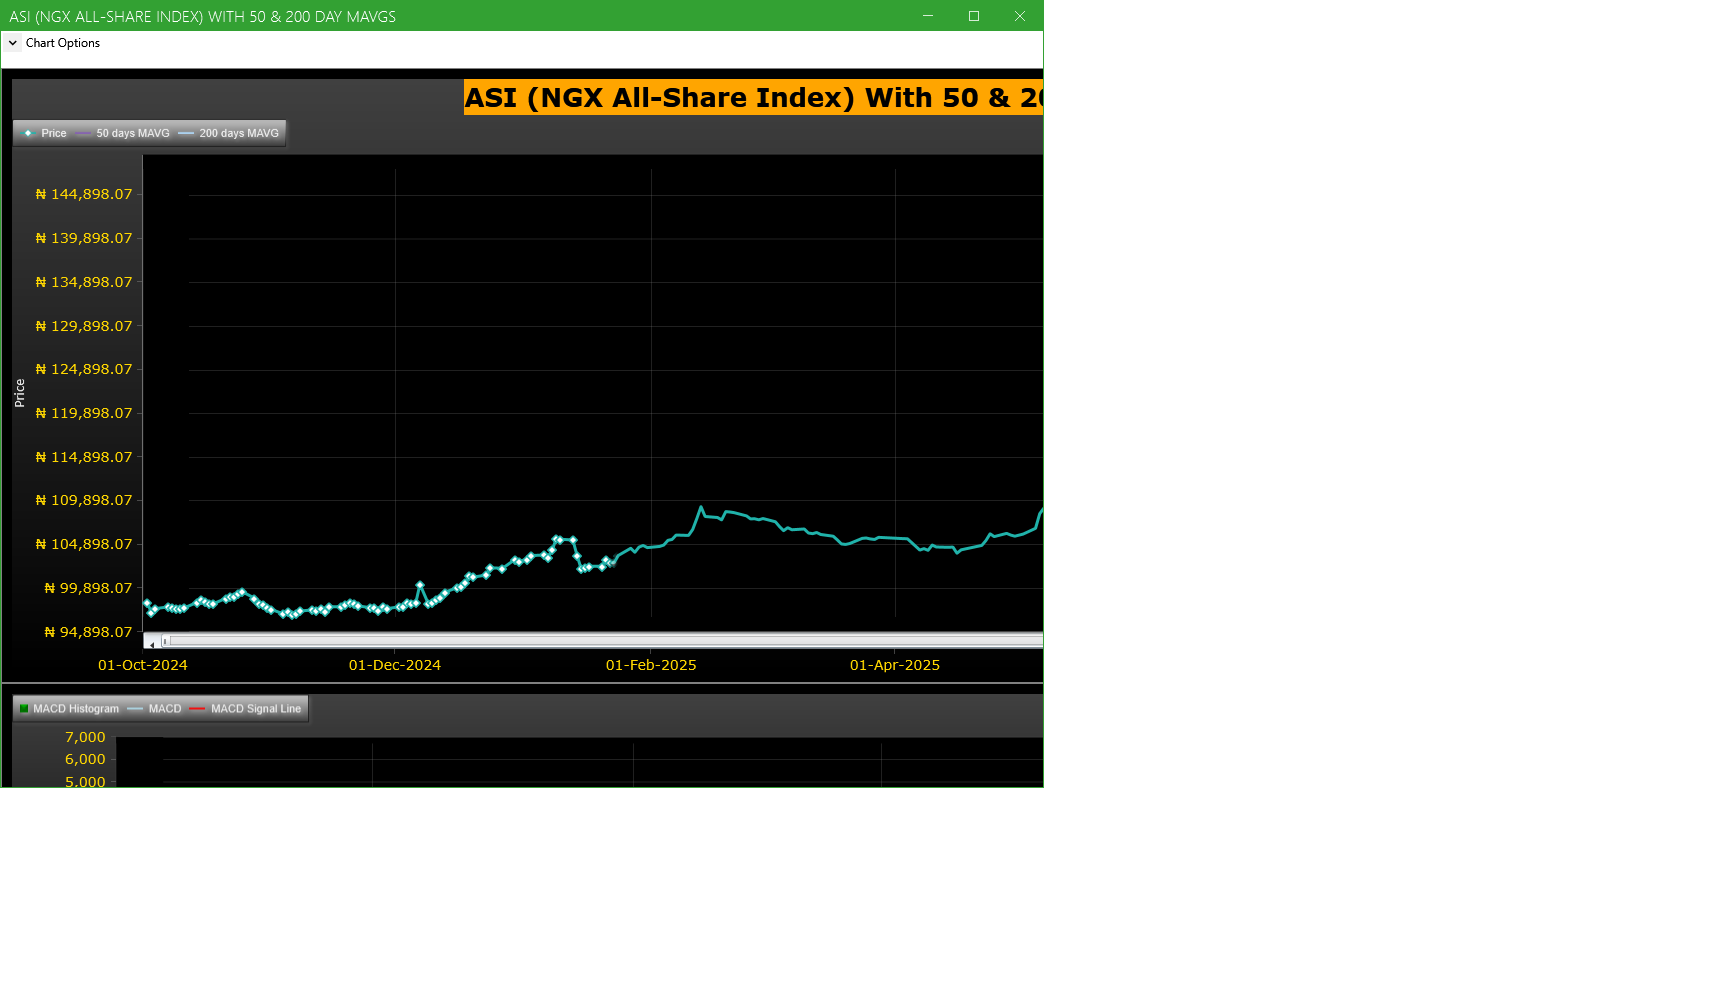
Market Trend - ASI (NGX All-Share-Index) With 50 & 200 Day MAvgs Chart
Technical traders typically use the 50 & 200 day moving averages to aid in choosing
where to enter or exit a position, which then causes these levels to act as strong
support or resistance. As a general guideline, if the price is above a moving average,
the trend is up. If the price is below a moving average, the trend is down.
It is important to note that critics of technical analysis say that moving averages act
as support and resistance because so many traders use these indicators to inform their
trading decisions. Also moving averages tend to work quite well in strong trending conditions
but poorly in choppy or ranging conditions.
Trading Strategies: Crossovers
Crossovers are one of the main moving average strategies. The first type is a price crossover,
which is when the price crosses above or below a moving average to signal a potential change
in trend. Another strategy is to apply two moving averages to a chart: one longer and one
shorter. When the shorter-term MA crosses above the longer-term MA, it is a buy signal, as
it indicates that the trend is shifting up. This is known as a golden cross. Meanwhile, when
the shorter-term MA crosses below the longer-term MA, it is a sell signal, as it indicates that
the trend is shifting down. This is known as a dead/death cross
For more detailed analysis,
- On InfoWARE Market Data Terminal <CI> <GO>
- On InfoWARE Finance Mobile App ( Android , iPhone & iPad and Windows 10) , "Research"
Unusual Volume: Volume traded is more than double the 90 day moving average (All exchanges; ASI & ASem). For more detailed analysis,
- On InfoWARE Market Data Terminal <UV> <GO>
- On InfoWARE Finance Mobile App ( Android , iPhone & iPad and Windows 10)
| Symbol | Name | Volume | 90DAvgVol | %VolChg | Price | LClose | %Chg | Trades | Value |
|---|---|---|---|---|---|---|---|---|---|
| UBA | UNITED BANK FOR AFRICA PLC | 80.10M | 27.97M | 186.39 | 43.00 | 43.00 | 0.00 | 1,142 | 3.44B |
| PZ | P Z CUSSONS NIGERIA PLC. | 21.29M | 2.82M | 655.62 | 41.70 | 37.95 | 9.88 | 535 | 885.99M |
| THOMASWY | THOMAS WYATT NIG. PLC. | 3.24M | 1.47M | 119.43 | 3.24 | 3.58 | -9.50 | 33 | 10.51M |
| ETERNA | ETERNA PLC. | 1.43M | 356.58K | 301.63 | 37.05 | 37.05 | 0.00 | 263 | 53.39M |
| TRIPPLEG | TRIPPLE GEE AND COMPANY PLC. | 1.18M | 174.48K | 576.44 | 6.05 | 5.60 | 8.04 | 38 | 6.51M |
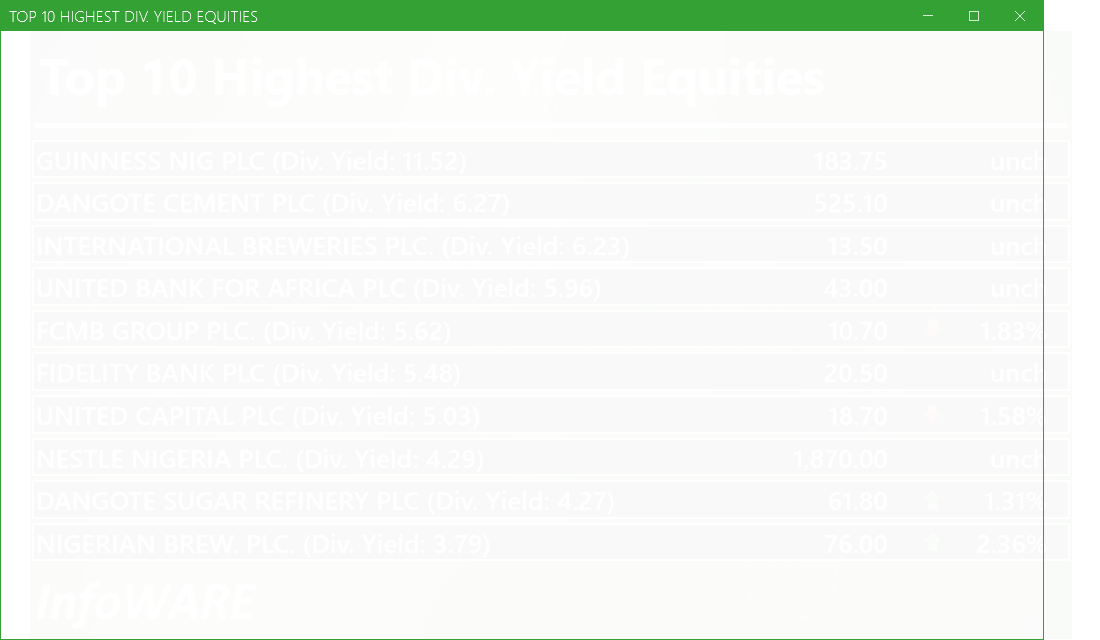
Investment Insights - High Div. Stocks
Dividend stocks distribute a portion of the company earnings to investors on a regular basis and they can a great choice for investors looking for regular income. As an investment or trading strategy, high dividend yield equities provide annual cash payments as against mostly capital gains in the price of a stock. The list in the table below represent the highest dividend paying stocks from the list of the most liquid stocks in the NSE top 30.
For more detailed analysis,
- On InfoWARE Market Data Terminal <HYIELD> <GO>
- On InfoWARE Finance Mobile App ( Android , iPhone & iPad and Windows 10) , "Research"
Investment Insights - Stocks outperforming the ASI but with approximately the same risk
These list of stocks represent equities that are less risky than the ASI but doing better than the ASI (All Shares Index) using the YTD (Year to Date) returns as the measure. The risk is measured by Beta. Beta is an assessment of a stock's tendency to undergo price changes, (its volatility), as well as its potential returns compared to the ASI. It is expressed as a ratio, where a score of 1 represents performance comparable to the ASI, and returns above or below the market may receive scores greater or lower than 1.
For a full list of both positively and negatively corelated stocks visit InfoWARE Market Data Terminal
- On InfoWARE Market Data Terminal <BANL> <GO>
- On InfoWARE Finance Mobile App ( Android , iPhone & iPad and Windows 10)
| Symbol | DivYield | PE | EPS | Beta | %ChgYTD | ASIYTDReturn | BetaDiff |
|---|---|---|---|---|---|---|---|
| HONYFLOUR | 1.40 | 16.28 | 0.31 | 0.99 | 217.20 | 39.16 | 0.01 |
| CAVERTON | 5.52 | 1.15 | 1.57 | 0.98 | 165.49 | 39.16 | 0.02 |
| ROYALEX | 7.81 | 0.00 | 0.00 | 0.96 | 100.00 | 39.16 | 0.04 |
| CORNERST | 5.28 | 8.62 | 0.35 | 0.93 | 52.78 | 39.16 | 0.07 |
| VERITASKAP | 4.17 | 48.77 | 0.02 | 0.88 | 40.27 | 39.16 | 0.12 |
| UNIVINSURE | 0.00 | 0.00 | 0.00 | 0.83 | 59.72 | 39.16 | 0.17 |
| FTNCOCOA | 1.60 | 0.00 | 0.00 | 0.79 | 208.51 | 39.16 | 0.21 |
| NB | 3.79 | 16.95 | 1.60 | 0.79 | 137.50 | 39.16 | 0.21 |
| MAYBAKER | 3.75 | 58.94 | 0.14 | 0.78 | 84.04 | 39.16 | 0.22 |
| UNILEVER | 2.81 | 67.09 | 0.40 | 0.75 | 105.56 | 39.16 | 0.25 |
African Markets
| Name | LClose | Change | %Chg |
|---|---|---|---|
| BRVM Stock Exchange | 325.21 | 1.42 | 0.44 |
| Egyptian Exchange | 36,769.18 | 99.01 | 0.27 |
| Ghana Stock Exchange | 8,330.55 | 162.54 | 1.99 |
| Johannesburg Stock Exchange | 108,649.81 | 712.39 | 0.66 |
| Lusaka Stock Exchange | 25,239.39 | -2.52 | -0.01 |
| Casablanca Stock Exchange | 18,371.20 | -654.48 | -3.44 |
| Malawi Stock Exchange | 592,771.29 | 13,553.69 | 2.34 |
| Nairobi Securities Exchange | 178.16 | 1.41 | 0.80 |
| Namibian Stock Exchange | 1,928.47 | 5.77 | 0.30 |
| Rwanda Stock Exchange | 179.20 | 0.00 | 0.00 |
| Uganda Securities Exchange | 1,466.26 | -1.91 | -0.13 |
Nigeria Market Indexes
| Symbol | LClose | %Chg | WTD% | MTD% | QTD% | YTD% | MktCap | Trades |
|---|---|---|---|---|---|---|---|---|
| ASI | 143,584.04 | 0.42 | 0.85 | 0.42 | 0.42 | 39.16 | 25,524 | |
| NGX30 | 5,234.97 | 0.32 | 0.81 | 0.32 | 0.32 | 37.23 | 14,170 | |
| NGXAFRBVI | 3,569.14 | 0.55 | 0.54 | 0.55 | 0.55 | 43.87 | 5,323 | |
| NGXAFRHDYI | 21,967.79 | -1.31 | -1.46 | -1.31 | -1.31 | 29.01 | 5,675 | |
| NGXASEM | 1,538.10 | 0.00 | 0.00 | 0.00 | 0.00 | -2.88 | 3 | |
| NGXBNK | 1,526.68 | 0.65 | 0.69 | 0.65 | 0.65 | 40.39 | 7,082 | |
| NGXCG | 4,071.66 | 0.51 | 0.94 | 0.51 | 0.51 | 43.91 | 12,857 | |
| NGXCNSMRGDS | 3,401.32 | 0.55 | 0.72 | 0.55 | 0.55 | 96.11 | 3,513 | |
| NGXCOMMDTY | 1,134.31 | 1.11 | 2.94 | 1.11 | 1.11 | 13.43 | ||
| NGXGROWTH | 15,057.59 | -0.10 | 1.93 | -0.10 | -0.10 | 93.97 | 328 | |
| NGXINDUSTR | 5,077.71 | 0.20 | 0.07 | 0.20 | 0.20 | 42.17 | 1,994 | |
| NGXINS | 1,212.76 | 1.39 | 1.47 | 1.39 | 1.39 | 54.26 | 1,873 | |
| NGXLOTUSISLM | 11,981.46 | 0.93 | 2.12 | 0.93 | 0.93 | 71.95 | 4,303 | |
| NGXMAINBOARD | 7,080.82 | 0.51 | 1.25 | 0.51 | 0.51 | 41.50 | 19,129 | |
| NGXMERIGRW | 10,007.11 | 1.05 | 1.04 | 1.05 | 1.05 | 53.41 | 5,098 | |
| NGXMERIVAL | 13,485.46 | 0.88 | -0.10 | 0.88 | 0.88 | 29.29 | 5,965 | |
| NGXOILGAS | 2,585.15 | 2.34 | 6.21 | 2.34 | 2.34 | -4.65 | 562 | |
| NGXPENBRD | 2,662.60 | 0.43 | 0.96 | 0.43 | 0.43 | 45.37 | 20,986 | |
| NGXPENSION | 6,761.62 | 0.35 | 1.33 | 0.35 | 0.35 | 49.13 | 16,036 | |
| NGXPREMIUM | 13,725.92 | 0.25 | 0.08 | 0.25 | 0.25 | 41.03 | 6,067 | |
| NGXSOVBND | 657.27 | 0.00 | 0.00 | 0.00 | 0.00 | 9.26 | 0 |
For more detailed analysis,
- On InfoWARE Market Data Terminal <MKTINS> <GO>
- On InfoWARE Finance Mobile App ( Android, iPhone & iPad and Windows 10) , "Market Indexes"
Find the topic interesting? Will like to comment? Contact Us at solutions@infowarelimited.com
Top News

InfoWARE AI Analyst Weekly Market Report: 03-Oct-2025
Chart Of The Day - ASI Chart Vs ASI Advance Decline Line (YTD) (03-Oct-2025 15:07:03.919)
InfoWARE AI Analyst Daily Market Report: 03-Oct-2025

[XNSA]>> CORDROS MILESTONE FUNDS' BID & OFFER PRICES
[VETINDETF]>> DAILY INDICATIVE PRICES
[XNSA]>> CLOSING GONG CEREMONY BY ZENITH BANK PLC
[XNSA]>> CHANGE OF COMPANY NAME (PEACE CAPITAL MARKET LIMITED)
[XNSA]>> EXECUTIVE CAPACITY DEVELOPMENT COURSE ON NIGERIA CAPITAL MARKET
[LOTUSHAL15]>> DAILY INDICATIVE PRICES
[XNSA]>> NGX FIXED INCOME INDICATIVE PRICE LIST FOR OCT 03, 2025
[XNSA]>> UPDATED- SAVE THE DATE: 29TH ANNUAL STOCKBROKERS CONFERENCE
[XNSA]>> AELP CAPACITY BUILDING & ASSDA FORUM
[SIAMLETF40]>> DAILY INDICATIVE PRICES
Chart Of The Day - ASI Chart Vs ASI Advance Decline Line (YTD) (02-Oct-2025 15:10:29.073)
InfoWARE AI Analyst Daily Market Report: 02-Oct-2025
[XNSA]>> RESIGNATION OF A DIRECTOR
[VETBANK]>> DAILY INDICATIVE PRICES
[VETBANK]>> DAILY INDICATIVE PRICES
[XNSA]>> LIFTING OF SUSPENSION OF INTERNATIONAL ENERGY INSURANCE PLC
[XNSA]>> APPOINTMENT OF A DIRECTOR
[XNSA]>> OFF MARKET TRADE
[XNSA]>> NGX FIXED INCOME INDICATIVE PRICE LIST FOR OCT 02, 2025
[XNSA]>> EXECUTIVE CAPACITY DEVELOPMENT COURSE ON NIGERIA CAPITAL MARKET
[XNSA]>> UPDATED- SAVE THE DATE: 29TH ANNUAL STOCKBROKERS CONFERENCE
[XNSA]>> AELP CAPACITY BUILDING & ASSDA FORUM
[SIAMLETF40]>> DAILY INDICATIVE PRICES
InfoWARE AI Analyst Daily Market Report: 30-Sep-2025
Chart Of The Day - ASI Chart Vs ASI Advance Decline Line (YTD) (30-Sep-2025 15:06:58.117)
InfoWARE AI Analyst Daily Market Report: 30-Sep-2025
[XNSA]>> DAILY FUND PRICE SUBMISSION - FCMB ASSET MANAGEMENT LIMITED
Get IDIA - the stock trading app for the modern investor
Solutions by Business
Product Suites
Company
Contacts
- 8th Floor,
- South Atlantic Petroleum Towers,
- 1 Adeola Odeku Street,
- Victoria Island,
- Lagos, Nigeria.
- Email: solutions@infowarelimited.com
Follow Us
 |
 |
 |
 |