


InfoWARE AI Analyst Daily Market Report: 13-Mar-2025 | InfoWARE Finance
Get IDIA - the stock trading app for the modern investor


InfoWARE AI Analyst Daily Market Report: 13-Mar-2025
(Source: InfoWARE Terminal, Date: 13-Mar-2025)
Dear Investor,
Today, the Nigerian Stock Exchange (NGX) experienced a modest uptick, with the All Share Index (ASI) rising by 0.12% to close at 106,090.38. Year-to-date, the ASI has returned 2.95%. Notably, market turnover surged by 54.05% to 14.88 billion Naira, indicating increased trading activity. Market breadth was positive, with 38 advancers outpacing 20 decliners, reflecting a healthy interest in various stocks.
- Market Breadth: The market breadth stood at 1.90x, with 38 advancers and 20 decliners, suggesting a bullish sentiment among investors.
- Top Gainers:
- NEWGOLD EXCHANGE TRADED FUND (ETF) (NEWGOLD): Closed at 47,999.99, up 23.08%. This ETF has shown strong momentum with an RSI of 47.64.
- UPDC PLC: Closed at 2.77, down 9.92%. Despite a bearish day, its RSI remains at 43.24.
- INTERNATIONAL BREWERIES PLC: Closed at 5.70, up 9.62%, with a stable RSI of 43.20.
- Top Losers:
- UNIVERSITY PRESS PLC (UPL): Closed at 4.32, down 10.00%, with an RSI of 52.08.
- ACADEMY PRESS PLC: Closed at 2.62, down 9.66%, RSI at 48.57.
- RED STAR EXPRESS PLC: Closed at 5.35, down 9.32%, RSI at 45.97.
Insights and Predictions
- Turnover Increase: The significant increase in market turnover suggests heightened investor interest, potentially indicating a bullish trend.
- Advancing vs. Declining Stocks: The ratio of advancing to declining stocks (1.90x) indicates a strong bullish sentiment, which may continue if this trend persists.
- Unusual Volume Movements: Stocks like TANTALIZER and GEREGU showed unusual volume, indicating potential trading opportunities.
- YTD Trends: The top gainers and losers year-to-date show a mix of sectors, with notable overlaps in stocks experiencing bullish momentum.
Contrarian Signals
Despite a -9.8% YTD return, CHAMPION shows an RSI of 54.4 and a bullish MACD, suggesting potential for recovery.
Sector Heatmaps
| Sector | Performance | Institutional Activity | Retail Activity |
|---|---|---|---|
| Banking | +1.5% | High | Moderate |
| Consumer Goods | -0.5% | Low | High |
Dividend-Beta Matrix
| Stock | Dividend Yield | Beta |
|---|---|---|
| AFRIPRUD | 1.27% | 0.64 |
Institutional Clustering Alerts
ZENITHBANK has a significant institutional trade value share of 20.17%, indicating strong institutional interest.
High Dividend Yield Stocks
Stocks like AFRIPRUD with a 1.27% yield are also present in bullish momentum tables, suggesting they may offer defensive opportunities.
Suggestions for Traders
- Monitor stocks with unusual volume for potential breakout opportunities.
- Consider defensive positions in high-dividend yield stocks amidst market volatility.
- Be cautious with stocks showing bearish momentum, especially those crossing below their 15-day moving average.
Market Activity Summary
Retail investors accounted for 88.08% of trade counts but only 6.33% of trade value, indicating a focus on lower-value trades. In contrast, institutional investors, while only 11.92% of trade counts, represented 93.67% of trade value, suggesting a preference for larger transactions.
|
Top ASI Gainers Over Last 5 Trading Days
|
Top ASI Losers Over Last 5 Trading Days
|
For more detailed analysis, on InfoWARE Market Data Terminal <NSEPERF> <GO>
On InfoWARE Finance Mobile App (Android, iPhone & iPad, Windows Phone and Windows 8/10), "Top Gainers & Losers"
NEWGOLD EXCHANGE TRADED FUND (ETF) (NEWGOLD) topped the advancers list closing at N47,999.99 with a gain of 23.08% followed by UPDC PLC (UPDC) which closed at N2.77 with a gain of 9.92%.
On the flip side UNIVERSITY PRESS PLC. (UPL) and ACADEMY PRESS PLC. (ACADEMY) topped the decliners log with a loss of -10.00% at a close of N4.32, and -9.66% to close the day at N2.62 respectively.
| Symbol | LClose | %Chg |
|---|---|---|
| NEWGOLD | 47,999.99 | 23.08 |
| UPDC | 2.77 | 9.92 |
| INTBREW | 5.70 | 9.62 |
| ROYALEX | 0.80 | 9.59 |
| MULTIVERSE | 8.65 | 8.81 |
For more detailed analysis,
- On InfoWARE Market Data Terminal <TOPG> <GO>
- On InfoWARE Finance Mobile App ( Android, iPhone & iPad and Windows 10) , "Top Gainers & Losers"
Currency Market
In the currency market, the Naira fell 0.55%(-8.43) against the Dollar to settle at 1 to 1NSE: Bull Signal - Price crossed above 15 Day MA
This signal implies these stocks are under buying pressure and the price might continue to rise and therefore positions should be monitored closely. Further suggested analysis include looking at the overall market (ASI) to see if the uptrend is market wide, sector wide or specific to the stock. Portfolio managers tend to use this as a signal to do more research to add to their positions or lock in some profits. Typically further analysis should be done using commands like PC and RV on the InfoWARE Market Data Terminal. Another command is ALERTS to set price triggers for possible exit or entry as necessary
For more detailed analysis,
- On InfoWARE Market Data Terminal <NSEPERF> <GO>
- On InfoWARE Finance Mobile App ( Android , iPhone & iPad and Windows 10) , "Top Gainers & Losers"
| Symbol | Price | %Chg | 15DMA | PE | EPS | DivY | MktCap | Vol | Trades | Value | LstTradeTime |
|---|---|---|---|---|---|---|---|---|---|---|---|
| NEWGOLD | 47,999.99 | 18.75 | 40,839.55 | 0.00 | 0.00 | 0.00 | 0.00 | 1.00 | 1.00 | 48.00K | 13-Mar-2025 14:31:06.360 |
| INTBREW | 5.70 | 8.77 | 5.36 | 0.00 | 0.00 | 6.23 | 153.11B | 304.78K | 49.00 | 1.68M | 13-Mar-2025 14:30:19.837 |
| NGXGROUP | 32.85 | 5.78 | 31.80 | 0.00 | 0.00 | 2.73 | 64.52B | 482.03K | 57.00 | 15.83M | 13-Mar-2025 14:30:21.160 |
| TIP | 3.92 | 5.61 | 3.81 | 0.00 | 3.49B | 192.06K | 13.00 | 749.82K | 13-Mar-2025 14:31:12.467 | ||
| FGS202776 | 100.00 | 5.00 | 99.00 | 0.00 | 0.00 | 50.00 | 1.00 | 50.00K | 13-Mar-2025 14:30:33.870 | ||
| HONYFLOUR | 12.88 | 2.87 | 12.56 | 16.28 | 0.31 | 1.40 | 102.14B | 823.15K | 130.00 | 10.55M | 13-Mar-2025 14:30:19.720 |
| NGXCNSMRGDS | 1,828.53 | 1.38 | 1,823.33 | 30.19 | 55.24 | 0.00 | 0.00 | 7.26M | 1,067.00 | 399.51M | 13-Mar-2025 14:30:35.670 |
| CUTIX | 2.48 | 1.21 | 2.45 | 8.81 | 0.26 | 6.52 | 8.74B | 1.60M | 64.00 | 3.99M | 13-Mar-2025 14:30:18.250 |
| ZENITHBANK | 48.00 | 0.52 | 47.96 | 3.33 | 13.30 | 2.25 | 1,507.03B | 28.73M | 571.00 | 1.38B | 13-Mar-2025 14:31:06.810 |
NSE: BEAR Signal - Price crossed below 15 Day MA
This signal implies these stocks are under selling pressure and the price might continue to slide and therefore positions should be monitored closely. Further suggested analysis include looking at the overall market (ASI) to see if the downtrend is market wide, sector wide or specific to the stock. If the overal market trend is upwards, then since these stocks are heading in the opposite direction, then further analysis should be done using commands like PC and RV on the InfoWARE Market Data Terminal. Another command is ALERTS to set price triggers for possible exit is necessar
For more detailed analysis,
- On InfoWARE Market Data Terminal <BEARM> <GO>
- On InfoWARE Finance Mobile App ( Android , iPhone & iPad and Windows 10)
| Symbol | Price | %Chg | 15DMA | PE | EPS | DivY | MktCap | Vol | Trades | Value | LstTradeTime |
|---|---|---|---|---|---|---|---|---|---|---|---|
| FG212035S1 | 113.00 | 0.00 | 113.00 | 0.00 | 0.00 | 0.00 | 0.00 | 0.00 | 13-Mar-2025 14:30:30.743 | ||
| UBA | 36.75 | -0.68 | 36.87 | 8.29 | 4.05 | 5.96 | 1,256.83B | 15.42M | 420.00 | 569.76M | 13-Mar-2025 14:31:06.770 |
| FGS202669 | 71.00 | -1.41 | 71.93 | 0.00 | 0.00 | 50.00 | 1.00 | 35.50K | 13-Mar-2025 14:30:33.163 | ||
| GTCO | 60.50 | -1.82 | 60.64 | 7.49 | 7.10 | 1.88 | 1,780.59B | 26.69M | 387.00 | 1.63B | 13-Mar-2025 14:31:05.570 |
| CILEASING | 3.81 | -4.99 | 3.87 | 6.50 | 0.64 | 1.20 | 2.98B | 1.70M | 47.00 | 6.50M | 13-Mar-2025 14:31:05.367 |
| FGSUK2033S6 | 89.00 | -10.11 | 94.54 | 0.00 | 0.00 | 5.00K | 4.00 | 4.52M | 13-Mar-2025 14:30:34.233 | ||
| ACADEMY | 2.62 | -10.69 | 2.79 | 0.00 | 0.00 | 3.51 | 1.98B | 957.29K | 17.00 | 2.54M | 13-Mar-2025 14:30:15.960 |
| UPL | 4.32 | -11.11 | 4.66 | 7.13 | 0.59 | 0.60 | 1.86B | 2.21M | 54.00 | 9.69M | 13-Mar-2025 14:30:23.300 |
| FGSUK2032S5 | 88.20 | -23.53 | 100.26 | 0.00 | 0.00 | 12.00K | 4.00 | 11.07M | 13-Mar-2025 14:30:34.197 |
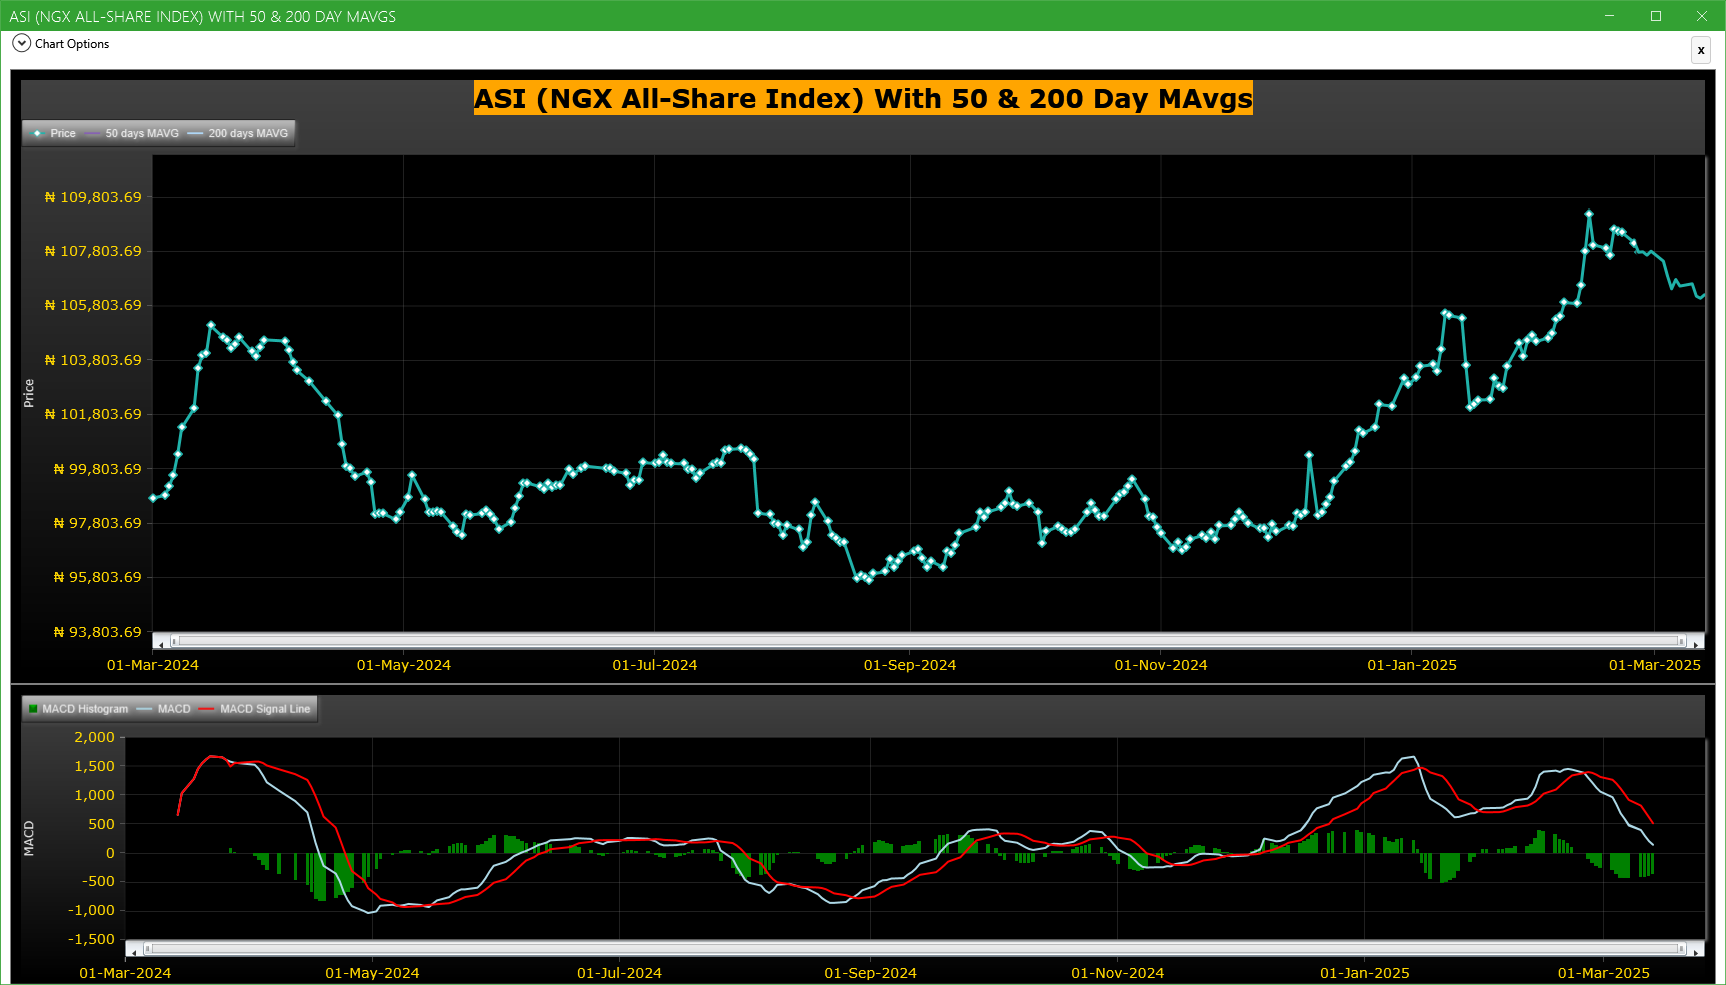
Market Trend - ASI (NGX All-Share-Index) With 50 & 200 Day MAvgs Chart
Technical traders typically use the 50 & 200 day moving averages to aid in choosing
where to enter or exit a position, which then causes these levels to act as strong
support or resistance. As a general guideline, if the price is above a moving average,
the trend is up. If the price is below a moving average, the trend is down.
It is important to note that critics of technical analysis say that moving averages act
as support and resistance because so many traders use these indicators to inform their
trading decisions. Also moving averages tend to work quite well in strong trending conditions
but poorly in choppy or ranging conditions.
Trading Strategies: Crossovers
Crossovers are one of the main moving average strategies. The first type is a price crossover,
which is when the price crosses above or below a moving average to signal a potential change
in trend. Another strategy is to apply two moving averages to a chart: one longer and one
shorter. When the shorter-term MA crosses above the longer-term MA, it is a buy signal, as
it indicates that the trend is shifting up. This is known as a golden cross. Meanwhile, when
the shorter-term MA crosses below the longer-term MA, it is a sell signal, as it indicates that
the trend is shifting down. This is known as a dead/death cross
For more detailed analysis,
- On InfoWARE Market Data Terminal <CI> <GO>
- On InfoWARE Finance Mobile App ( Android , iPhone & iPad and Windows 10) , "Research"
Unusual Volume: Volume traded is more than double the 90 day moving average (All exchanges; ASI & ASem). For more detailed analysis,
- On InfoWARE Market Data Terminal <UV> <GO>
- On InfoWARE Finance Mobile App ( Android , iPhone & iPad and Windows 10)
| Symbol | Name | Volume | 90DAvgVol | %VolChg | Price | LClose | %Chg | Trades | Value |
|---|---|---|---|---|---|---|---|---|---|
| TANTALIZER | TANTALIZERS PLC | 29.62M | 10.46M | 183.14 | 3.25 | 3.14 | 3.50 | 509 | 98.01M |
| GEREGU | GEREGU Power PLC | 7.50M | 842.63K | 790.43 | 1,150.00 | 1,150.00 | 0.00 | 121 | 7.77B |
| UPL | UNIVERSITY PRESS PLC. | 2.21M | 326.66K | 575.14 | 4.32 | 4.80 | -10.00 | 54 | 9.69M |
| ACADEMY | ACADEMY PRESS PLC. | 957.29K | 443.48K | 115.86 | 2.62 | 2.90 | -9.66 | 17 | 2.54M |
| REDSTAREX | RED STAR EXPRESS PLC | 601.26K | 265.32K | 126.62 | 5.35 | 5.90 | -9.32 | 37 | 3.27M |
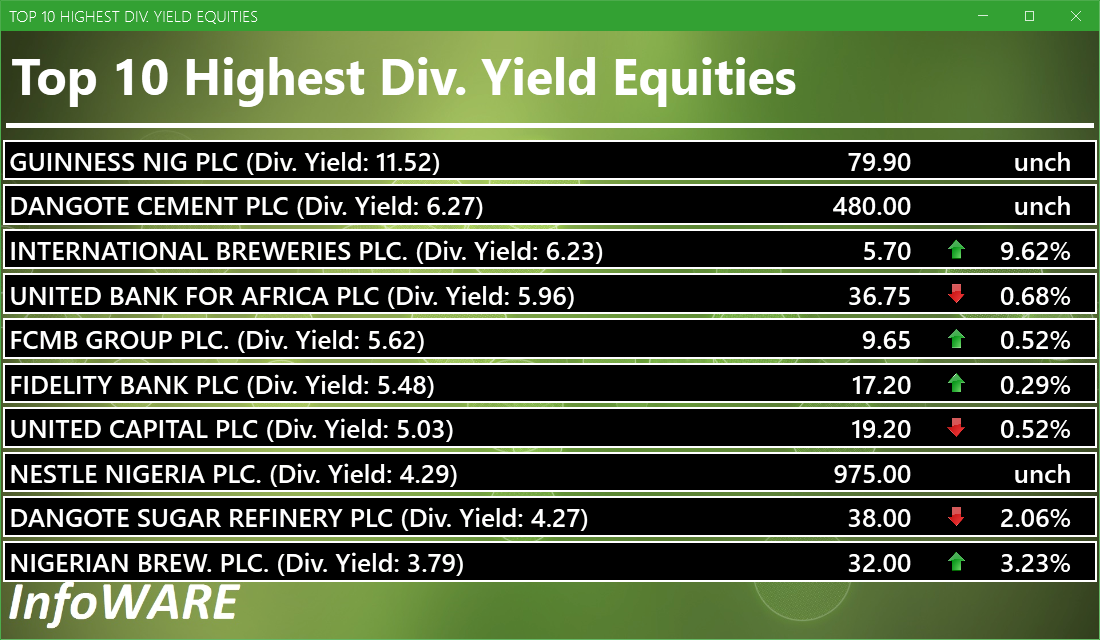
Investment Insights - High Div. Stocks
Dividend stocks distribute a portion of the company earnings to investors on a regular basis and they can a great choice for investors looking for regular income. As an investment or trading strategy, high dividend yield equities provide annual cash payments as against mostly capital gains in the price of a stock. The list in the table below represent the highest dividend paying stocks from the list of the most liquid stocks in the NSE top 30.
For more detailed analysis,
- On InfoWARE Market Data Terminal <HYIELD> <GO>
- On InfoWARE Finance Mobile App ( Android , iPhone & iPad and Windows 10) , "Research"
African Markets
| Name | LClose | Change | %Chg |
|---|---|---|---|
| BRVM Stock Exchange | 291.84 | 0.00 | 0.00 |
| Botswana Stock Exchange | 10,112.78 | 0.00 | 0.00 |
| Egyptian Exchange | 31,049.03 | 114.46 | 0.37 |
| Ghana Stock Exchange | 6,043.39 | -18.79 | -0.31 |
| Johannesburg Stock Exchange | 86,853.81 | -235.14 | -0.27 |
| Casablanca Stock Exchange | 16,294.14 | -182.90 | -1.11 |
| Malawi Stock Exchange | 292,727.76 | -586.63 | -0.20 |
| Nigeria Stock Exchange | 106,090.38 | -74.32 | -0.07 |
| Nairobi Securities Exchange | 131.56 | -0.61 | -0.46 |
| Namibian Stock Exchange | 1,719.58 | 0.69 | 0.04 |
| Rwanda Stock Exchange | 148.89 | 0.00 | 0.00 |
| Tunis Stock Exchange | 10,805.13 | 154.44 | 1.45 |
| Uganda Securities Exchange | 1,329.99 | -6.82 | -0.51 |
Nigeria Market Indexes
| Symbol | LClose | %Chg | WTD% | MTD% | QTD% | YTD% | MktCap | Trades |
|---|---|---|---|---|---|---|---|---|
| ASI | 106,220.94 | 0.12 | -0.38 | -1.15 | 2.95 | 2.95 | 10,654 | |
| NGX30 | 3,935.28 | 0.09 | -0.45 | -1.36 | 3.16 | 3.16 | 5,379 | |
| NGXAFRBVI | 2,582.11 | -0.72 | -0.64 | -0.88 | 4.08 | 4.08 | 2,127 | |
| NGXAFRHDYI | 16,675.98 | -0.40 | -2.73 | -1.99 | -2.06 | -2.06 | 2,110 | |
| NGXASEM | 1,587.89 | 0.00 | 0.04 | 0.08 | 0.26 | 0.26 | 6 | |
| NGXBNK | 1,129.27 | -0.50 | -0.46 | -1.95 | 3.85 | 3.85 | 2,663 | |
| NGXCG | 2,957.90 | -0.23 | -0.97 | -1.45 | 4.55 | 4.55 | 5,520 | |
| NGXCNSMRGDS | 1,828.53 | 1.40 | 0.89 | 0.42 | 5.43 | 5.43 | 1,067 | |
| NGXGROWTH | 7,382.95 | 0.24 | -5.71 | -6.29 | -4.89 | -4.89 | 35 | |
| NGXINDUSTR | 3,613.24 | 0.00 | 0.00 | -0.16 | 1.17 | 1.17 | 599 | |
| NGXINS | 702.36 | 0.62 | 1.27 | -1.38 | -10.66 | -10.66 | 780 | |
| NGXLOTUSISLM | 7,604.19 | 0.14 | -0.54 | -1.36 | 9.13 | 9.13 | 1,497 | |
| NGXMAINBOARD | 5,094.80 | 0.22 | 0.11 | -0.72 | 1.82 | 1.82 | 8,139 | |
| NGXMERIGRW | 6,885.05 | 0.05 | -2.26 | -4.03 | 5.55 | 5.55 | 1,348 | |
| NGXMERIVAL | 10,544.99 | -0.24 | -1.15 | -1.99 | 1.10 | 1.10 | 3,084 | |
| NGXOILGAS | 2,531.86 | 0.05 | -0.53 | -1.58 | -6.61 | -6.61 | 370 | |
| NGXPENBRD | 1,894.50 | -0.03 | -0.53 | -1.29 | 3.43 | 3.43 | 7,950 | |
| NGXPENSION | 4,724.93 | -0.15 | -0.61 | -1.46 | 4.21 | 4.21 | 5,992 | |
| NGXPREMIUM | 10,226.54 | -0.05 | -1.24 | -1.91 | 5.07 | 5.07 | 2,480 | |
| NGXSOVBND | 620.41 | -0.32 | -0.32 | -0.35 | 3.14 | 3.14 | 1 |
For more detailed analysis,
- On InfoWARE Market Data Terminal <MKTINS> <GO>
- On InfoWARE Finance Mobile App ( Android, iPhone & iPad and Windows 10) , "Market Indexes"
Find the topic interesting? Will like to comment? Contact Us at solutions@infowarelimited.com
Top News

Chart Of The Day - ASI Chart Vs ASI Advance Decline Line (YTD) (13-Mar-2025 15:07:46.571)
InfoWARE AI Analyst Daily Market Report: 13-Mar-2025

[NEM]>> Earning Forcast - <Q2-2025> ?-<NEM INSURANCE PLC.>
[NGXGROUP]>>Notice of Meeting -<NIGERIAN EXCHANGE GROUP PLC>
[MERGROWTH]>> DAILY INDICATIVE PRICES
[XNSA]>> CORDROS MILESTONE FUNDS' BID & OFFER PRICES
[STDINSURE]>>Notice of Meeting -<STANDARD ALLIANCE INSURANCE PLC.>
[VSPBONDETF]>> DAILY INDICATIVE PRICES
[AIRTELAFRI]>>Corporate Disclosures-<Airtel Africa Plc>
[LOTUSHAL15]>> DAILY INDICATIVE PRICES
[XNSA]>> FBF PRESENTATION BY TANTALIZERS PLC - THURSDAY 13/3/25
[XNSA]>> DAILY FUND PRICE SUBMISSION - FCMB ASSET MANAGEMENT LIMITED
[SIAMLETF40]>> DAILY INDICATIVE PRICES
[XNSA]>> FBF PRESENTATION BY TANTALIZERS PLC - THURSDAY 13/3/25
[XNSA]>> REGISTRATION FOR BATCH ONE- 2025 DEALING CLERKSHIP CERTIFICATION PROGR
[ETERNA]>>Notice of Meeting -<ETERNA PLC.>
Chart Of The Day - ASI Chart Vs ASI Advance Decline Line (YTD) (12-Mar-2025 15:09:44.122)
InfoWARE AI Analyst Daily Market Report: 12-Mar-2025
[UCAP]>>Corporate Disclosures-<UNITED CAPITAL PLC>
[GUINEAINS]>> Earning Forcast - <Q2-2025> ?-<GUINEA INSURANCE PLC.>
[MERGROWTH]>> DAILY INDICATIVE PRICES
[XNSA]>> CORDROS MILESTONE FUNDS' BID & OFFER PRICES
[XNSA]>> DAILY INDICATIVE PRICES
Please refer to Encoded Headline
[XNSA]>> NGX FIXED INCOME INDICATIVE PRICE LIST FOR MAR 12, 2025
[XNSA]>> EMERGING AFRICA DAILY MUTUAL FUND PRICES
[STANBICETF30]>> DAILY INDICATIVE PRICES
[CORNERST]>>Corporate Disclosures-<CORNERSTONE INSURANCE PLC>
[OMATEK]>>Notice of Meeting -<OMATEK VENTURES PLC>
[AIRTELAFRI]>>Corporate Disclosures-<Airtel Africa Plc>
Get IDIA - the stock trading app for the modern investor
Solutions by Business
Product Suites
Company
Contacts
- 8th Floor,
- South Atlantic Petroleum Towers,
- 1 Adeola Odeku Street,
- Victoria Island,
- Lagos, Nigeria.
- Email: solutions@infowarelimited.com
Follow Us
 |
 |
 |
 |