


Chart Of The Day - ASI Chart Vs ASI Advance Decline Line (YTD) (30-Oct-2025 15:10:38.799) | InfoWARE Finance
Get IDIA - the stock trading app for the modern investor


Chart Of The Day - ASI Chart Vs ASI Advance Decline Line (YTD) (30-Oct-2025 15:10:38.799)
(Source: InfoWARE Terminal, Date: 30-Oct-2025)
Dear Investor,
Chart Of The Day - ASI Chart Vs ASI Advance Decline Line (YTD) - 30-Oct-2025 15:10:38.798
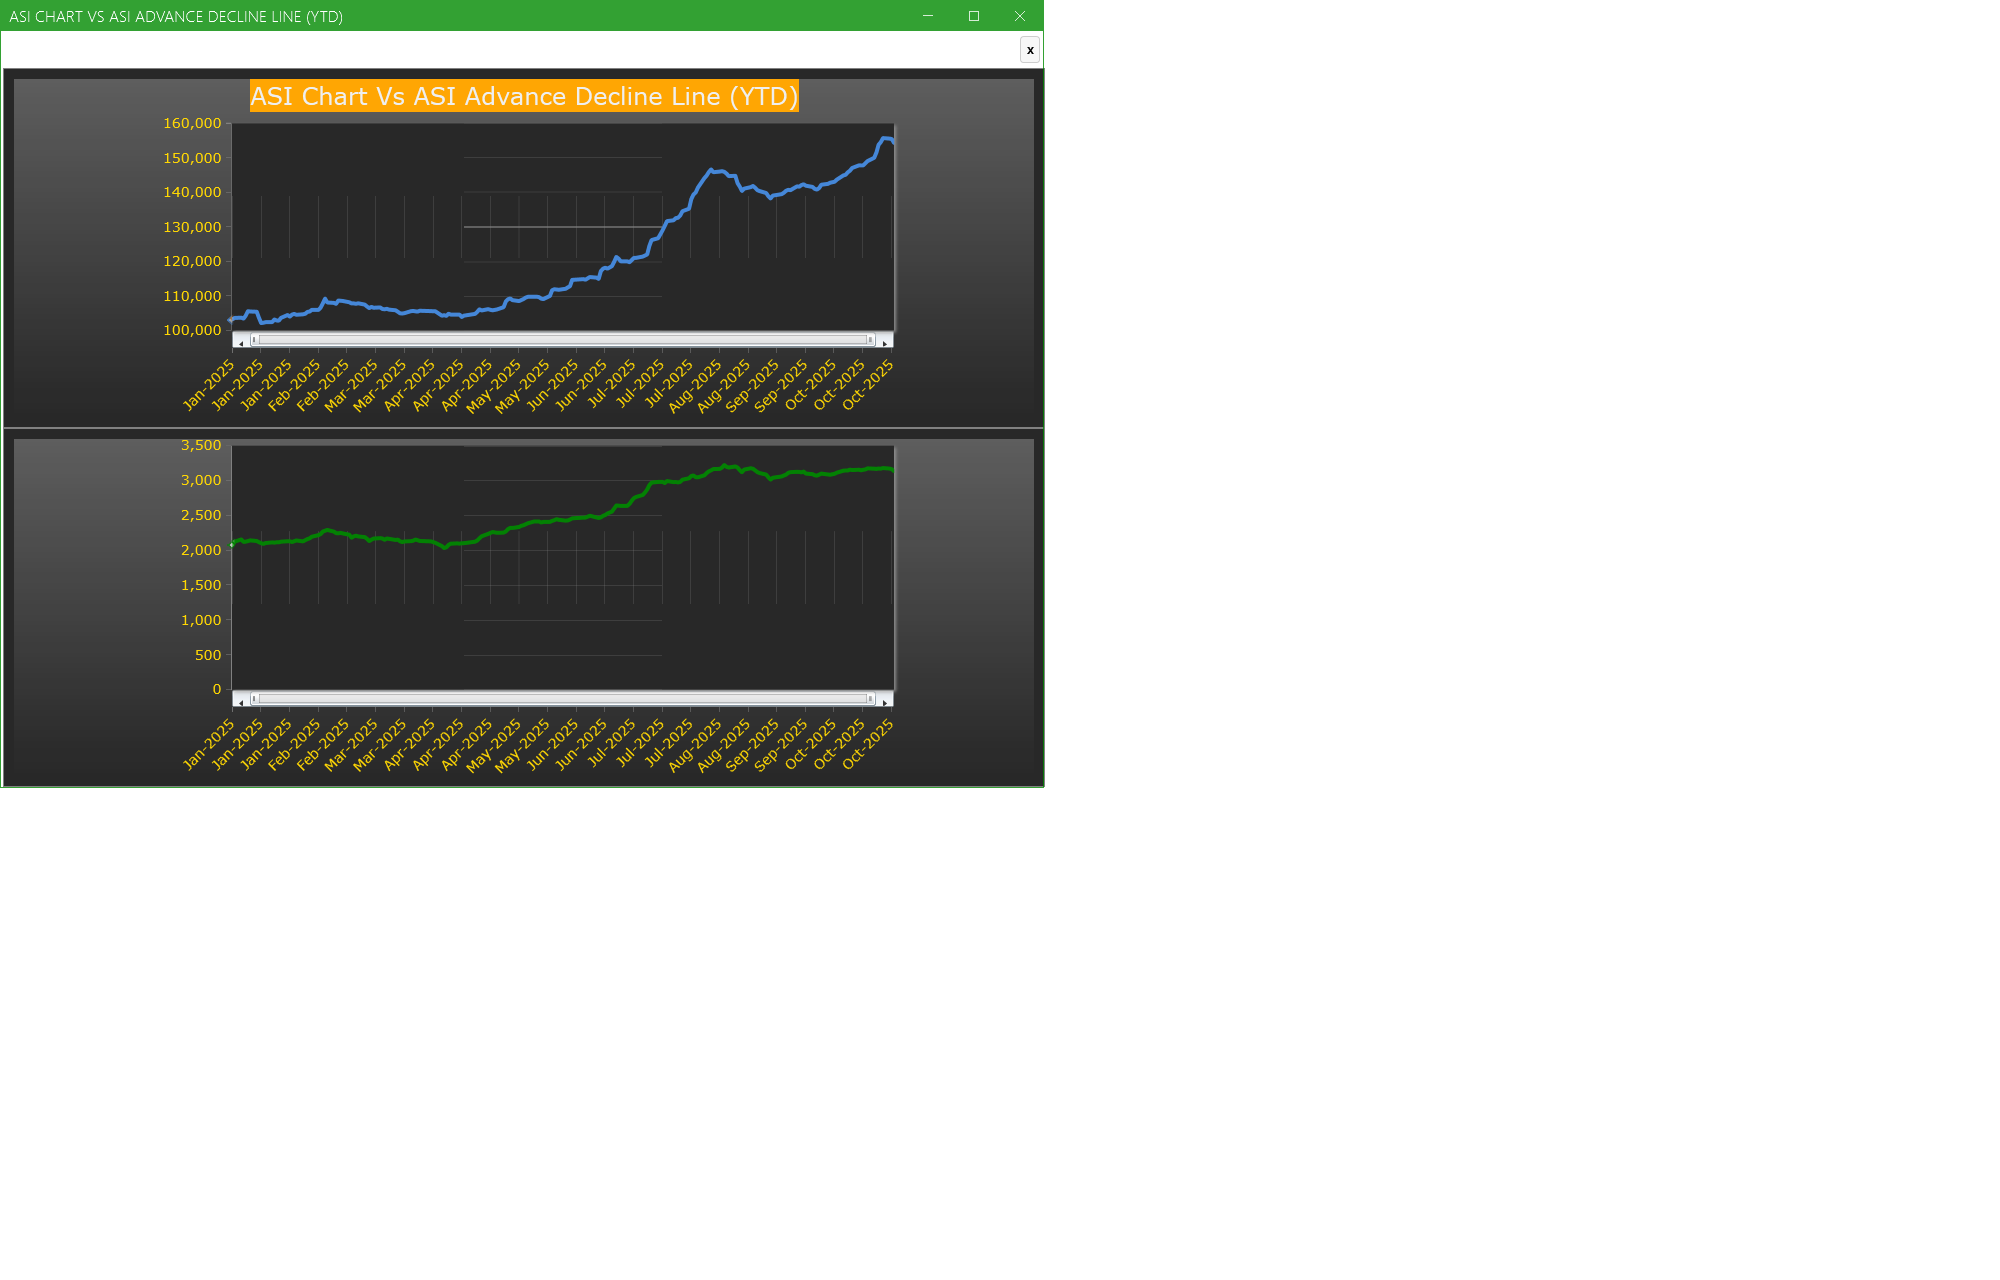
Chart of the day: ASI Chart Vs ASI Advance Decline Line (YTD) - Market breath
The A/D line is used to show market sentiment, as it tells traders whether there are more stocks rising or falling. It is used to confirm price trends in major indexes, and can also warn of reversals when divergence occurs.
Key Takeaways
- The advance/decline line (A/D) is a breadth indicator used to show how many stocks are participating in a stock market rally or decline.
- When major indexes are rallying, a rising A/D line confirms the uptrend showing strong participation.
- If major indexes are rallying and the A/D line is falling, it shows that fewer stocks are participating in the rally which means the index could be nearing the end of its rally.
- When major indexes are declining, a falling advance/decline line confirms the downtrend.
- If major indexes are declining and the A/D line is rising, fewer stocks are declining over time, which means the index may be near the end of its decline.
(Definition Source: Investopedia.com)
For more detailed analysis,
- On InfoWARE Finance Mobile App ( Android, iPhone & iPad and Windows 10) , "Research"
Find the topic interesting? Will like to comment? Contact Us at solutions@infowarelimited.com
Top News

Chart Of The Day - ASI Chart Vs ASI Advance Decline Line (YTD) (30-Oct-2025 15:10:38.799)
InfoWARE AI Analyst Daily Market Report: 30-Oct-2025

[XNSA]>> NEW LISTING OF FGN BONDS FOR JUNE AND AUGUST 2025
[XNSA]>> DAILY FUND PRICE SUBMISSION - FCMB ASSET MANAGEMENT LIMITED
[VSPBONDETF]>> DAILY INDICATIVE PRICES
[XNSA]>> OFF MARKET TRADE
[XNSA]>> LISTING OF FGN SAVINGS BONDS FOR OCTOBER 2025
[LTUSHAL15]>> DAILY INDICATIVE PRICES
[XNSA]>> H2 2025 BC/DR TEST
[XNSA]>> CLOSING GONG CEREMONY
[XNSA]>> NGX FIXED INCOME INDICATIVE PRICE LIST FOR OCT 30, 2025
[XNSA]>> FBF PRESENTATION BY THE INITIATES PLC
[XNSA]>> AELP CAPACITY BUILDING & ASSDA FORUM
[XNSA]>> CORDROS MILESTONE FUNDS' BID & OFFER PRICES
[XNSA]>> NOTIFICATION OF PRICE ADJUSTMENT
[STANBICETF30]>> DAILY INDICATIVE PRICES
Chart Of The Day - ASI Chart Vs ASI Advance Decline Line (YTD) (29-Oct-2025 15:07:15.757)
InfoWARE AI Analyst Daily Market Report: 29-Oct-2025
[VSPBONDETF]>> DAILY INDICATIVE PRICES
[SIAMLETF40]>> DAILY INDICATIVE PRICES
[MERGROWTH]>> DAILY INDICATIVE PRICES
[XNSA]>> H2 2025 BC/DR TEST
[XNSA]>> CLOSING GONG CEREMONY
[XNSA]>> NGX FIXED INCOME INDICATIVE PRICE LIST FOR OCT 29, 2025
[XNSA]>> CORDROS MILESTONE FUNDS' BID & OFFER PRICES
[XNSA]>> FBF PRESENTATION BY THE INITIATES PLC
[XNSA]>> AELP CAPACITY BUILDING & ASSDA FORUM
Chart Of The Day - ASI Chart Vs ASI Advance Decline Line (YTD) (28-Oct-2025 15:07:19.179)
InfoWARE AI Analyst Daily Market Report: 28-Oct-2025
[XNSA]>> CORDROS MILESTONE FUNDS' BID & OFFER PRICES
Get IDIA - the stock trading app for the modern investor
Solutions by Business
Product Suites
Company
Contacts
- 8th Floor,
- South Atlantic Petroleum Towers,
- 1 Adeola Odeku Street,
- Victoria Island,
- Lagos, Nigeria.
- Email: solutions@infowarelimited.com
Follow Us
 |
 |
 |
 |