


InfoWARE AI Analyst Daily Market Report: 29-Oct-2025 | InfoWARE Finance
Get IDIA - the stock trading app for the modern investor


InfoWARE AI Analyst Daily Market Report: 29-Oct-2025
(Source: InfoWARE Terminal, Date: 29-Oct-2025)
Dear Investor,
NGX Market Summary – Wednesday, October 29, 2025
The Nigerian equities market saw a sharp pullback today, with the NGX All Share Index declining by -0.70% to close at 155,353.20. This pause comes after an impressive 49.51% YTD performance. Market turnover sank by -44.08% to ₦11.95B, signaling waning conviction. Breadth was notably weak, with only 22 advancers versus 49 decliners (0.45x), and a modest decrease in traded volume. Highly unusual volumes on select stocks and mixed technical signals hint at cross-currents now in play — just as some YTD gainers flash overbought, while high-yield names are starting to flag risk aversion. Let’s dive deeper.
Key Market Trends & Breadth
- Breadth: 0.45x with decliners outpacing advancers 49 to 22 — typical in a broad-based pullback and suggesting correction mode.
- Turnover: Plummeted by -44.08% vs previous day. High conviction trades evaporated, and reduced liquidity can amplify volatility in coming sessions.
- YTD Performance: Despite today’s drop, the NGX ASI remains robust at 49.51% YTD, keeping the longer-term uptrend alive for now.
- Adv/Dec Stock Volumes: 61 stocks saw volume up, 80 down, confirming broad disengagement.
Top Gainers & Losers At A Glance
| Top Gainers | Change (%) |
|---|---|
| MERISTEM VALUE ETF (MERVALUE) | 10.00% |
| DEAP CAPITAL MGMT (DEAPCAP) | 9.70% |
| ASO SAVINGS (ASOSAVINGS) | 8.86% |
| MCNICHOLS PLC | 6.67% |
| CAVERTON | 6.14% |
| Top Losers | Change (%) |
|---|---|
| JOHN HOLT PLC. (JOHNHOLT) | -10.00% |
| BETA GLASS (BETAGLAS) | -10.00% |
| VETIVA BANKING ETF (VETBANK) | -9.88% |
| E-TRANZACT (ETRANZACT) | -9.67% |
| CHAMPION BREWERIES (CHAMPION) | -8.81% |
- ASO SAVINGS (ASOSAVINGS): 8.86% gain today, and a YTD of 72.00%, with RSI of 90.56 suggesting a heavily overbought/overextended condition. Unusual trading volume (8x 90-day average) suggests speculative froth.
- JOHN HOLT (JOHNHOLT): Suffered -10.00% today and is also a YTD top loser (-30.68%), with RSI at 25.38 (very oversold), which could attract bottom-fishing but caution is warranted.
- DEAPCAP: Featured on both the top gainer list and the bullish momentum table (crossed above 15DMA), indicating short-term accumulation.
- TANTALIZERS (TANTALIZER): Showed a 978% surge in traded volume, placing it squarely on the "unusual volume" radar.
YTD Top Gainers & Losers Table
| Top 5 YTD Gainers | YTD (%) | RSI | Div Yield (%) | Beta |
|---|---|---|---|---|
| SOVRENINS | 261.79 | 70.17 | 3.75 | 1.12 |
| NEM | 174.17 | 66.29 | 6.52 | 0.69 |
| OKOMUOIL | 143.29 | 52.33 | 0.54 | 0.06 |
| ASOSAVINGS | 72.00 | 90.56 | 10.00 | 0.00 |
| BERGER | 112.50 | 65.92 | 1.15 | 0.56 |
| Top 5 YTD Losers | YTD (%) | RSI | Div Yield (%) | Beta |
|---|---|---|---|---|
| JOHNHOLT | -30.68 | 25.38 | 1.25 | -0.20 |
| GREENWETF | -30.06 | 57.53 | 0.00 | 0.83 |
| FTNCOCOA | -14.38 | 42.15 | 1.60 | 0.79 |
| ETRANZACT | -15.31 | 50.88 | 1.48 | 0.58 |
| PZ | -64.40 | 53.58 | 4.59 | 0.55 |
Momentum Analysis
- Bullish Momentum (above 15DMA cross): DEAPCAP remains a short-term bullish candidate, with a rapid price move (+8.84%), positive MACD, but RSI still moderate.
- Bearish Momentum (below 15DMA cross): FCMB, NGXINS, LINKASSURE, MAYBAKER, AFRIPRUD, AIICO, HONYFLOUR, CUSTODIAN, CORNERST, ETERNA, VETBANK all triggered bearish signals. Notably, AFRIPRUD combines a solid dividend yield (1.27%) with a bearish 15DMA cross and moderate beta (0.64).
- Overbought/Overextended: ASOSAVINGS has an extreme RSI of 90.56 (+72% YTD), suggesting a speculative spike; take caution as "mean reversion" risk rises. SOVRENINS approaches overbought (RSI 70.17, YTD +261%).
- Oversold: JOHNHOLT (RSI 25.38) and some YTD losers now look deeply discounted — reversal candidates for contrarians but also value traps if fundamentals are weak.
Contrarian Signals
- CHAMPION BREW. PLC (CHAMPION): RSI near neutral at 50.59, MACD barely positive, yet -8.8% today and -9.8% YTD. Mixed technicals — neither oversold nor truly oversold, suggests indecision or fundamental headwinds despite some buying signals.
- AFRIPRUD: High dividend yield (1.27%) but bearish momentum signal (below 15DMA), moderate beta. Dividend support may cushion further downside, but technicals warn of possible short-term weakness.
- DEAPCAP: High single-day gain and bullish 15DMA cross, but moderate RSI and very high P/E (over 180); fundamental justification required — watch for reversal signal if volume dries up.
Sector Heatmap
| Sector | Color | Top Movers | Momentum | Vol. Alert | Yield/Defense |
|---|---|---|---|---|---|
| Financials | Weak | DEAPCAP (bullish), ACCESSCORP (retail/institutional trading, frictional) | Bullish/Neutral (DEAPCAP), Bearish (FCMB) | ASOSAVINGS (Unusual Vol., speculative) | AFRIPRUD (1.27%) |
| Insurance | Under Pressure | CORNERST (-8.46%, vol surge), SOVRENINS (overbought YTD) | Bearish (NGXINS), SOVRENINS (near overbought) | CORNERST (vol surge >2x 90d avg) | SOVRENINS (3.75%) |
| Consumer Goods | Mixed | CHAMPION (contrarian), MCNICHOLS (+6.67%) | Mixed | – | Berger (1.15%), OKOMUOIL (0.54%) |
| Hospitality/Food | Strong Speculative Action | TANTALIZER (978% vol spike), | Bullish (no 15DMA cross), Volatility | TANTALIZER (Unusual) | - |
| Industrial | Large Block Flows | BUACEMENT (262% vol), | Neutral | BUACEMENT (Unusual Vol.) | – |
| Telecom | High Turnover, Neutral | MTNN | Neutral | – | – |
Dividend-Beta Matrix: Defensive & Income Plays
| Stock | Div. Yield | Beta | Momentum Signal | Comment |
|---|---|---|---|---|
| AFRIPRUD | 1.27% | 0.64 | Bearish (below 15DMA) | Appeals to income-focused investors seeking lower beta, but risk of near-term price drift lower. |
| SOVRENINS | 3.75% | 1.12 | Overbought territory | High yield and high beta — likely too risky for conservative investors at these levels. |
| CUSTODIAN | 1.20% | 0.54 | Bearish (below 15DMA) | Defensive income play, but short-term technical pressure. |
| NEM | 6.52% | 0.69 | YTD Gainer, high RSI | Best blend of high yield, lower beta, YTD outperformance – but may be overbought short-term. |
Institutional Clustering Alerts
- ZENITHBANK: 20.17% of institutional trade value share, showing institutional clustering. However, technicals are deteriorating: recent negative momentum and large retail/institutional flows point to tug-of-war rather than clear direction. Watch for breakout above/below 15DMA for cues.
- ARADEL: Institutional trades dominated (₦2.58B, 17.15% of institutional value), on weakness (-7.94%) — likely major fund repositioning or profit taking.
- ACCESSCORP & GTCO: Both are favorites of both retail and institutional groups, but show diverging momentum recently, hinting at sector risk-off.
Trade Activity Insights: Retail vs Institutional
- Institutional investors accounted for 65.6% of volume and 86.47% of trade value, with only 38.7% of trade count. This points to large block trades, likely in blue chips.
- Retail investors dominate on number of trades (61.3%) but much lower volume and value, consistent with smaller ticket sizes and more speculative/volatile names.
-
Top 5 Institutional Most Traded:
- ARADEL (17.15% value share): Outsize flows but descending (-7.94%) — possible large-scale repositioning.
- ACCESSCORP, ZENITHBANK, GTCO, MTNN: Traditional large-cap, sector-sensitive names. The bias is mixed (between small losses and slight gains) amidst the broad market pullback.
-
Top 5 Retail Most Traded:
- MTNN: Heavily traded, low net movement.
- UBA, FCMB, ZENITHBANK, ACCESSCORP: All major banking names, again emphasizing the continued dominance of financials in retail activity, but notable that several are on bearish momentum signals, suggesting risk for retail players.
- Pattern: The overlap of large caps between institutional and retail focus, combined with most on technically weakening signals, suggests a potential "handoff" from institutions to retail in late-cycle conditions — usually a caution flag for traders.
Stocks with Both High Dividend Yield & Momentum
- AFRIPRUD (1.27% yield, low beta of 0.64): Bearish momentum indicates possible further pullback ahead, but ongoing dividend support could create buy-the-dip opportunities for risk-averse investors.
- NEM (6.52% yield, 174.2% YTD): High flyer on strong momentum, but overbought — uptrend may continue short-term, but watch for pullbacks.
- CUSTODIAN (1.20% yield): Now flashing bearish, but defensive properties may attract dip buyers if the selloff deepens.
Unusual Volume & Hidden Insights
- TANTALIZER: Almost 10x its 90-day average traded volume, marking speculative frenzy (possibly short covering or news-driven). A typical "hot potato" — exercise caution.
- ASOSAVINGS: Volume up over 8x, price up 8.86%, YTD 72%. Warning: RSI at 90.56 is "maximum bullish", but danger of sharp reversal looms.
- BUACEMENT: 262% volume spike but price down slightly, suggesting churn without clear net buying pressure.
- CORNERST: On both the bearish momentum and unusual volume lists — signals strong, persistent distribution. Avoid.
- Speculative signals: High volume runners like TANTALIZER and speculative gainers like ASOSAVINGS are at risk of mean reversion. Cautious stance advisable.
Outlook & Suggestions for Traders
- Breadth and liquidity are deteriorating: Fewer stocks are leading while decliners expand — classic late-stage trend behavior. Tighten stops and reduce leverage.
-
Look for reversal in oversold/overbought YTD names:
- Oversold: JOHNHOLT is a candidate (RSI < 30, -10% today), but avoid catching "falling knives" unless reversal is confirmed.
- Overbought: SOVRENINS & ASOSAVINGS: Consider partial profit-taking; chasing here exposes one to whipsaw risk.
- Defensive Income: Stocks with lower beta and solid yield (AFRIPRUD, NEM) could outperform if volatility rises further, though technicals in the short run are bearish.
- Follow sector and technical cues: Most bearish momentum names are in Financials/Insurance; caution in broad allocation. Play high-conviction breakouts/breakdowns (monitor names on unusual volume or recent 15DMA cross signals).
- Monitor institutional flows: Sharp drop in turnover and increased institutional clustering (ZENITHBANK, GTCO) may precede sector inflection points — watch for "confirmation” by price action before entering.
- Avoid volume "frenzy" without fundamentals: Unusual volume may not always signal sustainable moves; beware pump-and-dump risks, especially in low-float/small cap names echoing TANTALIZER or ASOSAVINGS.
- Currency Watch: Naira appreciation (+0.01%) is marginal, but enthusiasm is muted — waits for further catalysts.
Summary:
- Market breadth and liquidity are declining, with both turnover and advancers noticeably down.
- Momentum remains in select YTD outperformers, but many are now overbought or speculative. Several large caps are under institutional distribution – further caution required.
- Income and defensives with low beta may help buffer coming volatility, but only after downside on short-term momentum unwinds. Watch for reversal signals in top YTD losers.
- Avoid chasing volume surges unless supported by broader trend or fundamentals; volatility and risk will remain pronounced in the near term.
|
Top ASI Gainers Over Last 5 Trading Days
|
Top ASI Losers Over Last 5 Trading Days
|
For more detailed analysis, on InfoWARE Market Data Terminal <NSEPERF> <GO>
On InfoWARE Finance Mobile App (Android, iPhone & iPad, Windows Phone and Windows 8/10), "Top Gainers & Losers"
MERISTEM VALUE EXCHANGE TRADED FUND (MERVALUE) topped the advancers list closing at N220.00 with a gain of 10.00% followed by DEAP CAPITAL MANAGEMENT & TRUST PLC (DEAPCAP) which closed at N1.81 with a gain of 9.70%.
On the flip side JOHN HOLT PLC. (JOHNHOLT) and BETA GLASS CO PLC. (BETAGLAS) topped the decliners log with a loss of -10.00% at a close of N5.40, and -10.00% to close the day at N437.40 respectively.
| Symbol | LClose | %Chg |
|---|---|---|
| MERVALUE | 220.00 | 10.00 |
| DEAPCAP | 1.81 | 9.70 |
| ASOSAVINGS | 0.86 | 8.86 |
| MCNICHOLS | 3.20 | 6.67 |
| CAVERTON | 6.40 | 6.14 |
For more detailed analysis,
- On InfoWARE Market Data Terminal <TOPG> <GO>
- On InfoWARE Finance Mobile App ( Android, iPhone & iPad and Windows 10) , "Top Gainers & Losers"
Currency Market
In the currency market, the Naira appreciated 0.01%(0.15) against the Dollar to settle at 1 to 1NSE: Bull Signal - Price crossed above 15 Day MA
This signal implies these stocks are under buying pressure and the price might continue to rise and therefore positions should be monitored closely. Further suggested analysis include looking at the overall market (ASI) to see if the uptrend is market wide, sector wide or specific to the stock. Portfolio managers tend to use this as a signal to do more research to add to their positions or lock in some profits. Typically further analysis should be done using commands like PC and RV on the InfoWARE Market Data Terminal. Another command is ALERTS to set price triggers for possible exit or entry as necessary
For more detailed analysis,
- On InfoWARE Market Data Terminal <NSEPERF> <GO>
- On InfoWARE Finance Mobile App ( Android , iPhone & iPad and Windows 10) , "Top Gainers & Losers"
| Symbol | Price | %Chg | 15DMA | PE | EPS | DivY | MktCap | Vol | Trades | Value | LstTradeTime |
|---|---|---|---|---|---|---|---|---|---|---|---|
| DEAPCAP | 1.81 | 8.84 | 1.73 | 188.84 | 0.01 | 13.76 | 2.72B | 3.03M | 65.00 | 5.36M | 29-Oct-2025 14:30:18.527 |
NSE: BEAR Signal - Price crossed below 15 Day MA
This signal implies these stocks are under selling pressure and the price might continue to slide and therefore positions should be monitored closely. Further suggested analysis include looking at the overall market (ASI) to see if the downtrend is market wide, sector wide or specific to the stock. If the overal market trend is upwards, then since these stocks are heading in the opposite direction, then further analysis should be done using commands like PC and RV on the InfoWARE Market Data Terminal. Another command is ALERTS to set price triggers for possible exit is necessar
For more detailed analysis,
- On InfoWARE Market Data Terminal <BEARM> <GO>
- On InfoWARE Finance Mobile App ( Android , iPhone & iPad and Windows 10)
| Symbol | Price | %Chg | 15DMA | PE | EPS | DivY | MktCap | Vol | Trades | Value | LstTradeTime |
|---|---|---|---|---|---|---|---|---|---|---|---|
| FCMB | 10.60 | -1.42 | 10.63 | 104.31 | 0.09 | 5.62 | 209.91B | 8.72M | 1,108.00 | 92.60M | 29-Oct-2025 14:30:18.950 |
| NGXINS | 1,272.18 | -2.51 | 1,281.58 | 10.41 | 2.09 | 0.00 | 0.00 | 115.39M | 2,339.00 | 491.02M | 29-Oct-2025 14:30:29.420 |
| LINKASSURE | 1.96 | -3.57 | 2.02 | 59.89 | 0.02 | 5.56 | 27.44B | 5.33M | 46.00 | 10.49M | 29-Oct-2025 14:30:19.917 |
| MAYBAKER | 17.00 | -3.82 | 17.52 | 58.94 | 0.14 | 3.75 | 29.33B | 671.97K | 102.00 | 11.30M | 29-Oct-2025 14:30:20.023 |
| AFRIPRUD | 14.20 | -4.23 | 14.62 | 19.57 | 0.61 | 1.27 | 28.40B | 1.95M | 126.00 | 27.91M | 29-Oct-2025 14:30:12.733 |
| AIICO | 3.80 | -4.74 | 3.92 | 2.01 | 0.60 | 4.13 | 139.10B | 7.21M | 378.00 | 27.84M | 29-Oct-2025 14:30:12.813 |
| HONYFLOUR | 22.00 | -5.00 | 22.67 | 16.28 | 0.31 | 1.40 | 174.46B | 1.37M | 315.00 | 30.22M | 29-Oct-2025 14:30:19.530 |
| CUSTODIAN | 40.45 | -6.80 | 42.18 | 3.80 | 3.29 | 1.20 | 237.92B | 1.81M | 113.00 | 73.98M | 29-Oct-2025 14:30:13.700 |
| CORNERST | 6.15 | -8.46 | 6.39 | 8.62 | 0.35 | 5.28 | 111.72B | 8.11M | 179.00 | 49.22M | 29-Oct-2025 14:30:13.660 |
| ETERNA | 40.00 | -8.75 | 41.01 | 29.51 | 0.75 | 0.68 | 52.17B | 509.45K | 112.00 | 20.55M | 29-Oct-2025 14:30:18.753 |
| VETBANK | 15.50 | -10.97 | 15.67 | 0.00 | 0.00 | 95.25K | 52.00 | 1.59M | 29-Oct-2025 14:30:48.793 |
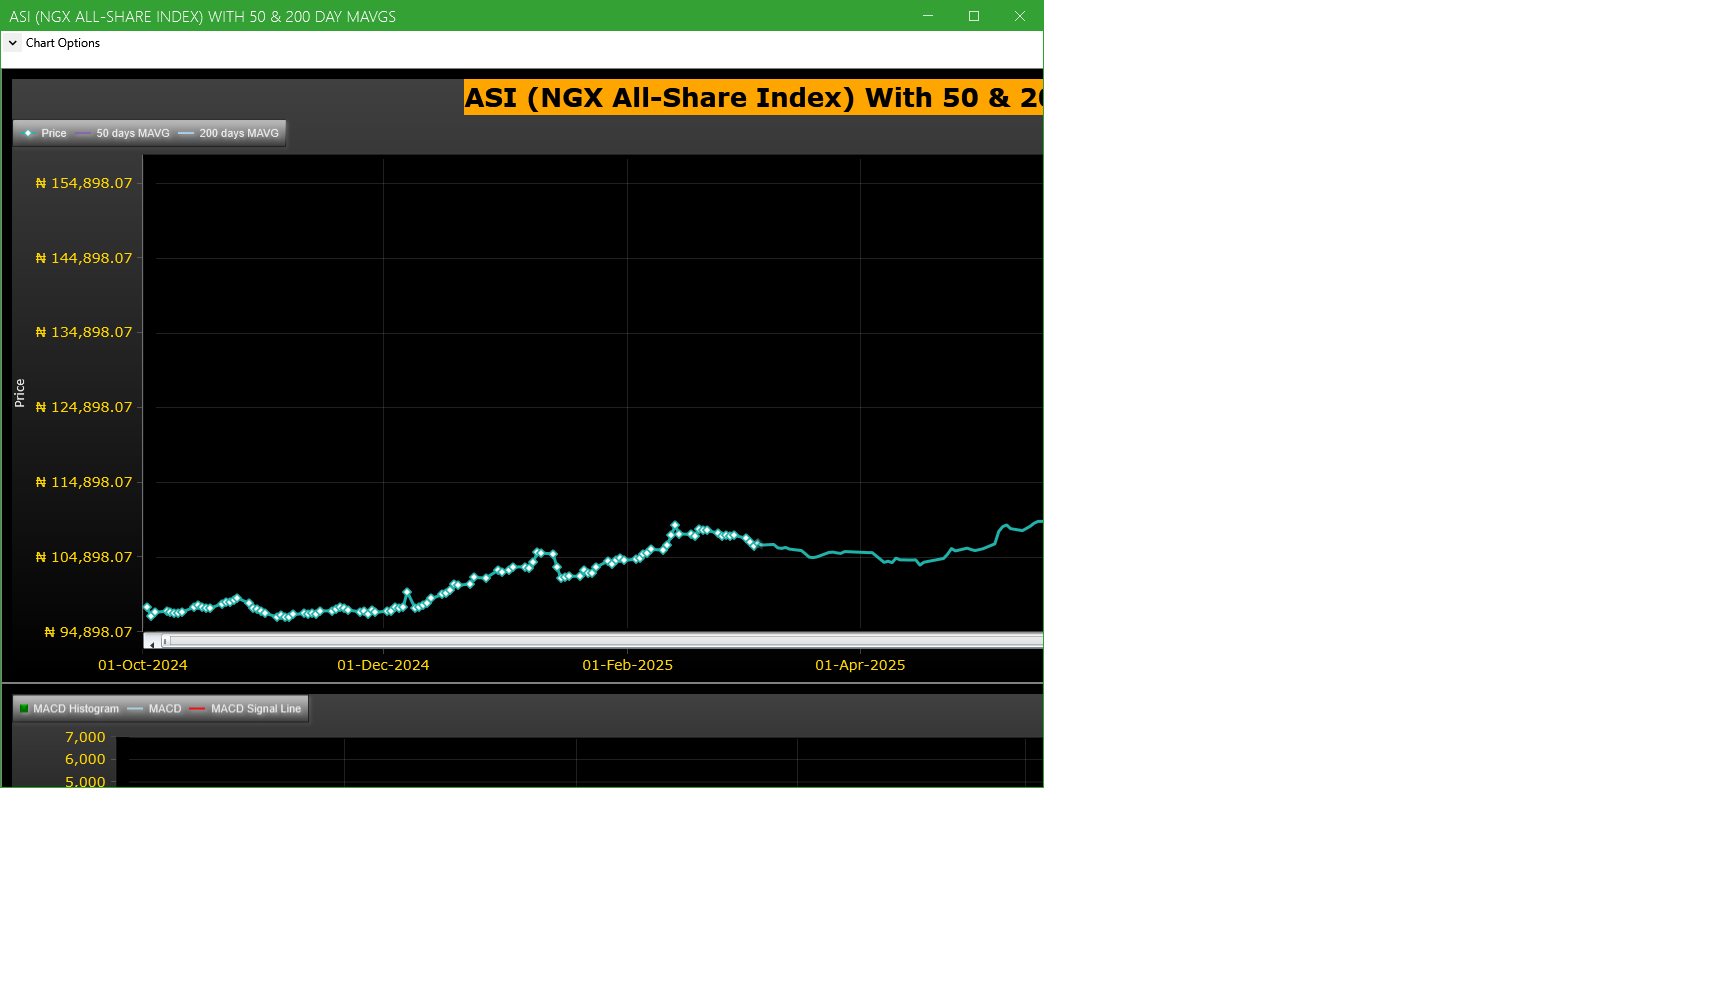
Market Trend - ASI (NGX All-Share-Index) With 50 & 200 Day MAvgs Chart
Technical traders typically use the 50 & 200 day moving averages to aid in choosing
where to enter or exit a position, which then causes these levels to act as strong
support or resistance. As a general guideline, if the price is above a moving average,
the trend is up. If the price is below a moving average, the trend is down.
It is important to note that critics of technical analysis say that moving averages act
as support and resistance because so many traders use these indicators to inform their
trading decisions. Also moving averages tend to work quite well in strong trending conditions
but poorly in choppy or ranging conditions.
Trading Strategies: Crossovers
Crossovers are one of the main moving average strategies. The first type is a price crossover,
which is when the price crosses above or below a moving average to signal a potential change
in trend. Another strategy is to apply two moving averages to a chart: one longer and one
shorter. When the shorter-term MA crosses above the longer-term MA, it is a buy signal, as
it indicates that the trend is shifting up. This is known as a golden cross. Meanwhile, when
the shorter-term MA crosses below the longer-term MA, it is a sell signal, as it indicates that
the trend is shifting down. This is known as a dead/death cross
For more detailed analysis,
- On InfoWARE Market Data Terminal <CI> <GO>
- On InfoWARE Finance Mobile App ( Android , iPhone & iPad and Windows 10) , "Research"
Unusual Volume: Volume traded is more than double the 90 day moving average (All exchanges; ASI & ASem). For more detailed analysis,
- On InfoWARE Market Data Terminal <UV> <GO>
- On InfoWARE Finance Mobile App ( Android , iPhone & iPad and Windows 10)
| Symbol | Name | Volume | 90DAvgVol | %VolChg | Price | LClose | %Chg | Trades | Value |
|---|---|---|---|---|---|---|---|---|---|
| TANTALIZER | TANTALIZERS PLC | 56.73M | 5.26M | 977.55 | 2.45 | 2.40 | 2.08 | 96 | 131.31M |
| CORNERST | CORNERSTONE INSURANCE COMPANY PLC. | 8.11M | 3.41M | 138.12 | 6.15 | 6.67 | -7.80 | 179 | 49.22M |
| ASOSAVINGS | ASO SAVINGS AND LOANS PLC | 5.35M | 575.12K | 830.60 | 0.86 | 0.79 | 8.86 | 8 | 4.60M |
| BUACEMENT | BUA CEMENT PLC | 3.59M | 988.99K | 262.89 | 175.00 | 180.00 | -2.78 | 790 | 632.95M |
| JBERGER | JULIUS BERGER NIG. PLC. | 2.19M | 283.03K | 672.99 | 138.00 | 134.00 | 2.99 | 263 | 305.81M |
Investment Insights - High Div. Stocks
Dividend stocks distribute a portion of the company earnings to investors on a regular basis and they can a great choice for investors looking for regular income. As an investment or trading strategy, high dividend yield equities provide annual cash payments as against mostly capital gains in the price of a stock. The list in the table below represent the highest dividend paying stocks from the list of the most liquid stocks in the NSE top 30.
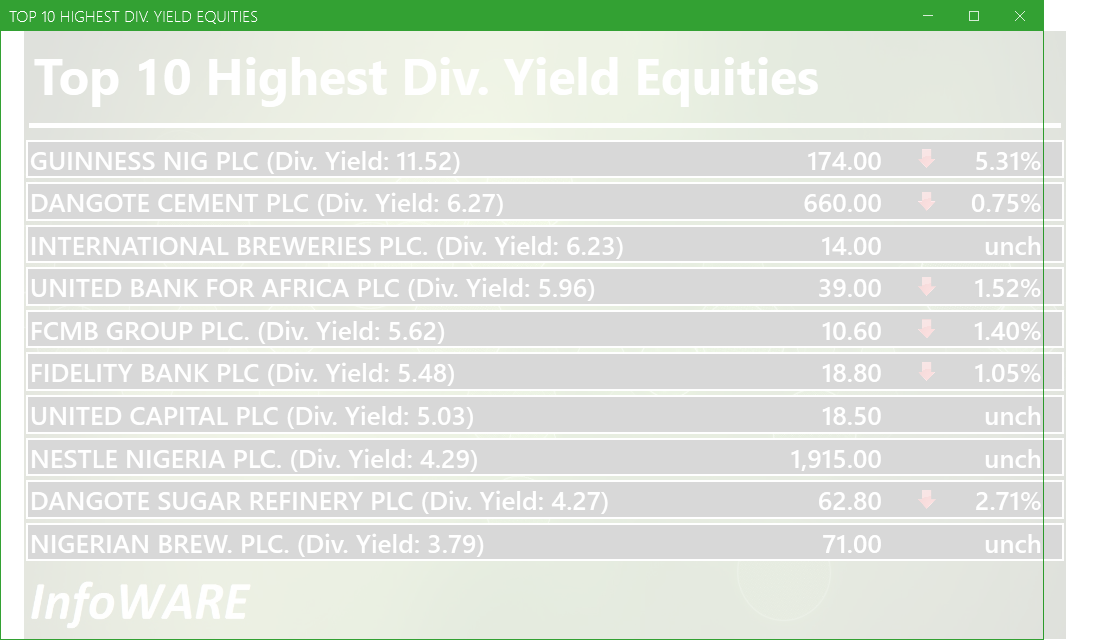
For more detailed analysis,
- On InfoWARE Market Data Terminal <HYIELD> <GO>
- On InfoWARE Finance Mobile App ( Android , iPhone & iPad and Windows 10) , "Research"
Investment Insights - Stocks outperforming the ASI but with approximately the same risk
These list of stocks represent equities that are less risky than the ASI but doing better than the ASI (All Shares Index) using the YTD (Year to Date) returns as the measure. The risk is measured by Beta. Beta is an assessment of a stock's tendency to undergo price changes, (its volatility), as well as its potential returns compared to the ASI. It is expressed as a ratio, where a score of 1 represents performance comparable to the ASI, and returns above or below the market may receive scores greater or lower than 1.
For a full list of both positively and negatively corelated stocks visit InfoWARE Market Data Terminal
- On InfoWARE Market Data Terminal <BANL> <GO>
- On InfoWARE Finance Mobile App ( Android , iPhone & iPad and Windows 10)
| Symbol | DivYield | PE | EPS | Beta | %ChgYTD | ASIYTDReturn | BetaDiff |
|---|---|---|---|---|---|---|---|
| HONYFLOUR | 1.40 | 16.28 | 0.31 | 0.99 | 217.92 | 49.51 | 0.01 |
| CAVERTON | 5.52 | 1.15 | 1.57 | 0.98 | 150.98 | 49.51 | 0.02 |
| ROYALEX | 7.81 | 0.00 | 0.00 | 0.96 | 90.91 | 49.51 | 0.04 |
| CORNERST | 5.28 | 8.62 | 0.35 | 0.93 | 55.30 | 49.51 | 0.07 |
| DEAPCAP | 13.76 | 188.84 | 0.01 | 0.89 | 50.83 | 49.51 | 0.11 |
| UNIVINSURE | 0.00 | 0.00 | 0.00 | 0.83 | 56.94 | 49.51 | 0.17 |
| FTNCOCOA | 1.60 | 0.00 | 0.00 | 0.79 | 165.96 | 49.51 | 0.21 |
| NB | 3.79 | 16.95 | 1.60 | 0.79 | 121.88 | 49.51 | 0.21 |
| MAYBAKER | 3.75 | 58.94 | 0.14 | 0.78 | 80.85 | 49.51 | 0.22 |
| UNILEVER | 2.81 | 67.09 | 0.40 | 0.75 | 113.89 | 49.51 | 0.25 |
African Markets
| Name | LClose | Change | %Chg |
|---|---|---|---|
| BRVM Stock Exchange | 340.93 | -0.65 | -0.19 |
| Botswana Stock Exchange | 10,617.99 | 0.00 | 0.00 |
| Egyptian Exchange | 38,304.94 | 141.21 | 0.37 |
| Ghana Stock Exchange | 8,351.36 | -27.65 | -0.33 |
| Johannesburg Stock Exchange | 109,818.50 | 1,108.84 | 1.02 |
| Casablanca Stock Exchange | 19,410.19 | 36.81 | 0.19 |
| Malawi Stock Exchange | 597,297.78 | 3,975.26 | 0.67 |
| Nigeria Stock Exchange | 155,353.20 | -139.94 | -0.09 |
| Nairobi Securities Exchange | 183.22 | 2.15 | 1.19 |
| Namibian Stock Exchange | 2,033.78 | 25.90 | 1.29 |
| Rwanda Stock Exchange | 178.93 | -0.34 | -0.19 |
| Tunis Stock Exchange | 12,500.07 | -3.75 | -0.03 |
| Uganda Securities Exchange | 1,482.12 | 0.59 | 0.04 |
Nigeria Market Indexes
| Symbol | LClose | %Chg | WTD% | MTD% | QTD% | YTD% | MktCap | Trades |
|---|---|---|---|---|---|---|---|---|
| ASI | 154,260.96 | -0.70 | -0.79 | 7.89 | 7.89 | 49.51 | 25,661 | |
| NGX30 | 5,647.25 | -0.62 | -0.72 | 8.23 | 8.23 | 48.03 | 14,779 | |
| NGXAFRBVI | 3,299.28 | -0.14 | -1.48 | -7.05 | -7.05 | 32.99 | 5,214 | |
| NGXAFRHDYI | 21,450.41 | 0.24 | -0.01 | -3.64 | -3.64 | 25.97 | 6,695 | |
| NGXASEM | 1,392.88 | 0.00 | 0.00 | -9.44 | -9.44 | -12.05 | 3 | |
| NGXBNK | 1,453.39 | -0.35 | -1.01 | -4.18 | -4.18 | 33.65 | 5,550 | |
| NGXCG | 4,080.98 | -0.36 | -0.83 | 0.74 | 0.74 | 44.24 | 13,207 | |
| NGXCNSMRGDS | 3,585.99 | -0.24 | -0.66 | 6.01 | 6.01 | 106.76 | 3,194 | |
| NGXCOMMDTY | 1,236.93 | -1.59 | -1.59 | 10.26 | 10.26 | 23.69 | ||
| NGXGROWTH | 15,675.31 | 0.13 | -0.35 | 4.00 | 4.00 | 101.93 | 256 | |
| NGXINDUSTR | 5,908.30 | -1.57 | -1.81 | 16.58 | 16.58 | 65.42 | 2,715 | |
| NGXINS | 1,272.18 | -2.45 | -1.33 | 6.36 | 6.36 | 61.82 | 2,339 | |
| NGXLOTUSISLM | 13,902.15 | -0.87 | -0.92 | 17.11 | 17.11 | 99.52 | 5,460 | |
| NGXMAINBOARD | 7,369.93 | -0.94 | -0.97 | 4.62 | 4.62 | 47.28 | 18,349 | |
| NGXMERIGRW | 10,275.90 | -0.05 | -0.30 | 3.76 | 3.76 | 57.53 | 3,551 | |
| NGXMERIVAL | 12,968.91 | -0.46 | -2.00 | -2.99 | -2.99 | 24.34 | 7,139 | |
| NGXOILGAS | 2,918.32 | -3.68 | -3.60 | 15.53 | 15.53 | 7.64 | 352 | |
| NGXPENBRD | 2,879.90 | -0.73 | -0.77 | 8.63 | 8.63 | 57.23 | 21,041 | |
| NGXPENSION | 6,994.74 | -0.75 | -0.95 | 3.81 | 3.81 | 54.27 | 16,380 | |
| NGXPREMIUM | 15,700.81 | -0.27 | -0.48 | 14.67 | 14.67 | 61.32 | 7,056 | |
| NGXSOVBND | 668.40 | 0.00 | 0.50 | 1.69 | 1.69 | 11.11 | 0 |
For more detailed analysis,
- On InfoWARE Market Data Terminal <MKTINS> <GO>
- On InfoWARE Finance Mobile App ( Android, iPhone & iPad and Windows 10) , "Market Indexes"
Find the topic interesting? Will like to comment? Contact Us at solutions@infowarelimited.com
Top News

Chart Of The Day - ASI Chart Vs ASI Advance Decline Line (YTD) (29-Oct-2025 15:07:15.757)
InfoWARE AI Analyst Daily Market Report: 29-Oct-2025

[VSPBONDETF]>> DAILY INDICATIVE PRICES
[SIAMLETF40]>> DAILY INDICATIVE PRICES
[MERGROWTH]>> DAILY INDICATIVE PRICES
[XNSA]>> H2 2025 BC/DR TEST
[XNSA]>> CLOSING GONG CEREMONY
[XNSA]>> NGX FIXED INCOME INDICATIVE PRICE LIST FOR OCT 29, 2025
[XNSA]>> CORDROS MILESTONE FUNDS' BID & OFFER PRICES
[XNSA]>> FBF PRESENTATION BY THE INITIATES PLC
[XNSA]>> AELP CAPACITY BUILDING & ASSDA FORUM
Chart Of The Day - ASI Chart Vs ASI Advance Decline Line (YTD) (28-Oct-2025 15:07:19.179)
InfoWARE AI Analyst Daily Market Report: 28-Oct-2025
[XNSA]>> CORDROS MILESTONE FUNDS' BID & OFFER PRICES
[MERVALUE]>> DAILY INDICATIVE PRICES
[VETGOOD]>> DAILY INDICATIVE PRICES
[LOTUSHAL15]>> DAILY INDICATIVE PRICES
[XNSA]>> NGX FIXED INCOME INDICATIVE PRICE LIST FOR OCT 28, 2025
[XNSA]>> H2 2025 BC/DR TEST
[XNSA]>> CLOSING GONG CEREMONY
[XNSA]>> FBF PRESENTATION BY THE INITIATES PLC
[XNSA]>> AELP CAPACITY BUILDING & ASSDA FORUM
[XNSA]>> POSTPONED - FBF PRESENTATION BY ELLAH LAKES PLC
[XNSA]>> APPOINTMENT OF DIRECTORS (NORRENBERGER SECURITIES LIMITED)
[XNSA]>> APPOINTMENT OF A DIRECTOR
[SIAMLETF40]>> DAILY INDICATIVE PRICES
Chart Of The Day - ASI Chart Vs ASI Advance Decline Line (YTD) (27-Oct-2025 15:10:38.192)
InfoWARE AI Analyst Daily Market Report: 27-Oct-2025
[XNSA]>> APPOINTMENT OF A DIRECTOR
[XNSA]>> FBF PRESENTATION BY THE INITIATES PLC
Get IDIA - the stock trading app for the modern investor
Solutions by Business
Product Suites
Company
Contacts
- 8th Floor,
- South Atlantic Petroleum Towers,
- 1 Adeola Odeku Street,
- Victoria Island,
- Lagos, Nigeria.
- Email: solutions@infowarelimited.com
Follow Us
 |
 |
 |
 |