


InfoWARE AI Analyst Daily Market Report: 30-Oct-2025 | InfoWARE Finance
Get IDIA - the stock trading app for the modern investor


InfoWARE AI Analyst Daily Market Report: 30-Oct-2025
(Source: InfoWARE Terminal, Date: 30-Oct-2025)
Dear Investor,
NGX Daily Market Summary - Thursday, October 30, 2025
The NGX All Share Index (ASI) closed -0.38% lower at 154,260.98, breaking a three-day run despite the YTD returns holding robust at +48.94%. Market turnover saw a dramatic surge, jumping by +134.03% to ₦27.96B, powered by massive trades in large-caps and ETFs. While volume rose by 11% to 488 million shares, market breadth remained bearish (advancers/decliners ratio of 0.59x), with only 24 gainers to 41 losers — an indication of persistent sector-specific headwinds and cautious sentiment despite institutional dominance in value traded (93% of value).
-
Market Breadth & Turnover Trends:
- Market breadth weak at 0.59x (24 advancers, 41 decliners).
- Turnover up +134.03% — likely driven by block institutional trades (e.g., GTCO, ZenithBank, GEREGU).
- Volume traded increased to 488M shares; institutional activity dominated by value, not trade count.
-
Top Gainers:
- MERGROWTH (+10.00%) — bullish ETF rebound, notable 15DMA crossover.
- MERVALUE (+10.00%) — ETF with high RSI (64.7) showing further momentum.
- OANDO (+9.99%) — massive unusual volume (224% above avg), technical buy signal confirmed.
- ASOSAVINGS (+9.3%) — YTD leader (+88%), RSI 92.4 (overbought); momentum at extremes.
- AIICO (+5.26%) — insurance resurgence, strong move above 15DMA.
-
Top Losers:
- CADBURY (-10.00%) — bearish 15DMA breakdown, RSI steady; caution on food sector names.
- INTBREW (-10.00%) — new YTD low; continued sentiment deterioration.
- CHAMS (-10.00%) — also a top YTD loser (-67.1%), signaling structural weakness.
- LEARNAFRCA (-9.92%) — momentum reversal, bearish momentum confirmed by 15DMA cross.
- NAHCO (-9.49%) — elevated volume, bearish technicals (high RSI, breakdown below 15DMA).
Key Insights & Predictions
- Turnover Spike: The surge in turnover, despite negative ASI, hints at aggressive institutional rebalancing in large-caps and ETFs—typically a sign of sector rotation or big money repositioning pre-month-end.
- Advancers/Decliners: Losers far outnumbered gainers, underscoring persistent risk-off sentiment outside selected momentum names (see ETFs and financials).
-
Unusual Volume:
- ASOSAVINGS (vol >11,000% above avg!), OANDO, GEREGU, GTCO saw dramatic trades. OANDO and ASOSAVINGS align as both price and momentum leaders.
- GTCO heavy block trades, but price closed -1.49% lower—possible short-term supply absorption ahead of rebound?
-
YTD Gain/Loss Trends:
-
Top YTD Gainers: ASOSAVINGS (+88%) is both a day and YTD leader; volume/RSI suggest overbought crowding, caution for new entry.
OANDO also appears in both top 5D and unusual volume, showing a new technical impulse. - Top YTD Losers: CHAMS (-67.1%) and INTBREW (-129.09%) also top today's losers. Most bear names are not technical rebounders, pointing to continued risk.
-
Top YTD Gainers: ASOSAVINGS (+88%) is both a day and YTD leader; volume/RSI suggest overbought crowding, caution for new entry.
-
Bullish Momentum Signals:
- Strongest overlaps: MERGROWTH, OANDO, AIICO — each up on day, marked by high/unusual volume, 15DMA crosses, and strong sectoral rotation.
- ASOSAVINGS has RSI 92.4—extreme overbought. Watch for snapbacks/corrections by short-term traders.
-
Bearish Momentum Signals:
- CADBURY, LEARNAFRCA, NAHCO — all confirmed by 15DMA breakdown. NAHCO trades with high volume and RSI ~70: classic exhaustion risk.
-
Dividend Impact:
- No top gainers/losers today currently exhibit high dividend yields; defensive (high-dividend, low-beta) plays may remain sidelined until breadthis restored.
Contrarian Signals
- MERVALUE ETF: RSI rose from 56.3 to 64.7 with bullish MACD and near overbought zone after +10% jump; but as an ETF, sudden reversals are possible if sentiment shifts. Watch for mean-reversion.
- NAHCO: Closed -9.5% with RSI at 69.6 (nearing "overbought") even as price broke key 15DMA—a classic "blow-off" move.
- ASOSAVINGS: Explosive +9.3% daily move with 92.4 RSI (extreme overbought) and >100x volume. Might be ripe for profit-taking or sharp pullback.
- AIICO: Peaking near 15DMA, but RSI at 47.9 down from 53.7 — short-term uptrend may be losing steam.
Sectoral Heatmap & Technical Table
| Sector | Performance | Retail/Institutional Focus | Tech Trend |
|---|---|---|---|
| Banking | GTCO -1.49%, ZenithBank -1.10% | GTCO & ZenithBank = institutional block trades | Heavy sell volume, RSI neutral/slightly below avg |
| Integrated Oil/Gas | OANDO +9.99% | Unusual volume retail/institutional overlap | Strong bullish breakout, 15DMA cross, MACD support |
| ETFs | MERGROWTH +10.0%, MERVALUE +10.0% | Typically more institutional flows | MERVALUE: RSI up 8pts, MACD bullish crossover |
| Transport-Related Svc | NAHCO -9.49% | Institutional blocks | Bearish breakdown, RSI at exhaustion |
| Insurance | AIICO +5.26% | Modest retail flows | Bullish 15DMA cross, RSI moderating |
Dividend-Beta Matrix: Defensive Opportunities
| Stock | Dividend Yield (%) | Beta | Recent Performance |
|---|---|---|---|
| AIICO | 4.13 | 1.33 | +5.26% (bullish, moderate risk) |
| CUSTODIAN | 1.20 | 0.54 | +4.71% (bullish, low risk) |
| UPDCREIT | 10.87 | -0.11 | -2.05% (bearish, low-beta defensive under pressure) |
| NPFMCRFBK | 8.00 | 0.29 | -3.33% (bearish recently, but likely defensive support) |
Implication: Defensive (high-dividend/low-beta) names, while technically weak today, may become a magnet if broad market weakness continues. AIICO and CUSTODIAN offer both yield and moderate uptrend.
Institutional Clustering Alerts
- GTCO: 19.5% of volume, 29.18% of institutional trade value — continuous block activity signals possible further institutional moves or price leveling.
- ZENITHBANK: Over ₦723M in block trade (20.17% institutional value share); price was off -1.10%. Ongoing accumulation or large rebalancing?
- OANDO: Strong institutional presence and retail follow-through; breakout likely to see further volatility.
Trader Recommendations & Caution
- Bullish 15DMA cross stocks (MERGROWTH, OANDO, AIICO): Momentum may persist, but caution required on ASOSAVINGS given extreme RSI/volume spike (potential for sharp pullback).
- Bearing momentum stocks (CADBURY, NAHCO, LEARNAFRCA): Avoid fresh longs; look for reversal signs or short-term bounces only after RSI cools off.
- Institutional Accumulation: Monitor block-trade heavyweights (GTCO, ZenithBank, OANDO) for hints on sector rotation.
- Defensive Yield Names: Consider AIICO, CUSTODIAN for yield/value, especially if continued breadth weakness.
Market Activity/Trades Summary Insights
-
Retail vs Institutional:
- Retail: 61% of trades; only 36% of volume and 7% of value (small-ticket trades dominate magnitude, larger tickets institutional strength).
- Institutions: 39% of trades but 63.8% of volume, 93% of trade value — major market moves driven by institutions today.
-
Top 5 Institutional Stocks:
- GTCO: Value leader (₦8.73B), block trading.
- ARADEL
- OANDO
- ZENITHBANK
- NAHCO
-
Top 5 Retail Stocks:
- MTNN (Telecom giant, stable)
- FIDELITYBK (banking play, steady retail interest)
- GTCO (also strong institutional follow)
- ACCESSCORP
- ZENITHBANK (both institutional and retail overlap)
Tuesday/Wednesday Special: YTD Top 5 Gainers & Losers
| YTD Top Gainers | YTD %Chg | 15DMA vs 50DMA Sparkline | RSI | Key Tech Note |
|---|---|---|---|---|
| ASO SAVINGS | +88.00% | ▲15DMA>50DMA | 92.4 | Overbought, extreme volume, parabolic move |
| BERGER PAINTS | +112.5% | ▲15DMA>50DMA | 65.9 | Strong industrials uptrend |
| AIICO INSURANCE | +154.8% | ▲15DMA>50DMA | 47.9 | New bullish leg, moderate RSI |
| SOVRENINS | +251.2% | ▲15DMA>50DMA | 70.2 | Insurance/retail favorite; at RSI threshold |
| OANDO | -28.9% | ▲15DMA>50DMA | 43.1 | Recent technical reversal; volume surge |
YTD Losers:
| YTD Top Losers | YTD %Chg | 15DMA vs 50DMA | RSI | Key Tech Note |
|---|---|---|---|---|
| CHAMS PLC | -67.1% | ▼15DMA<50DMA | 51.8 | Persistent selling; not yet oversold |
| JOHN HOLT PLC | -30.7% | ▼15DMA<50DMA | 19.9 | Deep oversold zone, possibility for dead-cat bounce |
| CORNERSTONE | -41.4% | ▼15DMA<50DMA | 46.2 | Loss momentum persists |
| IKEJA HOTEL PLC | -40.5% | ▼15DMA<50DMA | 33.5 | Bounce unlikely before RSI/sub-30 |
| ETRANZACT | -95.4% | ▼15DMA<50DMA | 33.1 | Panic selling, possible watch for reversal |
Hidden Insights & Actionable Takeaways
- Momentum is highly bifurcated: select ETFs, oil & gas, and insurance drive the upside with technical buy signals, while old-guard industrial, transport, and food names are in multi-factor technical breakdown.
- Institutional flows are dictating the market’s tempo; retail investors should track these block moves for early sector rotation warning.
- Defensive yields have not led the rebound yet, but technically stable names (e.g., AIICO, CUSTODIAN) might be ripe if volatility persists.
- Caution: Many top movers (ASOSAVINGS, OANDO) are now "crowded trades” — discipline on risk management and trailing stops is key.
- Watch for rapid reversals in overbought names and rebounding volume in top losers; contrarian swing may follow if institutional appetite shifts.
|
Top ASI Gainers Over Last 5 Trading Days
|
Top ASI Losers Over Last 5 Trading Days
|
For more detailed analysis, on InfoWARE Market Data Terminal <NSEPERF> <GO>
On InfoWARE Finance Mobile App (Android, iPhone & iPad, Windows Phone and Windows 8/10), "Top Gainers & Losers"
MERISTEM GROWTH EXCHANGE TRADED FUND (MERGROWTH) topped the advancers list closing at N381.70 with a gain of 10.00% followed by MERISTEM VALUE EXCHANGE TRADED FUND (MERVALUE) which closed at N242.00 with a gain of 10.00%.
On the flip side INTERNATIONAL BREWERIES PLC. (INTBREW) and CADBURY NIGERIA PLC. (CADBURY) topped the decliners log with a loss of -10.00% at a close of N12.60, and -10.00% to close the day at N62.55 respectively.
| Symbol | LClose | %Chg |
|---|---|---|
| MERGROWTH | 381.70 | 10.00 |
| MERVALUE | 242.00 | 10.00 |
| OANDO | 46.80 | 9.99 |
| ASOSAVINGS | 0.94 | 9.30 |
| AIICO | 4.00 | 5.26 |
| Symbol | LClose | %Chg |
|---|---|---|
| INTBREW | 12.60 | -10.00 |
| CADBURY | 62.55 | -10.00 |
| CHAMS | 3.51 | -10.00 |
| LEARNAFRCA | 5.90 | -9.92 |
| NAHCO | 113.00 | -9.49 |
For more detailed analysis,
- On InfoWARE Market Data Terminal <TOPG> <GO>
- On InfoWARE Finance Mobile App ( Android, iPhone & iPad and Windows 10) , "Top Gainers & Losers"
Currency Market
In the currency market, the Naira appreciated 0.10%(1.52) against the Dollar to settle at 1 to 1NSE: Bull Signal - Price crossed above 15 Day MA
This signal implies these stocks are under buying pressure and the price might continue to rise and therefore positions should be monitored closely. Further suggested analysis include looking at the overall market (ASI) to see if the uptrend is market wide, sector wide or specific to the stock. Portfolio managers tend to use this as a signal to do more research to add to their positions or lock in some profits. Typically further analysis should be done using commands like PC and RV on the InfoWARE Market Data Terminal. Another command is ALERTS to set price triggers for possible exit or entry as necessary
For more detailed analysis,
- On InfoWARE Market Data Terminal <NSEPERF> <GO>
- On InfoWARE Finance Mobile App ( Android , iPhone & iPad and Windows 10) , "Top Gainers & Losers"
| Symbol | Price | %Chg | 15DMA | PE | EPS | DivY | MktCap | Vol | Trades | Value | LstTradeTime |
|---|---|---|---|---|---|---|---|---|---|---|---|
| MERGROWTH | 381.70 | 9.09 | 362.47 | 0.00 | 0.00 | 816.00 | 7.00 | 284.75K | 30-Oct-2025 14:30:33.460 | ||
| OANDO | 46.80 | 9.08 | 44.17 | 24.10 | 2.53 | 1.15 | 581.79B | 12.70M | 736.00 | 552.35M | 30-Oct-2025 14:30:09.470 |
| AIICO | 4.00 | 5.00 | 3.92 | 2.01 | 0.60 | 4.13 | 146.42B | 16.24M | 332.00 | 64.17M | 30-Oct-2025 14:30:33.223 |
| MAYBAKER | 17.85 | 4.76 | 17.56 | 58.94 | 0.14 | 3.75 | 30.80B | 1.96M | 204.00 | 35.05M | 30-Oct-2025 14:30:09.033 |
| CUSTODIAN | 42.45 | 4.71 | 42.30 | 3.80 | 3.29 | 1.20 | 249.69B | 919.69K | 159.00 | 37.43M | 30-Oct-2025 14:30:08.263 |
| UNIVINSURE | 1.17 | 3.42 | 1.14 | 0.00 | 0.00 | 0.00 | 18.72B | 13.97M | 153.00 | 15.98M | 30-Oct-2025 14:30:10.433 |
| MCNICHOLS | 3.30 | 3.03 | 3.26 | 26.80 | 0.05 | 5.88 | 2.37B | 1.48M | 49.00 | 4.80M | 30-Oct-2025 14:30:35.920 |
NSE: BEAR Signal - Price crossed below 15 Day MA
This signal implies these stocks are under selling pressure and the price might continue to slide and therefore positions should be monitored closely. Further suggested analysis include looking at the overall market (ASI) to see if the downtrend is market wide, sector wide or specific to the stock. If the overal market trend is upwards, then since these stocks are heading in the opposite direction, then further analysis should be done using commands like PC and RV on the InfoWARE Market Data Terminal. Another command is ALERTS to set price triggers for possible exit is necessar
For more detailed analysis,
- On InfoWARE Market Data Terminal <BEARM> <GO>
- On InfoWARE Finance Mobile App ( Android , iPhone & iPad and Windows 10)
| Symbol | Price | %Chg | 15DMA | PE | EPS | DivY | MktCap | Vol | Trades | Value | LstTradeTime |
|---|---|---|---|---|---|---|---|---|---|---|---|
| LEGENDINT | 5.84 | 0.00 | 5.87 | 0.00 | 0.00 | 397.72K | 51.00 | 2.12M | 30-Oct-2025 14:30:08.887 | ||
| UPDCREIT | 7.30 | -2.05 | 7.38 | 9.09 | 0.57 | 10.87 | 19.48B | 3.16M | 208.00 | 22.45M | 30-Oct-2025 14:30:19.590 |
| CWG | 18.00 | -2.22 | 18.34 | 0.00 | 0.00 | 2.46 | 45.45B | 828.80K | 115.00 | 14.92M | 30-Oct-2025 14:30:08.290 |
| TRANSCORP | 47.00 | -2.23 | 47.74 | 0.00 | 0.00 | 0.23 | 1,910.46B | 2.64M | 268.00 | 123.09M | 30-Oct-2025 14:30:10.173 |
| NPFMCRFBK | 3.00 | -3.33 | 3.09 | 5.63 | 0.27 | 8.00 | 17.98B | 1.78M | 56.00 | 5.36M | 30-Oct-2025 14:30:09.420 |
| UACN | 66.50 | -6.92 | 70.02 | 9.38 | 2.35 | 1.00 | 194.59B | 2.33M | 256.00 | 154.50M | 30-Oct-2025 14:30:10.303 |
| UPL | 5.04 | -9.13 | 5.45 | 7.13 | 0.59 | 0.60 | 2.17B | 2.47M | 61.00 | 12.59M | 30-Oct-2025 14:30:10.470 |
| TIP | 13.05 | -9.27 | 13.83 | 0.00 | 11.61B | 2.98M | 181.00 | 39.94M | 30-Oct-2025 14:30:35.973 | ||
| NAHCO | 113.00 | -10.49 | 118.52 | 92.98 | 0.41 | 6.66 | 220.24B | 6.80M | 316.00 | 786.46M | 30-Oct-2025 14:30:09.237 |
| LEARNAFRCA | 5.90 | -11.02 | 6.50 | 5.79 | 0.51 | 8.53 | 4.55B | 356.01K | 26.00 | 2.11M | 30-Oct-2025 14:30:08.867 |
| CADBURY | 62.55 | -11.11 | 69.03 | 33.25 | 0.64 | 1.88 | 117.48B | 3.92M | 295.00 | 245.55M | 30-Oct-2025 14:30:07.657 |
| FGS202760 | 71.00 | -40.70 | 95.69 | 0.00 | 0.00 | 1.00 | 1.00 | 710.01 | 30-Oct-2025 14:30:13.110 |
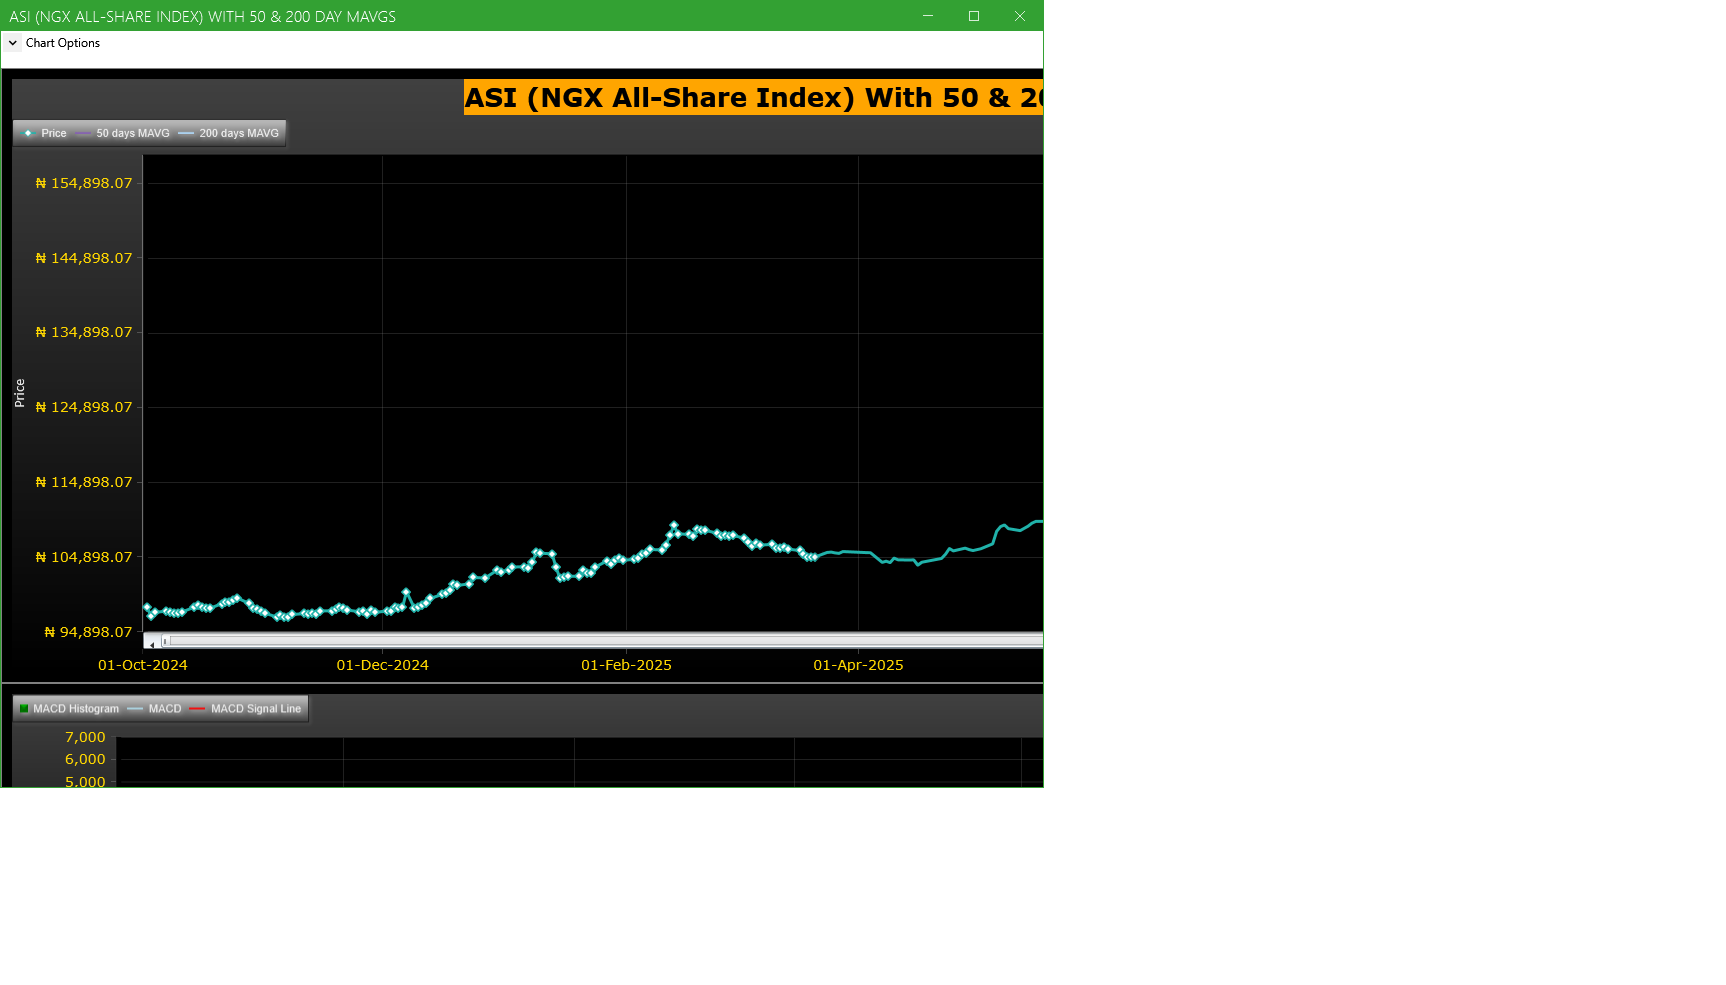
Market Trend - ASI (NGX All-Share-Index) With 50 & 200 Day MAvgs Chart
Technical traders typically use the 50 & 200 day moving averages to aid in choosing
where to enter or exit a position, which then causes these levels to act as strong
support or resistance. As a general guideline, if the price is above a moving average,
the trend is up. If the price is below a moving average, the trend is down.
It is important to note that critics of technical analysis say that moving averages act
as support and resistance because so many traders use these indicators to inform their
trading decisions. Also moving averages tend to work quite well in strong trending conditions
but poorly in choppy or ranging conditions.
Trading Strategies: Crossovers
Crossovers are one of the main moving average strategies. The first type is a price crossover,
which is when the price crosses above or below a moving average to signal a potential change
in trend. Another strategy is to apply two moving averages to a chart: one longer and one
shorter. When the shorter-term MA crosses above the longer-term MA, it is a buy signal, as
it indicates that the trend is shifting up. This is known as a golden cross. Meanwhile, when
the shorter-term MA crosses below the longer-term MA, it is a sell signal, as it indicates that
the trend is shifting down. This is known as a dead/death cross
For more detailed analysis,
- On InfoWARE Market Data Terminal <CI> <GO>
- On InfoWARE Finance Mobile App ( Android , iPhone & iPad and Windows 10) , "Research"
Unusual Volume: Volume traded is more than double the 90 day moving average (All exchanges; ASI & ASem). For more detailed analysis,
- On InfoWARE Market Data Terminal <UV> <GO>
- On InfoWARE Finance Mobile App ( Android , iPhone & iPad and Windows 10)
| Symbol | Name | Volume | 90DAvgVol | %VolChg | Price | LClose | %Chg | Trades | Value |
|---|---|---|---|---|---|---|---|---|---|
| GTCO | GUARANTY TRUST HOLDING COMPANY PLC | 97.92M | 18.22M | 437.48 | 89.00 | 90.35 | -1.49 | 1,537 | 8.72B |
| ASOSAVINGS | ASO SAVINGS AND LOANS PLC | 75.38M | 660.08K | 11,320.24 | 0.94 | 0.86 | 9.30 | 173 | 70.86M |
| OANDO | OANDO PLC | 12.70M | 3.92M | 224.34 | 46.80 | 42.55 | 9.99 | 736 | 552.35M |
| GEREGU | GEREGU Power PLC | 8.53M | 354.41K | 2,307.56 | 1,141.50 | 1,141.50 | 0.00 | 141 | 8.77B |
| DEAPCAP | DEAP CAPITAL MANAGEMENT & TRUST PLC | 6.97M | 3.14M | 122.10 | 1.90 | 1.81 | 4.97 | 182 | 12.90M |
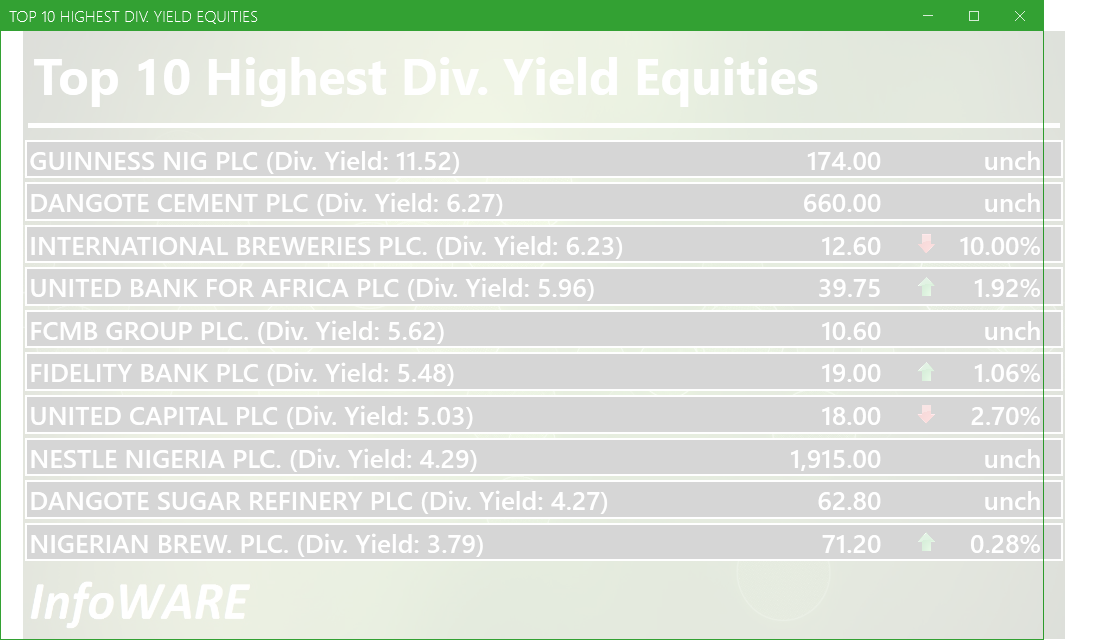
Investment Insights - High Div. Stocks
Dividend stocks distribute a portion of the company earnings to investors on a regular basis and they can a great choice for investors looking for regular income. As an investment or trading strategy, high dividend yield equities provide annual cash payments as against mostly capital gains in the price of a stock. The list in the table below represent the highest dividend paying stocks from the list of the most liquid stocks in the NSE top 30.
For more detailed analysis,
- On InfoWARE Market Data Terminal <HYIELD> <GO>
- On InfoWARE Finance Mobile App ( Android , iPhone & iPad and Windows 10) , "Research"
African Markets
| Name | LClose | Change | %Chg |
|---|---|---|---|
| BRVM Stock Exchange | 343.84 | 2.90 | 0.85 |
| Botswana Stock Exchange | 10,577.83 | -40.35 | -0.38 |
| Egyptian Exchange | 38,229.53 | -76.61 | -0.20 |
| Ghana Stock Exchange | 8,345.01 | -6.68 | -0.08 |
| Johannesburg Stock Exchange | 110,371.30 | 549.11 | 0.50 |
| Lusaka Stock Exchange | 25,446.31 | 10.17 | 0.04 |
| Casablanca Stock Exchange | 19,501.70 | 91.23 | 0.47 |
| Malawi Stock Exchange | 597,580.08 | 298.64 | 0.05 |
| Nigeria Stock Exchange | 154,260.98 | -1,087.44 | -0.70 |
| Namibian Stock Exchange | 2,037.71 | 3.86 | 0.19 |
| Rwanda Stock Exchange | 179.01 | 0.07 | 0.04 |
| Tunis Stock Exchange | 12,511.64 | 11.25 | 0.09 |
| Uganda Securities Exchange | 1,484.89 | 2.82 | 0.19 |
Nigeria Market Indexes
| Symbol | LClose | %Chg | WTD% | MTD% | QTD% | YTD% | MktCap | Trades |
|---|---|---|---|---|---|---|---|---|
| ASI | 153,676.82 | -0.38 | -1.17 | 7.48 | 7.48 | 48.94 | 27,043 | |
| NGX30 | 5,627.18 | -0.36 | -1.07 | 7.84 | 7.84 | 47.51 | 15,574 | |
| NGXAFRBVI | 3,281.81 | -0.53 | -2.00 | -7.54 | -7.54 | 32.29 | 5,493 | |
| NGXAFRHDYI | 21,314.08 | -0.64 | -0.64 | -4.25 | -4.25 | 25.17 | 6,749 | |
| NGXASEM | 1,392.88 | 0.00 | 0.00 | -9.44 | -9.44 | -12.05 | 2 | |
| NGXBNK | 1,454.25 | 0.06 | -0.95 | -4.12 | -4.12 | 33.73 | 6,381 | |
| NGXCG | 4,072.43 | -0.21 | -1.04 | 0.53 | 0.53 | 43.94 | 14,121 | |
| NGXCNSMRGDS | 3,541.97 | -1.23 | -1.88 | 4.71 | 4.71 | 104.22 | 3,109 | |
| NGXCOMMDTY | 1,230.45 | -0.52 | -2.11 | 9.68 | 9.68 | 23.04 | ||
| NGXGROWTH | 15,564.55 | -0.71 | -1.05 | 3.27 | 3.27 | 100.50 | 287 | |
| NGXINDUSTR | 5,893.32 | -0.25 | -2.06 | 16.29 | 16.29 | 65.00 | 2,714 | |
| NGXINS | 1,256.08 | -1.27 | -2.58 | 5.01 | 5.01 | 59.77 | 1,784 | |
| NGXLOTUSISLM | 13,760.34 | -1.02 | -1.93 | 15.91 | 15.91 | 97.48 | 5,328 | |
| NGXMAINBOARD | 7,331.04 | -0.53 | -1.50 | 4.06 | 4.06 | 46.50 | 19,963 | |
| NGXMERIGRW | 10,272.59 | -0.03 | -0.33 | 3.73 | 3.73 | 57.48 | 3,802 | |
| NGXMERIVAL | 12,958.35 | -0.08 | -2.08 | -3.06 | -3.06 | 24.24 | 7,937 | |
| NGXOILGAS | 2,909.02 | -0.32 | -3.91 | 15.16 | 15.16 | 7.30 | 433 | |
| NGXPENBRD | 2,874.16 | -0.20 | -0.96 | 8.41 | 8.41 | 56.92 | 22,294 | |
| NGXPENSION | 6,967.25 | -0.39 | -1.33 | 3.41 | 3.41 | 53.67 | 17,490 | |
| NGXPREMIUM | 15,683.67 | -0.11 | -0.59 | 14.55 | 14.55 | 61.14 | 6,793 | |
| NGXSOVBND | 668.40 | 0.00 | 0.50 | 1.69 | 1.69 | 11.11 | 0 |
For more detailed analysis,
- On InfoWARE Market Data Terminal <MKTINS> <GO>
- On InfoWARE Finance Mobile App ( Android, iPhone & iPad and Windows 10) , "Market Indexes"
Find the topic interesting? Will like to comment? Contact Us at solutions@infowarelimited.com
Top News

Chart Of The Day - ASI Chart Vs ASI Advance Decline Line (YTD) (30-Oct-2025 15:10:38.799)
InfoWARE AI Analyst Daily Market Report: 30-Oct-2025

[XNSA]>> NEW LISTING OF FGN BONDS FOR JUNE AND AUGUST 2025
[XNSA]>> DAILY FUND PRICE SUBMISSION - FCMB ASSET MANAGEMENT LIMITED
[VSPBONDETF]>> DAILY INDICATIVE PRICES
[XNSA]>> OFF MARKET TRADE
[XNSA]>> LISTING OF FGN SAVINGS BONDS FOR OCTOBER 2025
[LTUSHAL15]>> DAILY INDICATIVE PRICES
[XNSA]>> H2 2025 BC/DR TEST
[XNSA]>> CLOSING GONG CEREMONY
[XNSA]>> NGX FIXED INCOME INDICATIVE PRICE LIST FOR OCT 30, 2025
[XNSA]>> FBF PRESENTATION BY THE INITIATES PLC
[XNSA]>> AELP CAPACITY BUILDING & ASSDA FORUM
[XNSA]>> CORDROS MILESTONE FUNDS' BID & OFFER PRICES
[XNSA]>> NOTIFICATION OF PRICE ADJUSTMENT
[STANBICETF30]>> DAILY INDICATIVE PRICES
Chart Of The Day - ASI Chart Vs ASI Advance Decline Line (YTD) (29-Oct-2025 15:07:15.757)
InfoWARE AI Analyst Daily Market Report: 29-Oct-2025
[VSPBONDETF]>> DAILY INDICATIVE PRICES
[SIAMLETF40]>> DAILY INDICATIVE PRICES
[MERGROWTH]>> DAILY INDICATIVE PRICES
[XNSA]>> H2 2025 BC/DR TEST
[XNSA]>> CLOSING GONG CEREMONY
[XNSA]>> NGX FIXED INCOME INDICATIVE PRICE LIST FOR OCT 29, 2025
[XNSA]>> CORDROS MILESTONE FUNDS' BID & OFFER PRICES
[XNSA]>> FBF PRESENTATION BY THE INITIATES PLC
[XNSA]>> AELP CAPACITY BUILDING & ASSDA FORUM
Chart Of The Day - ASI Chart Vs ASI Advance Decline Line (YTD) (28-Oct-2025 15:07:19.179)
InfoWARE AI Analyst Daily Market Report: 28-Oct-2025
[XNSA]>> CORDROS MILESTONE FUNDS' BID & OFFER PRICES
Get IDIA - the stock trading app for the modern investor
Solutions by Business
Product Suites
Company
Contacts
- 8th Floor,
- South Atlantic Petroleum Towers,
- 1 Adeola Odeku Street,
- Victoria Island,
- Lagos, Nigeria.
- Email: solutions@infowarelimited.com
Follow Us
 |
 |
 |
 |