


InfoWARE AI Analyst Daily Market Report: 28-Oct-2025 | InfoWARE Finance
Get IDIA - the stock trading app for the modern investor


InfoWARE AI Analyst Daily Market Report: 28-Oct-2025
(Source: InfoWARE Terminal, Date: 28-Oct-2025)
Dear Investor,
NGX Market Wrap – Tuesday, October 28, 2025
Today, the NGX ASI slipped marginally by -0.09% to close at 155,496.15, driven by mixed sector performances and a soft risk-off sentiment. Notably, although the benchmark dipped, market activity heated up: turnover surged by 25.73% to ₦21.36B on volumes of 474.12M shares, a clear sign of heightened trading intensity. Breadth was negative at 0.77x (30 advancers vs. 39 decliners), indicating more stocks lost ground, though both retail and institutional investors were active, especially in large caps and high-volatility movers. Insurance names and select industrials stole the spotlight, while select ETFs and financials took a breather amid profit-taking.
Key Trends in Market Breadth & Activity
- Turnover Spike: Trading value jumped by 25.73% day-on-day, predominantly from institutional flows (90.39% of total value), suggesting sizable block trades and portfolio repositioning.
- Volume Leaders: Volume was up in 67 stocks vs. down in 75, as a handful of large trades (esp. in DANGCEM, STANBIC, ASOSAVINGS) resulted in outsized turnover/volume metrics.
- Advancers vs. Decliners: Breadth of 0.77x (30:39) signals underlying pockets of caution; profit-taking evident on recent outperformers.
Daily Gainers & Losers – Stock-specific Highlights
| Stock | % Change | RSI | MACD | Key Insight |
|---|---|---|---|---|
| SOVRENINS | +9.88% | 65.00 | 0.27 (bullish) | Continues momentum; very high YTD run; watch for overextension soon. |
| ASOSAVINGS | +9.72% | 87.88 | 0.04 (mildly bullish) | RSI deep in overbought territory; caution for reversal. *Unusual volume spike* |
| BERGER | +9.25% | 55.71 | 0.29 | Sustained uptrend; strong technical base with room to run. |
| WAPIC | +6.90% | 43.23 | -0.03 | Early reversal signs; underperforming RSI. |
| AIICO | +6.13% | 45.95 | 0.01 | Moves above 15DMA – bullish momentum for insurers. |
| Stock | % Change | RSI | MACD | Key Insight |
|---|---|---|---|---|
| GREENWETF | -8.90% | 69.73 | 43.72 (volatile) | High RSI + profit-taking after spikes; ETF volatility. |
| MCNICHOLS | -8.81% | 47.55 | -0.05 | Oversold near-term; technical downtrend intact. |
| LASACO | -8.62% | 46.72 | -0.03 | Losses after weak rally; momentum fading. |
| LIVESTOCK | -7.69% | 50.75 | -0.01 | Crossed below 15DMA; bearish technicals. |
| JOHNHOLT | -7.69% | 32.34 | -0.18 | RSI approaching oversold; monitor for reversal signs. |
- Unusual Volume: ASOSAVINGS (+977.96% vol), STANBIC (+841.52% vol), DANGCEM (+312.06% vol) — big flows driving price, potential institutional accumulation or distribution; such spikes often precede major trend moves or reversals.
- Notable RSI Patterns: ASOSAVINGS’ RSI 87.88 signals extreme overbought; history suggests rapid corrections after such readings. GREENWETF remains high at 69.73 despite a large selloff—potential for see-saw volatility.
YTD Top Gainers & Losers (Tuesday Highlight)
| Stock | YTD % | 5D % | 1D % | RSI | MACD vs Signal | Div Yield |
|---|---|---|---|---|---|---|
| SOVRENINS | +261.79% | +19.95% | +9.88% | 65.00 | ▲ Bullish (+0.05) | 3.75% |
| ASOSAVINGS | +58.00% | +31.67% | +9.72% | 87.88 | ▲ Small bull | 10.00% |
| EUNISELL | +234.72% | +12.17% | +5.82% | 92.30 | ▲ Bullish | 0.31% |
| ARADEL | +45.32% | +17.43% | 0.00% | 85.19 | ▲ Strong bull | 1.72% |
| NEM | +174.17% | +17.08% | 0.00% | 66.29 | ▲ | 6.52% |
| Stock | YTD % | 5D % | 1D % | RSI | MACD vs Signal | Div Yield |
|---|---|---|---|---|---|---|
| GREENWETF | -30.06% | -10.00% | -8.90% | 69.73 | High/volatile | 0.00% |
| JOHNHOLT | -22.98% | -7.69% | -7.69% | 32.34 | Bearish | 1.25% |
| UNIONDICON | +11.11% | -9.09% | 0.00% | 41.27 | Bearish | 6.25% |
| OMATEK | +80.00% | -8.86% | -1.37% | 54.72 | Bounce potential | 0.00% |
| REDSTAREX | +127.89% | -8.64% | 0.00% | 32.34 | Bearish | 6.12% |
- ASOSAVINGS and SOVRENINS are both among today's and YTD top gainers, but ASOSAVINGS’ extreme RSI (87.88) suggests a pullback risk. EUNISELL and ARADEL show persistent multi-week strength.
- GREENWETF and JOHNHOLT are persistent YTD/worst performers and also today's top losers — negative momentum compounded by recent accelerated selloffs.
Bullish & Bearish Momentum – Technical Pulse
| Stock | Signal | RSI | 15/50DMA Crossover | Comment |
|---|---|---|---|---|
| AIICO | Bullish | 45.95 | 15DMA (3.93) > 50DMA (3.93) | Crossed above 15DMA; insurer sector-wide rally. |
| AFRIPRUD | Bullish | -- | 15DMA (14.66) > 50DMA | High yield and low beta: defensive play + technical trigger. |
| STANBICETF30 | Bullish | -- | 15DMA (520.33) > 50DMA | ETF flows rising; institutional rotation likely. |
| FCMB | Bullish | -- | 15DMA (10.61) > 50DMA | Recent break-out; bank sector buying. |
| Stock | Signal | RSI | 15/50DMA | Observations |
|---|---|---|---|---|
| GREENWETF | Bearish | 69.73 | Below 15DMA & 50DMA | High volatility, overbought zone, heavy profit-taking. |
| LIVESTOCK | Bearish | 50.75 | Below 15DMA (7.75) | Momentum fading, trend reversal possible. |
| CHAMS | Bearish | --- | Below 15DMA (4.08) | Steep decline; under selling pressure. |
| IKEJAHOTEL | Bearish | --- | Below 15DMA (19.8) | Near-term negatives, risk of overshoot to downside. |
- ASOSAVINGS stands out by not only being in the bullish camp by price but also resting in extreme overbought RSI; aggressive traders may eye short setups soon. GREENWETF and LIVESTOCK demonstrate how quickly a bullish trend can collapse once critical moving averages are lost.
Contrarian Signals: Overlaps & Conflicting Indicators
- ASOSAVINGS: Massive volume + RSI at 87.88 (extreme overbought), still printing daily gains. While short-term momentum is strong, risk of rapid reversal rises; trailing stops advised.
- GREENWETF: Despite a sharp selloff, RSI high at 69.73; possible dead cat bounce or institutional marking.
- JOHNHOLT: Persistent YTD loser and dropped hard again today; RSI skirting oversold. Value investors may stalk for mean-reversion.
Sector Heatmap (Top 5 Sectors by Activity)
| Sector | Total Value (₦B) | Adv/Dec | Key Technicals | Retail%/Inst% | Color Code |
|---|---|---|---|---|---|
| Banking | 7.2 | 4/3 | ZENITHBANK: Bearish cross, ACCESS: Weak | 40/60 | ↑Active |
| Insurance | 3.0 | 3/2 | SOVRENINS, AIICO bullish crosses | 60/40 | ↑ Buoyant |
| Industrials | 6.2 | 2/4 | DANGCEM major flow | 30/70 | ↑ High Inst. |
| Telecoms | 1.8 | 1/0 | MTNN: Neutral, stable price | 5/95 | ↔ Stable |
| Diversified | 1.0 | 1/1 | TRANSCORP steady, Japaul softening | 60/40 | ↔ Sideways |
Dividend Yield vs. Beta Matrix (Defensive Picks)
| Stock | Dividend Yield | Beta | Momentum | Implication |
|---|---|---|---|---|
| AFRIPRUD | 1.27% | 0.64 | Bullish (above 15DMA) | Low risk + yield + bullish crossover = defensive buy candidate |
| NEM | 6.52% | 0.69 | YTD Top 5 | Savvy balance of income/price growth |
| REDSTAREX | 6.12% | 0.21 | Bearish | Monitor for mean reversion post selling |
| JOHNHOLT | 1.25% | -0.19 | Bearish | Dividend plus defensiveness, but in downtrend |
| ZENITHBANK | 2.25% | 1.20 | Bearish | High institutional flows; careful near key support |
- Defensive Play: Stocks like AFRIPRUD and NEM marry high yields with low volatility and positive technical momentum – prudent options for risk-averse investors.
Institutional Clustering Alerts
- ZENITHBANK: Institutional trade value share is 20.17% of top 5, indicating sustained big money interest; however, the stock posted a -3.21% loss today and hovers at a bearish inflection point.
- DANGCEM/STANBIC: Massive institutional block volumes suggest strong hands shaping daily trend; close monitoring warranted for possible upside continuation or exhaustion gap scenarios.
- ARADEL: Both retail and institutional activity strong, but institutional flows dominate (over ₦2.5B).
Traders’ Tactical Guide
- Caution on Overbought Runners: Names like ASOSAVINGS and EUNISELL may see a short squeeze but the reward/risk in chasing is diminishing—tight trailing stops suggested.
- Volume/Price Divergence: Where volume is surging with flattening or dropping prices (e.g., DANGCEM), it may indicate distribution—watch next two sessions closely.
- Bullish Setups: Insurance (AIICO, SOVRENINS) and defensive yielders (NEM, AFRIPRUD) show sustained strength and crossover; dips could find buyers.
- Bull/Bear Overlap: SOVRENINS is both YTD and daily top gainer and also has technical bullishness—momentum investors may look to ride for last legs, but late entries are risky.
- Institutional-Heavy Names: Monitor sector leaders where institutional flows are >70% of volumes: DANGCEM, ZENITHBANK and STANBIC.
- Bullish Dividend Stocks: AFRIPRUD (high yield, low beta, and bullish TA), and NEM (yield & price momentum) are well-positioned as risk-off but constructive bets.
Trade Activity Analysis & Top-Traded Stocks
| Trade Summary by Investor Class | |||||
|---|---|---|---|---|---|
| Investor | Trade Count (%) | Volume (%) | Value (%) | Sentiment | |
| Institutional | 37.39% | 70.14% | 90.39% | Block trades dominate, Institutional flows drive direction | |
| Retail | 62.61% | 29.86% | 9.61% | High participation but lower impact | |
| Top 5 Most Traded Symbols – Institutional Investors | ||||
|---|---|---|---|---|
| Stock | Total Volume | Value (₦) | % Trade Value | Sector |
| ARADEL | 3.23M | 2.55B | 10.06% | Oil & Gas |
| ZENITHBANK | 25.96M | 1.66B | 6.54% | Banking |
| DANGCEM | 7.40M | 4.45B | 17.53% | Industrials |
| FIRSTHOLDCO | 36.42M | 1.15B | 4.52% | Banking |
| MTNN | 2.65M | 1.37B | 5.40% | Telecoms |
| Top 5 Most Traded Symbols – Retail Investors | ||||
|---|---|---|---|---|
| Stock | Total Volume | Value (₦) | % Trade Value | Sector |
| MTNN | 251.33K | 130M | 0.51% | Telecoms |
| ARADEL | 266.18K | 212.8M | 0.84% | Oil & Gas |
| ACCESSCORP | 5.65M | 132.3M | 0.52% | Financials |
| ZENITHBANK | 2.18M | 140M | 0.55% | Banking |
| UBA | 2.85M | 114.3M | 0.45% | Banking |
- Overlap Analysis: ARADEL, ZENITHBANK, and MTNN top-traded by both institutional and retail, but institutional presence is much more value-dominant—signals that retail trades are "following the flow” rather than leading.
- DANGCEM: Institutional focus (nearly all value/volume) — often preceding major market swings.
- First HoldCo (FIRSTHOLDCO): Surged on volume (over 2x 90DAvg) thanks to block institutional deals; could hint at stealth accumulation.
Hidden Insights & Actionable Analysis
- Distribution vs. Accumulation: While more stocks declined than advanced, bullish volume in a few large names lifted turnover significantly. Such a setup often presages a short-term rotational correction, especially after extreme bull runs.
- RSI Traps: Monitor overbought names (ASOSAVINGS, ARADEL, EUNISELL) for exhaustion signals; experienced traders may look to fade near-term rallies unless fresh catalysts emerge.
- Defensive Switch? Increased appeal in defensive, high-dividend low-beta plays (AFRIPRUD, NEM) as volatility rises—risk-off posturing amid profit-taking.
- Bullish/High Dividend Cross: AFRIPRUD (bullish momentum, above 15DMA, yield 1.27%, low beta 0.64) offers value both for TA and yield/income seekers.
- Contrarian Opportunity: Bottom-fishing in persistent laggards (JOHNHOLT) may be rewarding if signs of stabilization appear; traders should await reversal candles or MACD confirmation.
Summary for Traders & Investors
- Momentum Play: Names like SOVRENINS, BERGER, and AIICO are outperforming—momentum traders may capitalize, but beware entering late in cycle (RSI, volume, and turnover spikes warrant tightening stops).
- Reversal Watch: ASOSAVINGS, GREENWETF, and MCNICHOLS carry reversal risk after rapid runs and/or extreme RSI readings—ideal for mean-reversion setups.
- Defensive Rotations: High-yield, low-beta stocks with positive technicals (AFRIPRUD, NEM) are in focus for portfolio defense during choppy trade.
- Volume Surprises: Unusual block trades (DANGCEM, STANBIC) could steer short-term sentiment in their respective sectors.
- Monitor Breadth & Flows: Breadth under 1x and increased turnover often foreshadow sector rotation or tactical pullbacks. Stay disciplined in sizing and use technical alerts for entry/exit refinement.
|
Top ASI Gainers Over Last 5 Trading Days
|
Top ASI Losers Over Last 5 Trading Days
|
For more detailed analysis, on InfoWARE Market Data Terminal <NSEPERF> <GO>
On InfoWARE Finance Mobile App (Android, iPhone & iPad, Windows Phone and Windows 8/10), "Top Gainers & Losers"
SOVEREIGN TRUST INSURANCE PLC (SOVRENINS) topped the advancers list closing at N4.45 with a gain of 9.88% followed by ASO SAVINGS AND LOANS PLC (ASOSAVINGS) which closed at N0.79 with a gain of 9.72%.
On the flip side GREENWICH ASSET ETF (GREENWETF) and MCNICHOLS PLC (MCNICHOLS) topped the decliners log with a loss of -8.90% at a close of N373.50, and -8.81% to close the day at N3.00 respectively.
| Symbol | LClose | %Chg |
|---|---|---|
| SOVRENINS | 4.45 | 9.88 |
| ASOSAVINGS | 0.79 | 9.72 |
| BERGER | 42.50 | 9.25 |
| WAPIC | 3.10 | 6.90 |
| AIICO | 3.98 | 6.13 |
For more detailed analysis,
- On InfoWARE Market Data Terminal <TOPG> <GO>
- On InfoWARE Finance Mobile App ( Android, iPhone & iPad and Windows 10) , "Top Gainers & Losers"
Currency Market
In the currency market, the Naira was unchanged against the dollar at 1 to 1NSE: Bull Signal - Price crossed above 15 Day MA
This signal implies these stocks are under buying pressure and the price might continue to rise and therefore positions should be monitored closely. Further suggested analysis include looking at the overall market (ASI) to see if the uptrend is market wide, sector wide or specific to the stock. Portfolio managers tend to use this as a signal to do more research to add to their positions or lock in some profits. Typically further analysis should be done using commands like PC and RV on the InfoWARE Market Data Terminal. Another command is ALERTS to set price triggers for possible exit or entry as necessary
For more detailed analysis,
- On InfoWARE Market Data Terminal <NSEPERF> <GO>
- On InfoWARE Finance Mobile App ( Android , iPhone & iPad and Windows 10) , "Top Gainers & Losers"
| Symbol | Price | %Chg | 15DMA | PE | EPS | DivY | MktCap | Vol | Trades | Value | LstTradeTime |
|---|---|---|---|---|---|---|---|---|---|---|---|
| FGSUK2033S6 | 106.96 | 7.44 | 101.13 | 0.00 | 0.00 | 1.80K | 1.00 | 1.93M | 28-Oct-2025 14:31:33.970 | ||
| AIICO | 3.98 | 5.78 | 3.93 | 2.01 | 0.60 | 4.13 | 145.69B | 15.32M | 441.00 | 58.82M | 28-Oct-2025 14:30:08.527 |
| LINKASSURE | 2.03 | 2.96 | 2.02 | 59.89 | 0.02 | 5.56 | 28.42B | 1.94M | 49.00 | 3.86M | 28-Oct-2025 14:30:22.867 |
| STANBICETF30 | 525.00 | 2.86 | 520.33 | 0.00 | 0.00 | 1.66K | 54.00 | 861.95K | 28-Oct-2025 14:31:30.830 | ||
| AFRIPRUD | 14.80 | 2.03 | 14.66 | 19.57 | 0.61 | 1.27 | 29.60B | 1.80M | 135.00 | 26.33M | 28-Oct-2025 14:30:08.487 |
| FCMB | 10.75 | 1.40 | 10.61 | 104.31 | 0.09 | 5.62 | 212.88B | 11.51M | 1,255.00 | 122.30M | 28-Oct-2025 14:30:12.817 |
| JAIZBANK | 4.40 | 1.14 | 4.36 | 83.05 | 0.03 | 1.67 | 151.98B | 4.63M | 313.00 | 20.25M | 28-Oct-2025 14:31:33.730 |
| TRANSCORP | 48.05 | 0.31 | 47.94 | 0.00 | 0.00 | 0.23 | 1,953.14B | 3.50M | 264.00 | 168.39M | 28-Oct-2025 14:30:39.733 |
| CADBURY | 69.50 | 0.00 | 69.49 | 33.25 | 0.64 | 1.88 | 130.54B | 1.20M | 255.00 | 83.01M | 28-Oct-2025 14:30:08.833 |
NSE: BEAR Signal - Price crossed below 15 Day MA
This signal implies these stocks are under selling pressure and the price might continue to slide and therefore positions should be monitored closely. Further suggested analysis include looking at the overall market (ASI) to see if the downtrend is market wide, sector wide or specific to the stock. If the overal market trend is upwards, then since these stocks are heading in the opposite direction, then further analysis should be done using commands like PC and RV on the InfoWARE Market Data Terminal. Another command is ALERTS to set price triggers for possible exit is necessar
For more detailed analysis,
- On InfoWARE Market Data Terminal <BEARM> <GO>
- On InfoWARE Finance Mobile App ( Android , iPhone & iPad and Windows 10)
| Symbol | Price | %Chg | 15DMA | PE | EPS | DivY | MktCap | Vol | Trades | Value | LstTradeTime |
|---|---|---|---|---|---|---|---|---|---|---|---|
| VFDGROUP | 11.00 | -0.91 | 11.01 | 0.00 | 0.00 | 0.00 | 0.00 | 1.80M | 151.00 | 19.86M | 28-Oct-2025 14:30:42.287 |
| CILEASING | 6.00 | -3.33 | 6.11 | 6.50 | 0.64 | 1.20 | 4.69B | 3.58M | 101.00 | 20.71M | 28-Oct-2025 14:30:09.063 |
| INTBREW | 14.00 | -3.57 | 14.36 | 0.00 | 0.00 | 6.23 | 376.07B | 5.18M | 153.00 | 73.04M | 28-Oct-2025 14:30:14.897 |
| SUNUASSUR | 5.15 | -6.80 | 5.44 | 0.00 | 0.00 | 0.99 | 29.93B | 585.67K | 47.00 | 3.04M | 28-Oct-2025 14:30:37.877 |
| CHAMS | 3.95 | -7.59 | 4.08 | 27.02 | 0.07 | 1.56 | 18.55B | 20.63M | 541.00 | 83.06M | 28-Oct-2025 14:30:09.040 |
| IKEJAHOTEL | 19.00 | -7.89 | 19.80 | 51.55 | 0.16 | 0.94 | 39.50B | 447.15K | 82.00 | 8.72M | 28-Oct-2025 14:30:14.330 |
| LIVESTOCK | 7.20 | -8.33 | 7.75 | 0.00 | 0.00 | 2.94 | 21.60B | 2.96M | 203.00 | 21.56M | 28-Oct-2025 14:30:23.190 |
| GREENWETF | 373.50 | -9.77 | 381.44 | 0.00 | 0.00 | 30.00 | 1.00 | 11.21K | 28-Oct-2025 14:31:30.753 |
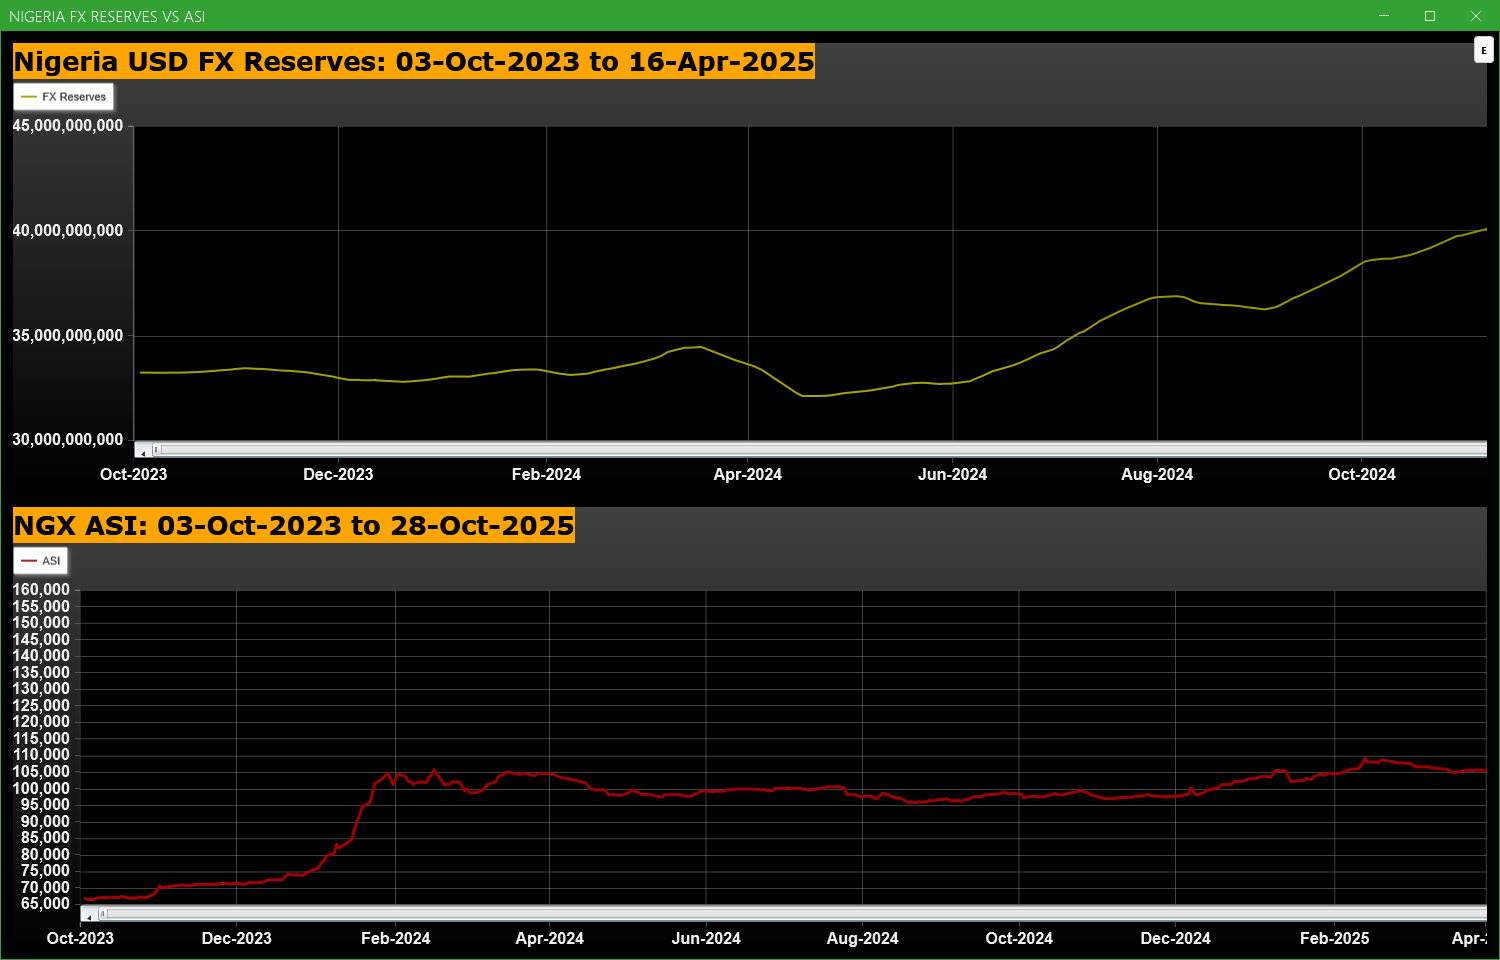
Economic Indicators - Nigeria FX Reserves Vs ASI Chart
Nigeria FX Reserves are assets held on reserve by CBN in foreign currencies. These reserves are used to back liabilities and influence monetary policy. Given the nature of the Nigeria economy, FX Reserves can appear to have an outsize influence on the economy and hence on the capital market. The chart below allows comparison of FX Reserves against the ASI to make investment decisions
For more detailed analysis,
- On InfoWARE Market Data Terminal <CI> <GO>
- On InfoWARE Finance Mobile App ( Android , iPhone & iPad and Windows 10) , "Research"
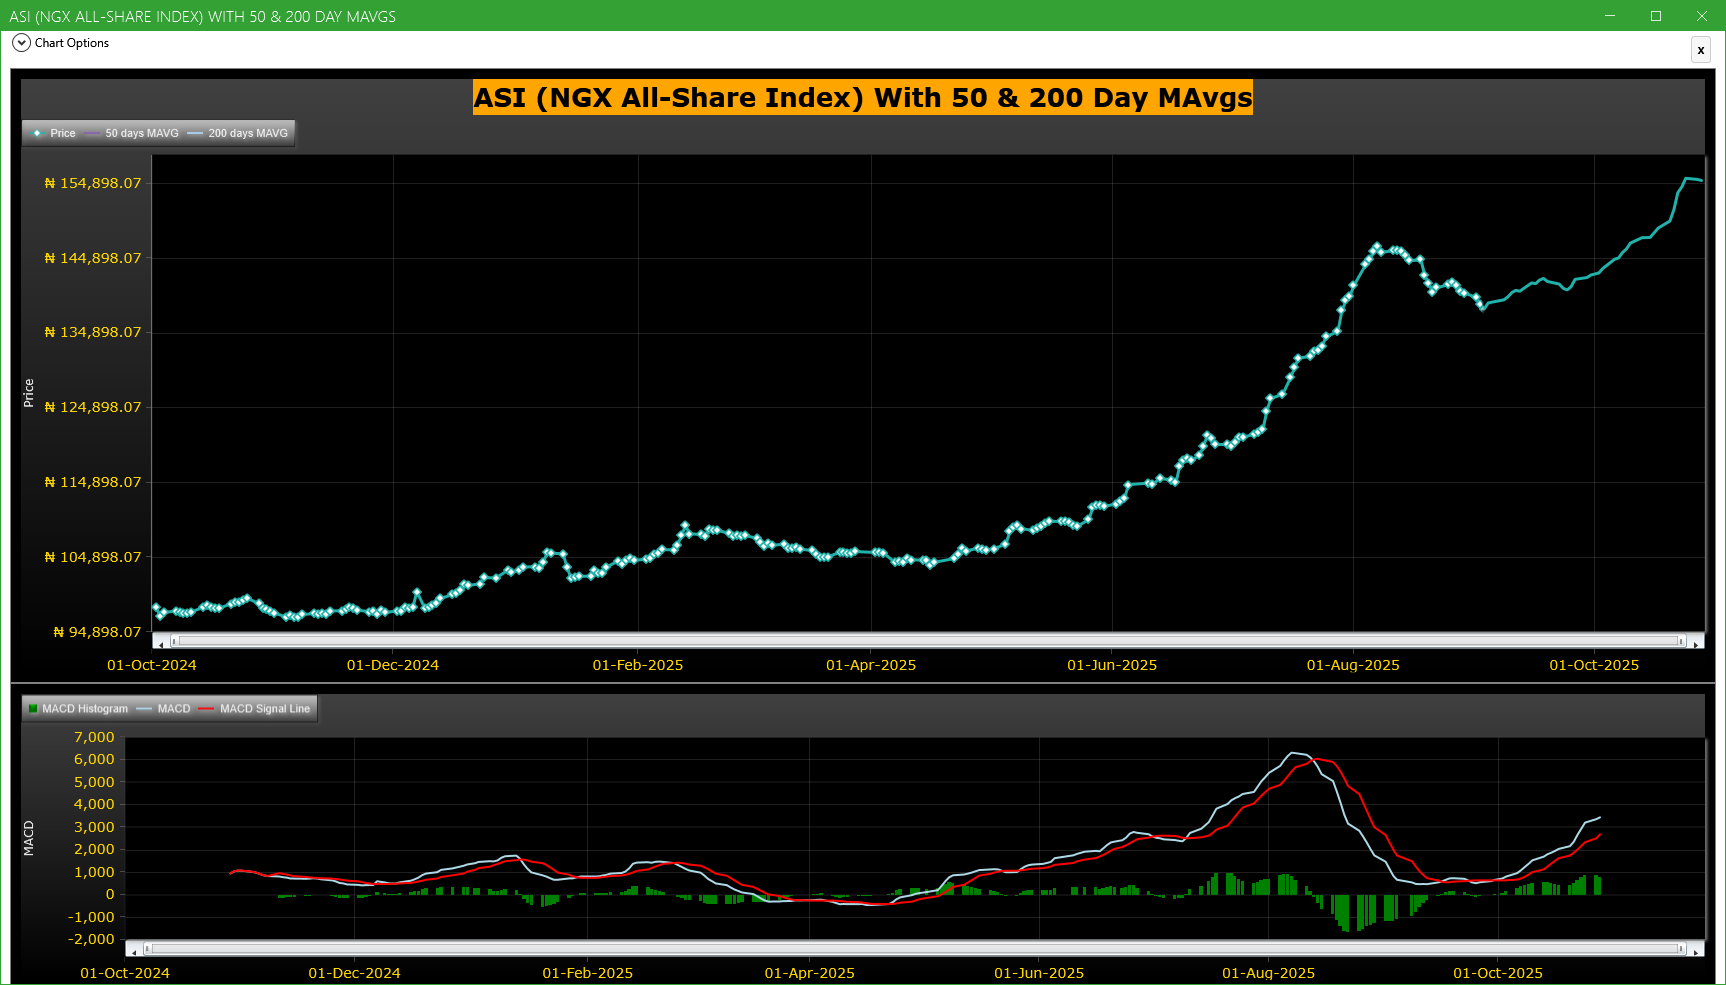
Market Trend - ASI (NGX All-Share-Index) With 50 & 200 Day MAvgs Chart
Technical traders typically use the 50 & 200 day moving averages to aid in choosing
where to enter or exit a position, which then causes these levels to act as strong
support or resistance. As a general guideline, if the price is above a moving average,
the trend is up. If the price is below a moving average, the trend is down.
It is important to note that critics of technical analysis say that moving averages act
as support and resistance because so many traders use these indicators to inform their
trading decisions. Also moving averages tend to work quite well in strong trending conditions
but poorly in choppy or ranging conditions.
Trading Strategies: Crossovers
Crossovers are one of the main moving average strategies. The first type is a price crossover,
which is when the price crosses above or below a moving average to signal a potential change
in trend. Another strategy is to apply two moving averages to a chart: one longer and one
shorter. When the shorter-term MA crosses above the longer-term MA, it is a buy signal, as
it indicates that the trend is shifting up. This is known as a golden cross. Meanwhile, when
the shorter-term MA crosses below the longer-term MA, it is a sell signal, as it indicates that
the trend is shifting down. This is known as a dead/death cross
For more detailed analysis,
- On InfoWARE Market Data Terminal <CI> <GO>
- On InfoWARE Finance Mobile App ( Android , iPhone & iPad and Windows 10) , "Research"
Unusual Volume: Volume traded is more than double the 90 day moving average (All exchanges; ASI & ASem). For more detailed analysis,
- On InfoWARE Market Data Terminal <UV> <GO>
- On InfoWARE Finance Mobile App ( Android , iPhone & iPad and Windows 10)
| Symbol | Name | Volume | 90DAvgVol | %VolChg | Price | LClose | %Chg | Trades | Value |
|---|---|---|---|---|---|---|---|---|---|
| FIRSTHOLDCO | FIRST HOLDCO PLC | 37.73M | 18.43M | 104.75 | 31.50 | 31.50 | 0.00 | 520 | 1.19B |
| STANBIC | STANBIC IBTC HOLDINGS PLC | 27.51M | 2.92M | 841.52 | 110.00 | 107.20 | 2.61 | 257 | 3.03B |
| DANGCEM | DANGOTE CEMENT PLC | 7.54M | 1.83M | 312.06 | 665.00 | 665.00 | 0.00 | 1,426 | 4.54B |
| ASOSAVINGS | ASO SAVINGS AND LOANS PLC | 5.29M | 491.10K | 977.96 | 0.79 | 0.72 | 9.72 | 8 | 4.18M |
| BUACEMENT | BUA CEMENT PLC | 3.88M | 975.79K | 297.60 | 180.00 | 180.00 | 0.00 | 942 | 689.37M |
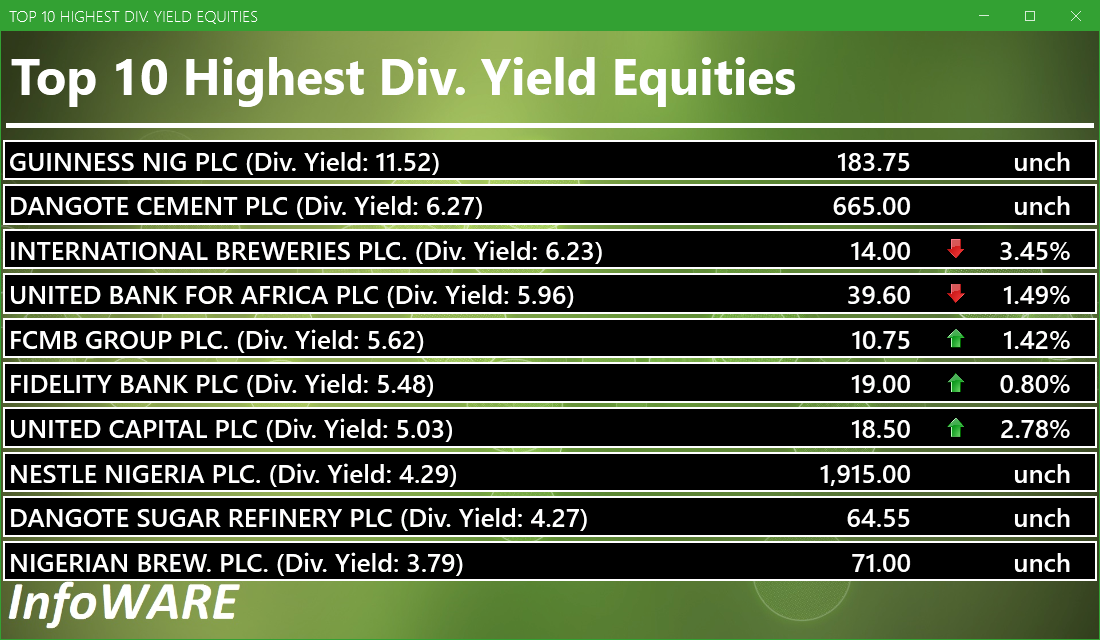
Investment Insights - High Div. Stocks
Dividend stocks distribute a portion of the company earnings to investors on a regular basis and they can a great choice for investors looking for regular income. As an investment or trading strategy, high dividend yield equities provide annual cash payments as against mostly capital gains in the price of a stock. The list in the table below represent the highest dividend paying stocks from the list of the most liquid stocks in the NSE top 30.
For more detailed analysis,
- On InfoWARE Market Data Terminal <HYIELD> <GO>
- On InfoWARE Finance Mobile App ( Android , iPhone & iPad and Windows 10) , "Research"
African Markets
| Name | LClose | Change | %Chg |
|---|---|---|---|
| BRVM Stock Exchange | 341.58 | 2.21 | 0.65 |
| Botswana Stock Exchange | 10,617.99 | 0.00 | 0.00 |
| Egyptian Exchange | 38,162.01 | 60.96 | 0.16 |
| Ghana Stock Exchange | 8,379.00 | 11.71 | 0.14 |
| Johannesburg Stock Exchange | 108,707.30 | -1,733.93 | -1.57 |
| Lusaka Stock Exchange | 25,424.40 | -12.72 | -0.05 |
| Casablanca Stock Exchange | 19,374.33 | -68.05 | -0.35 |
| Malawi Stock Exchange | 593,318.72 | 0.00 | 0.00 |
| Nigeria Stock Exchange | 155,496.15 | -155.65 | -0.10 |
| Nairobi Securities Exchange | 181.06 | 1.26 | 0.70 |
| Namibian Stock Exchange | 2,007.82 | -14.36 | -0.71 |
| Rwanda Stock Exchange | 179.27 | 0.11 | 0.06 |
| Tunis Stock Exchange | 12,504.10 | 21.22 | 0.17 |
| Uganda Securities Exchange | 1,481.53 | 1.33 | 0.09 |
Nigeria Market Indexes
| Symbol | LClose | %Chg | WTD% | MTD% | QTD% | YTD% | MktCap | Trades |
|---|---|---|---|---|---|---|---|---|
| ASI | 155,353.20 | -0.09 | -0.09 | 8.65 | 8.65 | 50.57 | 29,472 | |
| NGX30 | 5,682.20 | -0.10 | -0.10 | 8.90 | 8.90 | 48.95 | 17,670 | |
| NGXAFRBVI | 3,303.95 | -1.34 | -1.34 | -6.92 | -6.92 | 33.18 | 6,035 | |
| NGXAFRHDYI | 21,398.18 | -0.25 | -0.25 | -3.87 | -3.87 | 25.67 | 8,060 | |
| NGXASEM | 1,392.88 | 0.00 | 0.00 | -9.44 | -9.44 | -12.05 | 9 | |
| NGXBNK | 1,458.51 | -0.66 | -0.66 | -3.84 | -3.84 | 34.13 | 6,776 | |
| NGXCG | 4,095.77 | -0.47 | -0.47 | 1.11 | 1.11 | 44.77 | 15,505 | |
| NGXCNSMRGDS | 3,594.56 | -0.42 | -0.42 | 6.26 | 6.26 | 107.26 | 3,631 | |
| NGXCOMMDTY | 1,256.97 | 0.00 | 0.00 | 12.04 | 12.04 | 25.69 | ||
| NGXGROWTH | 15,654.95 | -0.48 | -0.48 | 3.87 | 3.87 | 101.66 | 339 | |
| NGXINDUSTR | 6,002.55 | -0.25 | -0.25 | 18.44 | 18.44 | 68.06 | 3,562 | |
| NGXINS | 1,304.13 | 1.15 | 1.15 | 9.03 | 9.03 | 65.88 | 1,928 | |
| NGXLOTUSISLM | 14,024.04 | -0.05 | -0.05 | 18.14 | 18.14 | 101.27 | 6,830 | |
| NGXMAINBOARD | 7,440.21 | -0.03 | -0.03 | 5.61 | 5.61 | 48.69 | 20,208 | |
| NGXMERIGRW | 10,280.87 | -0.25 | -0.25 | 3.81 | 3.81 | 57.60 | 3,869 | |
| NGXMERIVAL | 13,029.40 | -1.54 | -1.54 | -2.53 | -2.53 | 24.92 | 8,739 | |
| NGXOILGAS | 3,029.96 | 0.08 | 0.08 | 19.95 | 19.95 | 11.76 | 548 | |
| NGXPENBRD | 2,901.22 | -0.03 | -0.03 | 9.43 | 9.43 | 58.40 | 24,592 | |
| NGXPENSION | 7,047.61 | -0.20 | -0.20 | 4.60 | 4.60 | 55.44 | 19,251 | |
| NGXPREMIUM | 15,743.38 | -0.21 | -0.21 | 14.99 | 14.99 | 61.75 | 8,925 | |
| NGXSOVBND | 668.40 | 0.50 | 0.50 | 1.69 | 1.69 | 11.11 | 0 |
For more detailed analysis,
- On InfoWARE Market Data Terminal <MKTINS> <GO>
- On InfoWARE Finance Mobile App ( Android, iPhone & iPad and Windows 10) , "Market Indexes"
Find the topic interesting? Will like to comment? Contact Us at solutions@infowarelimited.com
Top News

Chart Of The Day - ASI Chart Vs ASI Advance Decline Line (YTD) (28-Oct-2025 15:07:19.179)
InfoWARE AI Analyst Daily Market Report: 28-Oct-2025

[XNSA]>> CORDROS MILESTONE FUNDS' BID & OFFER PRICES
[MERVALUE]>> DAILY INDICATIVE PRICES
[VETGOOD]>> DAILY INDICATIVE PRICES
[LOTUSHAL15]>> DAILY INDICATIVE PRICES
[XNSA]>> NGX FIXED INCOME INDICATIVE PRICE LIST FOR OCT 28, 2025
[XNSA]>> H2 2025 BC/DR TEST
[XNSA]>> CLOSING GONG CEREMONY
[XNSA]>> FBF PRESENTATION BY THE INITIATES PLC
[XNSA]>> AELP CAPACITY BUILDING & ASSDA FORUM
[XNSA]>> POSTPONED - FBF PRESENTATION BY ELLAH LAKES PLC
[XNSA]>> APPOINTMENT OF DIRECTORS (NORRENBERGER SECURITIES LIMITED)
[XNSA]>> APPOINTMENT OF A DIRECTOR
[SIAMLETF40]>> DAILY INDICATIVE PRICES
Chart Of The Day - ASI Chart Vs ASI Advance Decline Line (YTD) (27-Oct-2025 15:10:38.192)
InfoWARE AI Analyst Daily Market Report: 27-Oct-2025
[XNSA]>> APPOINTMENT OF A DIRECTOR
[XNSA]>> FBF PRESENTATION BY THE INITIATES PLC
[XNSA]>> FBF PRESENTATION BY THE INITIATES PLC
[XNSA]>> POSTPONED - FBF PRESENTATION BY ELLAH LAKES PLC
Breaking News! Unusual Volume Alert (27-Oct-2025 12:03:54.946)
Breaking News! Bulls Momentum Alert (27-Oct-2025 12:03:54.262)
Breaking News! Bears Momentum Alert (27-Oct-2025 12:03:54.124)
InfoWARE Analyst Daily Market Report (27-Oct-2025 12:03:53.536)
[XNSA]>> EMERGING AFRICA DAILY MUTUAL FUND PRICES
[VSPBONDETF]>> DAILY INDICATIVE PRICES
[LOTUSHAL15]>> DAILY INDICATIVE PRICES
[XNSA]>> NGX FIXED INCOME INDICATIVE PRICE LIST FOR OCT 27, 2025
[XNSA]>> CORDROS MILESTONE FUNDS' BID & OFFER PRICES
Get IDIA - the stock trading app for the modern investor
Solutions by Business
Product Suites
Company
Contacts
- 8th Floor,
- South Atlantic Petroleum Towers,
- 1 Adeola Odeku Street,
- Victoria Island,
- Lagos, Nigeria.
- Email: solutions@infowarelimited.com
Follow Us
 |
 |
 |
 |