


InfoWARE AI Analyst Daily Market Report: 21-Oct-2025 | InfoWARE Finance
Get IDIA - the stock trading app for the modern investor


InfoWARE AI Analyst Daily Market Report: 21-Oct-2025
(Source: InfoWARE Terminal, Date: 21-Oct-2025)
Dear Investor,
NGX Market Summary – Tuesday, October 21, 2025
The NGX All Share Index (ASI) advanced by +1.01% to close at 149,940.81, continuing its bullish run with a stellar YTD return of +46.79%. Despite higher overall trading volumes (486.24M vs. 415.04M in the previous session), market turnover dropped notably by -33.52% to ₦17.92B, reflecting broad but lighter weighted participation across the market. Market breadth was slightly negative at 0.91x, as decliners (33) marginally outpaced advancers (30), underscoring some underlying caution amid the index’s climb. The day’s top gainer was S C O A NIG. PLC. (SCOA), surging +7.74%, while OMATEK VENTURES PLC (OMATEK) led the losers, falling -7.48%. Trading desk activity pointed to institutional dominance by value, but retail traders led by trade count, echoing a diverse underlying sentiment. Today's market produced several nuanced signals for short-term tacticians and long-term investors alike.
Key Market Trends
- Market Breadth: Advancers (30), Decliners (33) - breadth at 0.91x, indicating a slightly cautious undertone despite the ASI's gain.
-
Top Gainers:
- SCOA: +7.74% (RSI 55.3) – Short-term momentum up, but not overbought; price is above the 15D and 50D MAs.
- OMATEK: +7.48% (RSI 60.2) – Despite being a gainer, OMATEK’s RSI is approaching the high 60s, so monitor for potential near-term exhaustion.
- BUAFOODS: +6.54% – Steady uptrend, strong YTD and RSI above 60.
- VITAFOAM: +5.92% (RSI 66.1) – Near overbought territory, but price action/volume remain robust.
-
Top Losers:
- LIVINGTRUST: -9.91% (RSI 39.6) – Strong volume spike (+222.6% vs 90D avg), YTD -8.68%, trending into oversold territory, momentum breakdown confirmed by negative MACD and a price drop below both MAs.
- NEWGOLD ETF: -7.89% (RSI 54.1) – Heavy institutional instruments driving risk-off sentiment, with negative momentum (below 15DMA).
- CONOIL: -5.83% (RSI 41.8) – Top 5 YTD loser, pressure continues as breakdown below both 15DMA/50DMA is confirmed.
- AFRIPRUD: -5.69% (RSI 49.6, YTD -37.61%) – Dividend play under heavy sell pressure, with breakdown below 15DMA and muted MACD signal.
- SOVRENINS: -3.95%, (YTD still green), but volume up, and technicals mixed.
-
Unusual Volume:
- PZ Cussons: Traded volume +784% above its 90-day average, despite a -1.53% drop. Spike aligns with a bearish MA crossover.
- VFDGROUP: +396% surge, though down -1.82% today – short-term support is suspect.
- LIVINGTRUST: Volume up +223% (also today's top loser) – possible panic selling or institutional exit.
- WEMABANK: +189% volume and price up +1.88%, suggesting a bullish push supported by both retail and institutional flows.
Year-to-Date Top 5 Gainers & Losers (as of October 21, 2025)
| Symbol | Name | Price | YTD %Chg | Div Yield | RSI |
|---|---|---|---|---|---|
| EUNISELL | EUNISELL INTERLINKED PLC | 53.20 | +183.34% | 0.31 | 88.6 |
| SOVRENINS | SOVEREIGN TRUST INSURANCE PLC | 3.80 | +196.75% | 3.75 | 63.9 |
| VITAFOAM | VITAFOAM NIG PLC. | 88.75 | +292.48% | 7.03 | 66.1 |
| UNIONDICON | UNION DICON SALT PLC. | 8.80 | +22.22% | 6.25 | 51.0 |
| BUAFOODS | BUA FOODS PLC | 650.00 | +66.87% | 1.39 | 61.4 |
| Symbol | Name | Price | YTD %Chg | Div Yield | RSI |
|---|---|---|---|---|---|
| LIVINGTRUST | LIVINGTRUST MORTGAGE BANK PLC | 4.44 | -8.68% | 1.67 | 39.6 |
| ACADEMY | ACADEMY PRESS PLC. | 7.88 | -16.97% | 3.51 | 35.6 |
| VSPBONDETF | VETIVA S&P NIGERIA SOV BOND ETF | 206.07 | -41.12% | 0.00 | 46.3 |
| JULI | JULI PLC. | 8.06 | -21.75% | 0.68 | 30.8 |
| CONOIL | CONOIL PLC | 202.5 | -50.75% | 1.17 | 41.8 |
| AFRIPRUD | AFRICA PRUDENTIAL REGISTRARS PLC | 14.95 | -37.61% | 1.27 | 49.6 |
Momentum Trend Insights
-
Bullish Crossovers (Above 15DMA):
OANDO (+3.22%), CADBURY (+2.90%), WEMABANK (+1.84%), TRANSCORP (+1.44%)
- Momentum signals are broadening in banking and consumer sectors. WEMABANK, with both high volume and price up, suggests conviction behind the move.
-
Bearish Crossovers (Below 15DMA):
CUTIX, PZ, HONYFLOUR, AIICO, NEM, STERLINGNG, AFRIPRUD, NEWGOLD, FGS202890.
- Notably, AFRIPRUD and NEWGOLD are both in high-dividend or defensive plays, experiencing technical breakdowns, which may be profit taking or a rotation out of defensive stocks.
- PZ and NEM also on high volume, strengthening the bearish signal.
- RSI Extremes: EUNISELL (88.6), SOVRENINS (63.9), VITAFOAM (66.1) are elevated – watch for reversals. No mainstream large-cap with RSI below 30 (deep oversold).
- Overlap Watch: VITAFOAM, BUAFOODS, SCOA – all appear in Top Daily/5 Day Gainers and have bullish technicals (MACD/MA Crosses), reinforcing momentum. LIVINGTRUST and AFRIPRUD are notable as Top Losers YTD and today, combining weak price, negative breadth, and technical breakdowns, suggesting ongoing distribution.
Contrarian Signals
- SOVRENINS: Despite being a top YTD gainer (+196.75%), it was down today (-3.95%) with a rising RSI (63.9) and bullish MACD, signaling possible divergence – a probable profit-taking phase, not a structural reversal yet.
- AFRIPRUD: High dividend yield (1.27%), but in a clear technical breakdown on high volume—yield trap alert for unsuspecting defensive investors.
- LIVINGTRUST: Huge volume, deep daily/YTD loss, yet its RSI is not yet in oversold (<30), warning quick bounces might be only dead cat rallies without real support.
- VFDGROUP: Unusual volume (+396%), down on price. Heavy churn may indicate accumulation under the surface, or a distribution top ahead.
Sector Heatmap & Institutional Cluster Highlights
| Sector | Best Performing | Worst Performing | Institutional Trade Share | Technical Trend |
|---|---|---|---|---|
| Banking | WEMABANK (+1.84%, vol spike), GTCO | STERLINGNG (-3.85%) | ZENITHBANK: 20.17% of total institutional trade value (alert: institutional cluster) | Broadly mixed; WEMABANK bullish crossover, STERLINGNG bearish. Institutional rotation ongoing. |
| Consumer Goods | BUAFOODS (+6.54%) | PZ (-1.53%, vol spike), CADBURY (+2.90%) | Not clustered | BUAFOODS, CADBURY bullish; PZ bearish with huge volume |
| Insurance | MUTUAL BENEFIT (+1.2%), SOVRENINS (mixed) | AFRIPRUD (-5.69%) | None direct | SOVRENINS RSI at 63.9, MACD bullish but a daily drop—profit taking alert |
| Diversified/Industrial | TRANSCORP (+1.44%), OANDO (+3.22%) | VFDGROUP (down, but vol spike) | None direct | Momentum shifting positive, but watch for false breakouts |
Dividend–Beta Matrix: Defensive Opportunity Scan
| Symbol | Dividend Yield (%) | Beta | Momentum Signal |
|---|---|---|---|
| AFRIPRUD | 1.27 | 0.64 | Bearish (below 15DMA, MACD negative) |
| WEMABANK | 5.81 | 1.25 | Bullish (above 15DMA, vol surge) |
| SOVRENINS | 3.75 | 1.12 | Mixed (MACD up, price down today) |
| VITAFOAM | 7.03 | 0.47 | Bullish but near overbought |
- Note: High dividend stocks (AFRIPRUD, SOVRENINS, VITAFOAM) are showing split momentum – essential to watch for confirmation before buying for yield.
Market Activity Analysis & Trading Desk Insights
- Turnover Watch: Today’s -33.5% drop in turnover with increased volumes suggests a shift to lower-priced, high-turnover names and/or a reduction in large block institutional trades—risk appetite tilting toward retail- or mid-cap driven action, not heavy institutional repositioning.
-
Retail vs Institutional:
Investor Type Trade Count Total Volume Trade Value % by Trade Count % by Value Institutional 2,350 379.71M ₦18.55B 37.44% 90.27% Retail 25,315 172.27M ₦1.99B 62.56% 9.73% - Insight: Institutions dominated value (90%+), but trade count remains retail-driven. This usually signals a mix of "smart money” risk-on/off positioning (institutional) alongside speculative and tactical retail flows.
-
Top Institutional Trades:
ZENITHBANK, DANGCEM, ACCESSCORP, GTCO, MTNN
- ZENITHBANK: 20.17% institutional value dominance – possible accumulation by funds.
- ACCESSCORP, GTCO: Large blocks, but both flat/day or slightly negative, hinting at rotation or defensive position-building (not runaway momentum).
-
Top Retail Traded Stocks:
UBA, MTNN, ACCESSCORP, DANGCEM, FCMB
- Heavy overlap with institutional focus except UBA and FCMB, which skew more retail-driven today. Retail is chasing legacy banking and telecom names, tracking institutional volume for cues.
Opportunities & Trader Suggestions
-
Momentum Buys:
- WEMABANK, OANDO, CADBURY (all crossed above 15DMA, strong volume, bullish tape) – actionable for short-term spikes or swing trading.
- Monitor VITAFOAM and BUAFOODS as continuation plays, but beware near-term reversals as RSI nears overbought.
-
Contrarian Sells or Protect Profits:
- AFRIPRUD: High dividend, but technical breakdown plus lingering sell-side pressure.
- LIVINGTRUST: Heavy volume, steep drop, but no panic RSI yet – avoid, unless looking for speculative bounce plays (high risk).
- Yield + Momentum Alert: VITAFOAM mixes high dividend, positive momentum, and moderate risk (beta < 1) – could be a sweet spot for defensive traders, but don’t overstay as RSI nears 70.
- Institutional Cluster Alert: Monitor ZENITHBANK for follow-through – if institutional buying persists, could kickstart sector moves.
- High Volume Anomalies to Watch: PZ, VFDGROUP – look for confirmation of direction after heavy churn.
- For swing or mean-reversion traders: LIVINGTRUST potential bounce, but confirmation (RSI < 30) is not there yet.
Hidden and Emerging Patterns
- Volume-Inertia Gaps: Market volume rose while turnover fell, signaling smaller ticket sizes and a rise in speculative/retail-led trades.
- Momentum & Defensive Overlap: Some high dividend, low beta names (VITAFOAM) are still in uptrends, but others (AFRIPRUD) have faltered – screening for fresh momentum within the dividend/beta cohort is critical.
- Institutional Flows: Focused clusters (ZENITHBANK, DANGCEM) could foreshadow sector rotations or portfolio rebalancing. Persistent clustering often leads to breakout/trending moves if confirmed by price.
- Watchlist Additions for Next Move: WEMABANK (bullish), PZ (high churn bearish), LIVINGTRUST (possible bounce, speculative), ZENITHBANK (institutional signal), VITAFOAM (for profit-taking signs).
|
Top ASI Gainers Over Last 5 Trading Days
|
Top ASI Losers Over Last 5 Trading Days
|
For more detailed analysis, on InfoWARE Market Data Terminal <NSEPERF> <GO>
On InfoWARE Finance Mobile App (Android, iPhone & iPad, Windows Phone and Windows 8/10), "Top Gainers & Losers"
S C O A NIG. PLC. (SCOA) topped the advancers list closing at N7.10 with a gain of 7.74% followed by OMATEK VENTURES PLC (OMATEK) which closed at N1.58 with a gain of 7.48%.
On the flip side LIVINGTRUST MORTGAGE BANK PLC (LIVINGTRUST) and NEWGOLD EXCHANGE TRADED FUND (ETF) (NEWGOLD) topped the decliners log with a loss of -9.91% at a close of N4.00, and -7.89% to close the day at N52,500.00 respectively.
| Symbol | LClose | %Chg |
|---|---|---|
| SCOA | 7.10 | 7.74 |
| OMATEK | 1.58 | 7.48 |
| CONHALLPLC | 4.78 | 6.70 |
| BUAFOODS | 692.50 | 6.54 |
| LOTUSHAL15 | 82.00 | 6.49 |
| Symbol | LClose | %Chg |
|---|---|---|
| LIVINGTRUST | 4.00 | -9.91 |
| NEWGOLD | 52,500.00 | -7.89 |
| CONOIL | 190.70 | -5.83 |
| AFRIPRUD | 14.10 | -5.69 |
| SOVRENINS | 3.65 | -3.95 |
For more detailed analysis,
- On InfoWARE Market Data Terminal <TOPG> <GO>
- On InfoWARE Finance Mobile App ( Android, iPhone & iPad and Windows 10) , "Top Gainers & Losers"
Currency Market
In the currency market, the Naira was unchanged against the dollar at 1 to 1NSE: Bull Signal - Price crossed above 15 Day MA
This signal implies these stocks are under buying pressure and the price might continue to rise and therefore positions should be monitored closely. Further suggested analysis include looking at the overall market (ASI) to see if the uptrend is market wide, sector wide or specific to the stock. Portfolio managers tend to use this as a signal to do more research to add to their positions or lock in some profits. Typically further analysis should be done using commands like PC and RV on the InfoWARE Market Data Terminal. Another command is ALERTS to set price triggers for possible exit or entry as necessary
For more detailed analysis,
- On InfoWARE Market Data Terminal <NSEPERF> <GO>
- On InfoWARE Finance Mobile App ( Android , iPhone & iPad and Windows 10) , "Top Gainers & Losers"
| Symbol | Price | %Chg | 15DMA | PE | EPS | DivY | MktCap | Vol | Trades | Value | LstTradeTime |
|---|---|---|---|---|---|---|---|---|---|---|---|
| OANDO | 46.55 | 3.22 | 45.33 | 24.10 | 2.53 | 1.15 | 578.68B | 3.24M | 485.00 | 149.47M | 21-Oct-2025 14:30:13.103 |
| CADBURY | 69.00 | 2.90 | 68.03 | 33.25 | 0.64 | 1.88 | 129.60B | 1.17M | 178.00 | 79.83M | 21-Oct-2025 14:30:11.027 |
| WEMABANK | 19.00 | 1.84 | 18.98 | 216.91 | 0.04 | 5.81 | 244.31B | 30.40M | 406.00 | 567.62M | 21-Oct-2025 14:30:13.973 |
| TRANSCORP | 48.50 | 1.44 | 48.28 | 0.00 | 0.00 | 0.23 | 1,971.43B | 2.23M | 266.00 | 105.88M | 21-Oct-2025 14:30:13.627 |
NSE: BEAR Signal - Price crossed below 15 Day MA
This signal implies these stocks are under selling pressure and the price might continue to slide and therefore positions should be monitored closely. Further suggested analysis include looking at the overall market (ASI) to see if the downtrend is market wide, sector wide or specific to the stock. If the overal market trend is upwards, then since these stocks are heading in the opposite direction, then further analysis should be done using commands like PC and RV on the InfoWARE Market Data Terminal. Another command is ALERTS to set price triggers for possible exit is necessar
For more detailed analysis,
- On InfoWARE Market Data Terminal <BEARM> <GO>
- On InfoWARE Finance Mobile App ( Android , iPhone & iPad and Windows 10)
| Symbol | Price | %Chg | 15DMA | PE | EPS | DivY | MktCap | Vol | Trades | Value | LstTradeTime |
|---|---|---|---|---|---|---|---|---|---|---|---|
| CUTIX | 3.70 | -0.81 | 3.71 | 8.81 | 0.26 | 6.52 | 13.03B | 5.45M | 178.00 | 20.27M | 21-Oct-2025 14:30:11.660 |
| HONYFLOUR | 22.30 | -0.90 | 22.46 | 16.28 | 0.31 | 1.40 | 176.84B | 1.84M | 319.00 | 41.28M | 21-Oct-2025 14:30:12.330 |
| PZ | 38.50 | -1.56 | 38.88 | 44.17 | 0.50 | 4.59 | 152.86B | 24.63M | 215.00 | 940.29M | 21-Oct-2025 14:30:13.250 |
| AIICO | 3.89 | -1.80 | 3.92 | 2.01 | 0.60 | 4.13 | 142.39B | 11.03M | 409.00 | 43.43M | 21-Oct-2025 14:30:10.763 |
| NEM | 28.20 | -2.48 | 28.49 | 24.99 | 0.37 | 6.52 | 141.46B | 301.59K | 75.00 | 8.53M | 21-Oct-2025 14:30:12.927 |
| STERLINGNG | 7.80 | -3.85 | 7.92 | 15.75 | 0.30 | 3.19 | 224.57B | 15.84M | 606.00 | 124.94M | 21-Oct-2025 14:30:13.490 |
| AFRIPRUD | 14.10 | -6.03 | 14.87 | 19.57 | 0.61 | 1.27 | 28.20B | 1.34M | 141.00 | 19.21M | 21-Oct-2025 14:30:10.723 |
| NEWGOLD | 52,500.00 | -8.57 | 54,502.27 | 0.00 | 0.00 | 0.00 | 0.00 | 4.00 | 4.00 | 211.50K | 21-Oct-2025 14:30:45.523 |
| FGS202890 | 50.00 | -100.00 | 87.67 | 0.00 | 0.00 | 5.00 | 1.00 | 2.50K | 21-Oct-2025 14:30:17.213 |
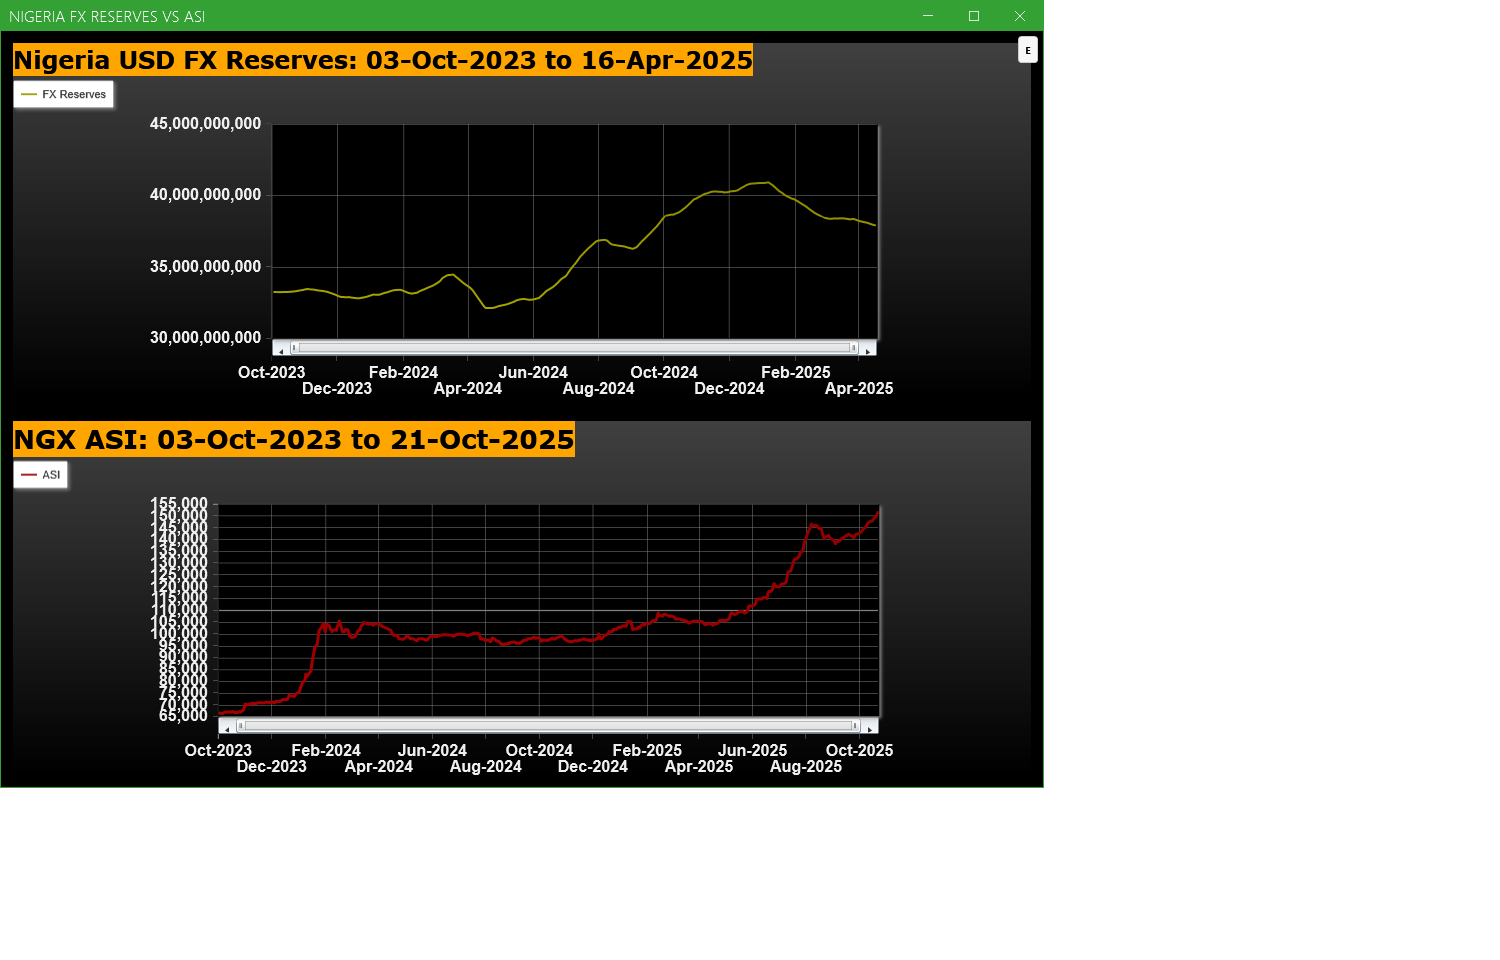
Economic Indicators - Nigeria FX Reserves Vs ASI Chart
Nigeria FX Reserves are assets held on reserve by CBN in foreign currencies. These reserves are used to back liabilities and influence monetary policy. Given the nature of the Nigeria economy, FX Reserves can appear to have an outsize influence on the economy and hence on the capital market. The chart below allows comparison of FX Reserves against the ASI to make investment decisions
For more detailed analysis,
- On InfoWARE Market Data Terminal <CI> <GO>
- On InfoWARE Finance Mobile App ( Android , iPhone & iPad and Windows 10) , "Research"
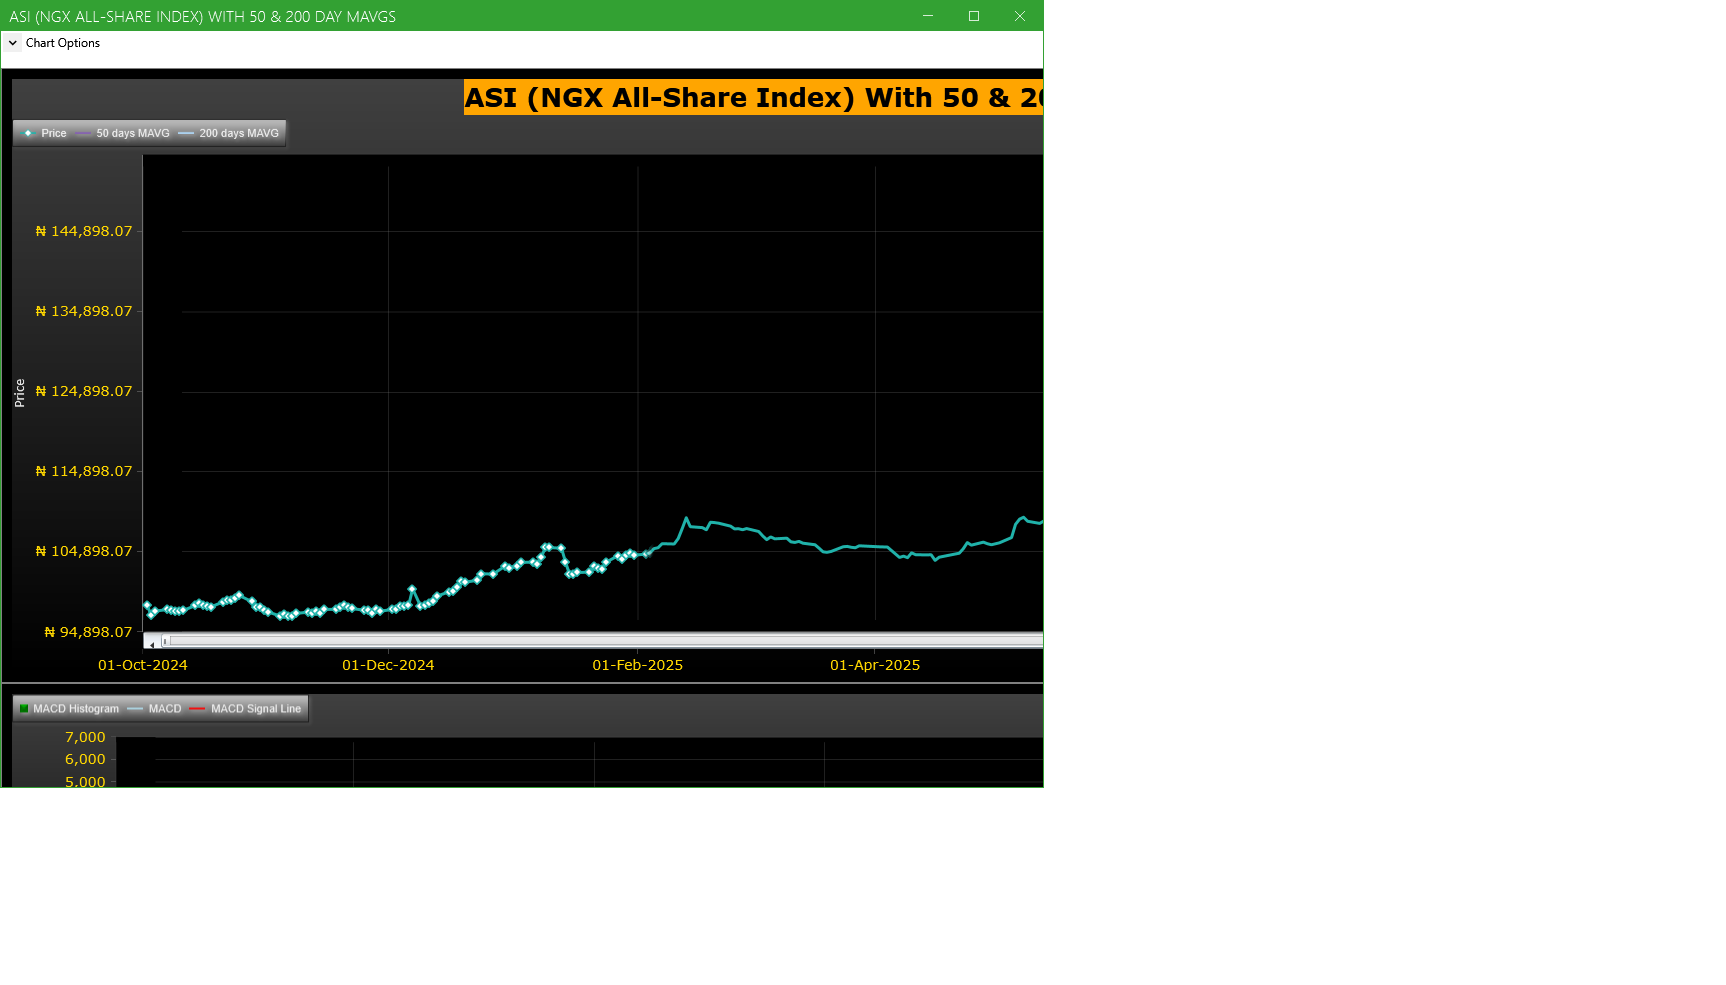
Market Trend - ASI (NGX All-Share-Index) With 50 & 200 Day MAvgs Chart
Technical traders typically use the 50 & 200 day moving averages to aid in choosing
where to enter or exit a position, which then causes these levels to act as strong
support or resistance. As a general guideline, if the price is above a moving average,
the trend is up. If the price is below a moving average, the trend is down.
It is important to note that critics of technical analysis say that moving averages act
as support and resistance because so many traders use these indicators to inform their
trading decisions. Also moving averages tend to work quite well in strong trending conditions
but poorly in choppy or ranging conditions.
Trading Strategies: Crossovers
Crossovers are one of the main moving average strategies. The first type is a price crossover,
which is when the price crosses above or below a moving average to signal a potential change
in trend. Another strategy is to apply two moving averages to a chart: one longer and one
shorter. When the shorter-term MA crosses above the longer-term MA, it is a buy signal, as
it indicates that the trend is shifting up. This is known as a golden cross. Meanwhile, when
the shorter-term MA crosses below the longer-term MA, it is a sell signal, as it indicates that
the trend is shifting down. This is known as a dead/death cross
For more detailed analysis,
- On InfoWARE Market Data Terminal <CI> <GO>
- On InfoWARE Finance Mobile App ( Android , iPhone & iPad and Windows 10) , "Research"
Unusual Volume: Volume traded is more than double the 90 day moving average (All exchanges; ASI & ASem). For more detailed analysis,
- On InfoWARE Market Data Terminal <UV> <GO>
- On InfoWARE Finance Mobile App ( Android , iPhone & iPad and Windows 10)
| Symbol | Name | Volume | 90DAvgVol | %VolChg | Price | LClose | %Chg | Trades | Value |
|---|---|---|---|---|---|---|---|---|---|
| VFDGROUP | VFD GROUP PLC | 39.31M | 7.93M | 395.99 | 10.80 | 11.00 | -1.82 | 177 | 424.66M |
| WEMABANK | WEMA BANK PLC. | 30.40M | 10.53M | 188.67 | 19.00 | 18.65 | 1.88 | 406 | 567.62M |
| PZ | P Z CUSSONS NIGERIA PLC. | 24.63M | 2.79M | 784.08 | 38.50 | 39.10 | -1.53 | 215 | 940.29M |
| HMCALL | HALDANE MCCALL PLC | 4.54M | 1.15M | 295.22 | 4.35 | 4.36 | -0.23 | 31 | 19.58M |
| LIVINGTRUST | LIVINGTRUST MORTGAGE BANK PLC | 2.41M | 745.87K | 222.55 | 4.00 | 4.44 | -9.91 | 80 | 9.73M |
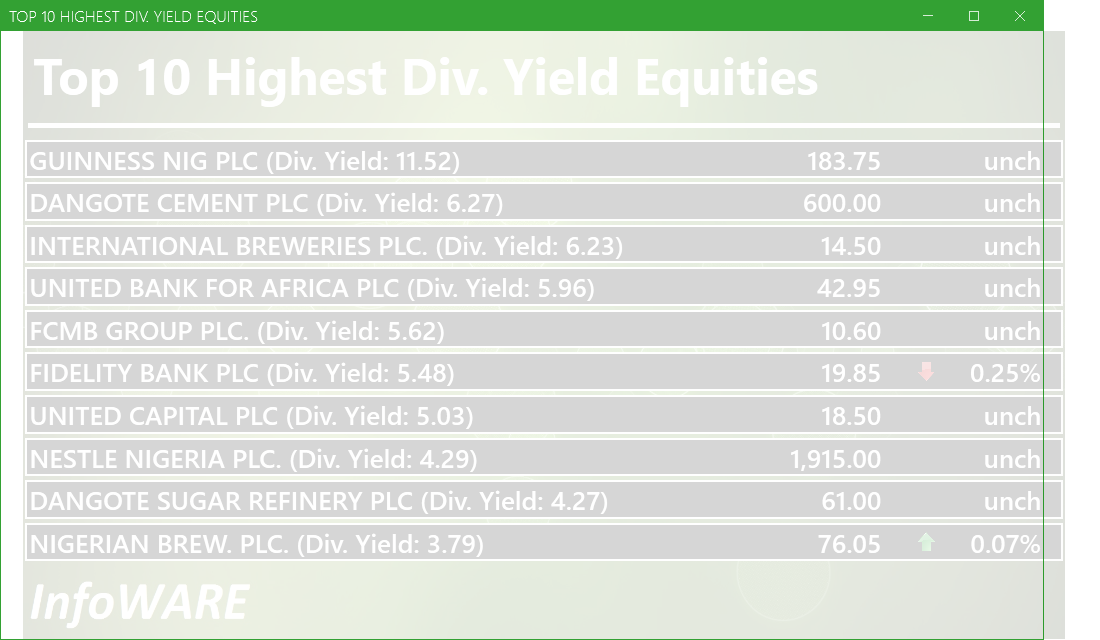
Investment Insights - High Div. Stocks
Dividend stocks distribute a portion of the company earnings to investors on a regular basis and they can a great choice for investors looking for regular income. As an investment or trading strategy, high dividend yield equities provide annual cash payments as against mostly capital gains in the price of a stock. The list in the table below represent the highest dividend paying stocks from the list of the most liquid stocks in the NSE top 30.
For more detailed analysis,
- On InfoWARE Market Data Terminal <HYIELD> <GO>
- On InfoWARE Finance Mobile App ( Android , iPhone & iPad and Windows 10) , "Research"
African Markets
| Name | LClose | Change | %Chg |
|---|---|---|---|
| BRVM Stock Exchange | 337.02 | 3.73 | 1.12 |
| Botswana Stock Exchange | 10,617.99 | 0.00 | 0.00 |
| Egyptian Exchange | 37,909.61 | 233.59 | 0.62 |
| Ghana Stock Exchange | 8,490.20 | -5.95 | -0.07 |
| Johannesburg Stock Exchange | 111,325.70 | 586.92 | 0.53 |
| Lusaka Stock Exchange | 25,379.34 | 233.85 | 0.93 |
| Casablanca Stock Exchange | 18,927.90 | 470.66 | 2.55 |
| Malawi Stock Exchange | 591,177.49 | 5,215.07 | 0.89 |
| Nigeria Stock Exchange | 149,940.81 | 968.32 | 0.65 |
| Namibian Stock Exchange | 2,026.40 | 10.28 | 0.51 |
| Rwanda Stock Exchange | 179.28 | 0.32 | 0.18 |
| Tunis Stock Exchange | 12,365.25 | 24.68 | 0.20 |
| Uganda Securities Exchange | 1,441.42 | -24.48 | -1.67 |
Nigeria Market Indexes
| Symbol | LClose | %Chg | WTD% | MTD% | QTD% | YTD% | MktCap | Trades |
|---|---|---|---|---|---|---|---|---|
| ASI | 151,456.91 | 1.01 | 1.01 | 5.93 | 5.93 | 46.79 | 25,642 | |
| NGX30 | 5,537.68 | 1.12 | 1.12 | 6.13 | 6.13 | 45.16 | 14,907 | |
| NGXAFRBVI | 3,516.17 | -0.40 | -0.40 | -0.94 | -0.94 | 41.74 | 5,305 | |
| NGXAFRHDYI | 21,916.11 | -0.51 | -0.51 | -1.55 | -1.55 | 28.71 | 7,046 | |
| NGXASEM | 1,392.88 | 0.00 | 0.00 | -9.44 | -9.44 | -12.05 | 30 | |
| NGXBNK | 1,528.85 | 0.21 | 0.21 | 0.80 | 0.80 | 40.59 | 6,032 | |
| NGXCG | 4,175.88 | 0.12 | 0.12 | 3.09 | 3.09 | 47.60 | 13,087 | |
| NGXCNSMRGDS | 3,622.39 | 3.53 | 3.53 | 7.08 | 7.08 | 108.86 | 3,108 | |
| NGXCOMMDTY | 1,186.15 | 0.97 | 0.97 | 5.73 | 5.73 | 18.61 | ||
| NGXGROWTH | 14,854.42 | -1.31 | -1.31 | -1.44 | -1.44 | 91.35 | 324 | |
| NGXINDUSTR | 5,576.53 | 0.16 | 0.16 | 10.04 | 10.04 | 56.13 | 2,876 | |
| NGXINS | 1,285.41 | 0.38 | 0.38 | 7.47 | 7.47 | 63.50 | 1,927 | |
| NGXLOTUSISLM | 12,934.67 | 1.81 | 1.81 | 8.96 | 8.96 | 85.63 | 5,627 | |
| NGXMAINBOARD | 7,323.98 | 1.47 | 1.47 | 3.96 | 3.96 | 46.36 | 18,186 | |
| NGXMERIGRW | 10,120.47 | 0.22 | 0.22 | 2.19 | 2.19 | 55.14 | 4,149 | |
| NGXMERIVAL | 13,608.49 | -0.25 | -0.25 | 1.80 | 1.80 | 30.47 | 7,264 | |
| NGXOILGAS | 2,732.74 | 2.02 | 2.02 | 8.19 | 8.19 | 0.80 | 497 | |
| NGXPENBRD | 2,819.37 | 1.08 | 1.08 | 6.35 | 6.35 | 53.93 | 21,314 | |
| NGXPENSION | 6,970.93 | 0.51 | 0.51 | 3.46 | 3.46 | 53.75 | 16,525 | |
| NGXPREMIUM | 15,078.43 | 0.17 | 0.17 | 10.13 | 10.13 | 54.92 | 7,132 | |
| NGXSOVBND | 665.94 | 0.00 | 0.00 | 1.32 | 1.32 | 10.71 | 0 |
For more detailed analysis,
- On InfoWARE Market Data Terminal <MKTINS> <GO>
- On InfoWARE Finance Mobile App ( Android, iPhone & iPad and Windows 10) , "Market Indexes"
Find the topic interesting? Will like to comment? Contact Us at solutions@infowarelimited.com
Top News

Chart Of The Day - ASI Chart Vs ASI Advance Decline Line (YTD) (21-Oct-2025 15:07:13.314)
InfoWARE AI Analyst Daily Market Report: 21-Oct-2025

[XNSA]>> CLOSING GONG CEREMONY
[VETINDETF]>> DAILY INDICATIVE PRICES
[XNSA]>> CORDROS MILESTONE FUNDS' BID & OFFER PRICES
[XNSA]>> NGX FIXED INCOME INDICATIVE PRICE LIST FOR OCT 21, 2025
[XNSA]>> H2 2025 BC/DR TEST
[XNSA]>> APPOINTMENT OF A DIRECTOR (FUTUREVIEW SECURITIES LIMITED)
[XNSA]>> AELP CAPACITY BUILDING & ASSDA FORUM
[XNSA]>> PILOT SECURITIES LIMITED - APPOINTMENT OF A DIRECTOR
[STANBICETF30]>> DAILY INDICATIVE PRICES
InfoWARE AI Analyst Daily Market Report: 20-Oct-2025
[XNSA]>> H2 2025 BC/DR TEST
[VSPBONDETF]>> DAILY INDICATIVE PRICES
[XNSA]>> CORDROS MILESTONE FUNDS' BID & OFFER PRICES
[XNSA]>> NGX FIXED INCOME INDICATIVE PRICE LIST FOR OCT 20, 2025
[XNSA]>> DAILY FUND PRICE SUBMISSION - FCMB ASSET MANAGEMENT LIMITED
[XNSA]>> EMERGING AFRICA DAILY MUTUAL FUND PRICES
[NEWGOLD]>> DAILY INDICATIVE PRICES
[XNSA]>> AELP CAPACITY BUILDING & ASSDA FORUM
Chart Of The Day - ASI Chart Vs ASI Advance Decline Line (YTD) (17-Oct-2025 15:28:15.822)
InfoWARE Analyst Daily Market Report (17-Oct-2025 15:27:53.645)
InfoWARE AI Analyst Weekly Market Report: 17-Oct-2025
InfoWARE AI Analyst Daily Market Report: 17-Oct-2025
[MERIGROWTH]>> DAILY INDICATIVE PRICES
[LOTUSHAL15]>> DAILY INDICATIVE PRICES
[XNSA]>> H2 2025 BC/DR TEST
[XNSA]>> RESIGNATION OF A DIRECTOR (NIGERIAN STOCKBROKERS LIMITED)
[VETBANK]>> DAILY INDICATIVE PRICES
[XNSA]>> NGX FIXED INCOME INDICATIVE PRICE LIST FOR OCT 17, 2025
Get IDIA - the stock trading app for the modern investor
Solutions by Business
Product Suites
Company
Contacts
- 8th Floor,
- South Atlantic Petroleum Towers,
- 1 Adeola Odeku Street,
- Victoria Island,
- Lagos, Nigeria.
- Email: solutions@infowarelimited.com
Follow Us
 |
 |
 |
 |