


InfoWARE AI Analyst Daily Market Report: 23-Apr-2025 | InfoWARE Finance
Get IDIA - the stock trading app for the modern investor


InfoWARE AI Analyst Daily Market Report: 23-Apr-2025
(Source: InfoWARE Terminal, Date: 23-Apr-2025)
Dear Investor,
NGX Daily Market Summary – Wednesday, April 23, 2025
The NGX All-Share Index (ASI) staged an impressive performance today, climbing by 0.54% to close at 104,739.61. Year to date, the market is up a modest 2.06%. Trading activity soared, with volume rising to 724.34M shares traded, more than doubling yesterday’s levels, and turnover ballooning 180.24% to ₦17.75B. Market breadth remained constructive, with advancers outpacing decliners at a ratio of 1.62x, supported by 34 gainers against 21 losers. The rally was widespread but punctuated by vibrant institutional trading, highly unusual volume spikes, and targeted bullish/bearish technical signals. Below, we unpack the most important trends and tactical insights for investors.
Key Market Trends and Breadth
- Market Breadth: 34 stocks gained versus 21 decliners; Breadth ratio of 1.62x signals positive sentiment.
- Turnover Surge: Market value traded jumped 180.24%, with volumes up >2x prior day. Institutional activity was especially dominant (93.88% of trade value).
- Advancing/Declining Stocks: Out of 138 stocks traded, 55% saw volume increases, suggesting wide participation and potentially strengthening the rally’s sustainability.
- Unusual Volume Highlights: Stocks such as FIDELITYBK and VFDGROUP posted volumes over 10x their 90-day averages, reflecting intense institutional or speculative action.
Top Gainers & Losers: Standout Moves
| Top 5 Gainers | ||||
|---|---|---|---|---|
| Stock | Price | % Change | RSI | Notable Insight |
| ABCTRANS | ₦1.56 | +9.86% | 54.9 | Momentum play; YTD +26.83% |
| VFDGROUP | ₦17.10 | +9.62% | 96.9 (extreme) | Massive swing; YTD -61.49%; speculation or reversal |
| LEARNAFRCA | ₦3.56 | +9.54% | 48.4 | Reversal from oversold; high div. yield (8.5%) |
| REGALINS | ₦0.58 | +9.43% | 39.5 | Back above 15DMA; Div. yield 6.5% |
| AFRIPRUD | ₦15.10 | +8.63% | 33.0 | Bullish 15DMA cross; 1.3% yield |
| Top 5 Losers | ||||
|---|---|---|---|---|
| Stock | Price | % Change | RSI | Notable Insight |
| NEWGOLD (ETF) | ₦42,000 | -16.00% | 60.2 | Sharp ETF pullback after YTD rally |
| TRIPPLEG | ₦1.98 | -10.00% | 22.3 (oversold) | Momentum breakdown; YTD -12.0% |
| MRS | ₦157.5 | -9.95% | 51.7 | Bearish 15DMA cross; YTD -27.7% |
| ABBEYBDS | ₦8.79 | -9.94% | 99.9 (extreme) | Surge then harsh profit taking; YTD +193% |
| JOHNHOLT | ₦7.00 | -9.68% | 32.7 | Bearish crossover; YTD -10.1% |
YTD Top Gainers & Losers (Apr 23, 2025)
| YTD Top 5 Gainers | ||||
|---|---|---|---|---|
| Stock | Price | % Chg YTD | RSI | Comment |
| ABBEYBDS | ₦9.76 | +193.00% | 99.9 (overbought) | Biggest 2025 gainer, but technical whipsaws |
| NGXGROUP | ₦33.75 | +32.11% | 57.5 | Momentum intact; institutional flows |
| ABCTRANS | ₦1.42 | +26.83% | 54.9 | Bullish trend, improving volumes |
| DANGSUGAR | ₦33 | +10.15% | 40.1 | Sector rotation to food prods |
| FIDELITYBK | ₦18.70 | +19.12% | 51.6 | Volume explosion, institutional driven |
| YTD Top 5 Losers | ||||
|---|---|---|---|---|
| Stock | Price | % Chg YTD | RSI | Comment |
| VFDGROUP | ₦15.60 | -61.49% | 96.9 | Technical dead-cat bounce? RSI stunningly high |
| CORNERST | ₦2.84 | -33.59% | 40.5 | Prolonged slide; bear market territory |
| MRS | ₦174.90 | -27.69% | 51.7 | Weak energy sector |
| REGALINS | ₦0.53 | -27.50% | 39.5 | Short-term rally, but YTD still negative |
| CILEASING | ₦3.37 | -23.67% | 37.6 | Persistent trend weakness, risk-off |
Momentum Watch: Bullish vs Bearish Crossovers
| Bullish Momentum: Closed Above 15DMA | |||||
|---|---|---|---|---|---|
| Symbol | Price | % Chg | RSI | Div Yield | Sector |
| REGALINS | ₦0.58 | +8.62% | 39.5 | 6.52% | Insurance |
| AFRIPRUD | ₦15.10 | +7.95% | 33.0 | 1.27% | Financial |
| OMATEK | ₦0.63 | +7.94% | 38.8 | 0.00% | Tech |
| DANGSUGAR | ₦35.80 | +7.82% | 40.1 | 4.27% | Food Products |
| FIDELITYBK | ₦20.25 | +7.65% | 51.6 | 5.48% | Banking |
| GUINEAINS | ₦0.70 | +7.14% | 48.0 | 1.96% | Insurance |
| JAIZBANK | ₦3.30 | +6.97% | 44.1 | 1.67% | Banking |
| UBA | ₦34.95 | +5.58% | 40.6 | 5.96% | Banking |
| NASCON | ₦43.90 | +4.44% | 47.0 | 3.09% | Food Products |
| NPFMCRFBK | ₦1.74 | 0.00% | n/a | 8.0% | Microfinance |
| Bearish Momentum: Closed Below 15DMA | |||||
|---|---|---|---|---|---|
| Symbol | Price | % Chg | RSI | Div Yield | Sector |
| VFDGROUP | ₦17.10 | +8.77% | 96.9 | 0.00% | Diversified |
| TOTAL | ₦705 | 0.00% | 91.3 | 3.71% | Petroleum |
| JOHNHOLT | ₦7.00 | -10.71% | 32.7 | 1.25% | Diversified |
| MRS | ₦157.5 | -11.05% | 51.7 | 1.79% | Petroleum |
| NEWGOLD | ₦42,000 | -19.05% | 60.2 | 0.00% | ETF |
Contrarian Signals
- VFDGROUP: +9.62% today, but RSI at 96.9 (extremely overbought) and still YTD -61.5%. Both bearish and bullish technicals collide—likely speculative or short squeeze. Traders beware of volatility whiplash.
- ABBEYBDS: 99.9 RSI (textbook overbought), still saw a -9.94% reversal after monster 2025 gains. High risk for both long and short players at current levels.
- REGALINS: Reclaims 15DMA with +9.43% day, yet YTD -27.5%. Strong dividend (6.5%) may attract contrarian bidders, but trend remains fragile.
- LEARNAFRCA: High dividend yield (8.5%), solid daily gain, but YTD is still -20.9%. Swing traders may watch for reversal follow-through.
Sector Heatmap
| Sector | Performance | Top Name(s) | Momentum (15D/50D) | Institutional Activity |
|---|---|---|---|---|
| Banking | Up | FIDELITYBK, UBA, GTCO, ZENITHBANK | ↑ | FIDELITYBK dominates inst. flow (42.1%); ZENITHBANK significant |
| Insurance | Up | REGALINS, GUINEAINS | ↑ | Retail-driven, but picking up institutional participation |
| Food Products | Up | DANGSUGAR, NASCON | ↑ | Mixed; selective institutional focus |
| Diversified | Down | VFDGROUP, JOHNHOLT | ↓ | VFDGROUP large speculative volumes |
| Petroleum | Down | TOTAL, MRS | ↓ | Low institutional appetite |
| ETF | Volatile | NEWGOLD | ↓ | Profit taking, erratic flows |
| Tech / Others | Mixed | OMATEK | ↑ | Low overall flows |
Dividend Yield vs. Beta Matrix: Defensive Plays
| Stock | Div. Yield | Beta | Comment |
|---|---|---|---|
| REGALINS | 6.52% | 0.47 | Defensive; recent bullish momentum; high yield |
| FIDELITYBK | 5.48% | 0.89 | Momentum & value play; yield with moderate risk |
| DANGSUGAR | 4.27% | 1.35 | Attracting income-focused investors, trend improving |
| AFRIPRUD | 1.27% | 0.64 | Value play, defensiveness and upside |
| GTCO | 1.88% | 1.09 | Banking blue-chip; moderate defensive |
Institutional Clustering Alerts
- FIDELITYBK: Represents 42.1% of institutional trade value today, suggesting sustained buy-side demand and possibly new fund inflows.
- ZENITHBANK: Captured 20.17% of institutional trade value; only 1.42% of institutional trade count but heavy in volume.
- GTCO: Remains a focus with large institutional volumes, but price momentum less robust.
- NB: Surging institutional interest with volumes up +147% vs 90D average; trend watch.
Trader Suggestions and Caution Flags
-
Opportunities:
- FIDELITYBK: Explosive volume, bullish technicals and ample institutional flow suggest further upside. Monitor for possible profit-taking volatility.
- REGALINS, DANGSUGAR, UBA: Attractive dividend yields, breaking out above 15DMA - could appeal to short-term momentum and dividend investors.
- NB, GTCO: Unusual volumes and rising institutional action suggest accumulating interest—potential medium-term plays.
-
Cautions:
- VFDGROUP: Ultra-high RSI and speculative reversal after huge YTD losses; only for experienced risk-takers.
- ABBEYBDS: Signs of exhaustion & profit taking after outsized gains; volatility could cut both ways.
- JOHNHOLT, MRS, TOTAL: Bearish below 15DMA with weakening technicals and lower institutional flows; avoid or trade with tight stops.
- Market Turnover: While surge may fuel short-term continuation, the pace of inflows may prove unsustainable; stay alert for reversal triggers.
Market Activity Analysis & Trade Summary Insights
- Retail/Institutional Split: Retail drove 84.9% of trades but only 6.12% of total value—suggests "smart money” is firmly in control of today’s market direction.
-
Top 5 Institutional Names:
- FIDELITYBK - 51.8% of inst. volume (₦7.7B),
- GTCO - 6.2% of volume,
- ACCESSCORP, NB, ZENITHBANK
-
Top 5 Retail Names:
- ACCESSCORP
- ZENITHBANK
- NB
- UBA
- GTCO
- Actionable Correlation: The most actively traded institutional stocks are also showing bullish crossovers and surging volume—confirming current market leadership. Retail is late to the party and chasing after institutional signals.
Hidden Insights and Patterns
- Several high-dividend yield names (REGALINS, FIDELITYBK, DANGSUGAR) are showing bullish price momentum and/or strong institutional clustering—attractive for both income and momentum investors.
- Bullish breakouts in insurance and banking indicate possible sector rotation into more defensive/undervalued areas as high-growth leaders falter or correct (see ABBEYBDS, VFDGROUP corrections).
- Extremely high RSI in VFDGROUP and ABBEYBDS among YTD top losers/gainers may portend short-term reversals or highlight "hype” over fundamentals; tread carefully.
- The bulk of today’s gains are concentrated among a small group of stocks with both institutional and retail participation, but technical signals (RSI, MACD, 15DMA/50DMA) still favor further gains in select financials.
Summary Table: Top 5 YTD Gainers and Losers (Midweek)
| Top 5 YTD Gainers | Top 5 YTD Losers | ||||
|---|---|---|---|---|---|
| Stock | %YTD | RSI | Stock | %YTD | RSI |
| ABBEYBDS | +193.0% | 99.9 | VFDGROUP | -61.5% | 96.9 |
| NGXGROUP | +32.1% | 57.5 | REGALINS | -27.5% | 39.5 |
| ABCTRANS | +26.8% | 54.9 | MRS | -27.7% | 51.7 |
| DANGSUGAR | +10.15% | 40.1 | CILEASING | -23.7% | 37.6 |
| FIDELITYBK | +19.1% | 51.6 | CORNERST | -33.6% | 40.5 |
Final Thoughts
- Bulls remain in control, driven by institutional volume spikes and breakout trends in banks, insurance, and select consumer plays.
- Rotation into dividend yield and blue-chip safety is visible. The market favors value and income stocks—strong technical signals corroborate this move.
- Speculative surges (VFDGROUP, ABBEYBDS) warrant caution due to conflicting technicals (hyper-extended RSI, reversals).
-
Traders should prioritize:
- Bullish breakouts with institutional support for follow-through
- Monitor overbought/oversold extremes for reversal trades
- Keep risk tight on high-volatility names exhibiting contrarian signals
|
Top ASI Gainers Over Last 5 Trading Days
|
Top ASI Losers Over Last 5 Trading Days
|
For more detailed analysis, on InfoWARE Market Data Terminal <NSEPERF> <GO>
On InfoWARE Finance Mobile App (Android, iPhone & iPad, Windows Phone and Windows 8/10), "Top Gainers & Losers"
ASSOCIATED BUS COMPANY PLC (ABCTRANS) topped the advancers list closing at N1.56 with a gain of 9.86% followed by VFD GROUP PLC (VFDGROUP) which closed at N17.10 with a gain of 9.62%.
On the flip side NEWGOLD EXCHANGE TRADED FUND (ETF) (NEWGOLD) and TRIPPLE GEE AND COMPANY PLC. (TRIPPLEG) topped the decliners log with a loss of -16.00% at a close of N42,000.00, and -10.00% to close the day at N1.98 respectively.
| Symbol | LClose | %Chg |
|---|---|---|
| ABCTRANS | 1.56 | 9.86 |
| VFDGROUP | 17.10 | 9.62 |
| LEARNAFRCA | 3.56 | 9.54 |
| REGALINS | 0.58 | 9.43 |
| AFRIPRUD | 15.10 | 8.63 |
For more detailed analysis,
- On InfoWARE Market Data Terminal <TOPG> <GO>
- On InfoWARE Finance Mobile App ( Android, iPhone & iPad and Windows 10) , "Top Gainers & Losers"
NSE: Bull Signal - Price crossed above 15 Day MA
This signal implies these stocks are under buying pressure and the price might continue to rise and therefore positions should be monitored closely. Further suggested analysis include looking at the overall market (ASI) to see if the uptrend is market wide, sector wide or specific to the stock. Portfolio managers tend to use this as a signal to do more research to add to their positions or lock in some profits. Typically further analysis should be done using commands like PC and RV on the InfoWARE Market Data Terminal. Another command is ALERTS to set price triggers for possible exit or entry as necessary
For more detailed analysis,
- On InfoWARE Market Data Terminal <NSEPERF> <GO>
- On InfoWARE Finance Mobile App ( Android , iPhone & iPad and Windows 10) , "Top Gainers & Losers"
| Symbol | Price | %Chg | 15DMA | PE | EPS | DivY | MktCap | Vol | Trades | Value | LstTradeTime |
|---|---|---|---|---|---|---|---|---|---|---|---|
| REGALINS | 0.58 | 8.62 | 0.57 | 4.35 | 0.11 | 6.52 | 3.87B | 4.30M | 83.00 | 2.45M | 23-Apr-2025 14:30:43.930 |
| AFRIPRUD | 15.10 | 7.95 | 14.09 | 19.57 | 0.61 | 1.27 | 30.20B | 2.28M | 135.00 | 34.11M | 23-Apr-2025 14:30:37.643 |
| OMATEK | 0.63 | 7.94 | 0.61 | 6.82 | 0.10 | 0.00 | 1.85B | 4.35M | 29.00 | 2.72M | 23-Apr-2025 14:30:43.497 |
| DANGSUGAR | 35.80 | 7.82 | 33.32 | 11.48 | 3.06 | 4.27 | 434.86B | 1.59M | 164.00 | 54.87M | 23-Apr-2025 14:30:39.387 |
| FIDELITYBK | 20.25 | 7.65 | 18.92 | 13.24 | 1.17 | 5.48 | 586.74B | 388.77M | 614.00 | 7.75B | 23-Apr-2025 14:30:39.853 |
| GUINEAINS | 0.70 | 7.14 | 0.66 | 66.79 | 0.01 | 1.96 | 4.30B | 1.04M | 19.00 | 696.68K | 23-Apr-2025 14:30:40.250 |
| JAIZBANK | 3.30 | 6.97 | 3.13 | 83.05 | 0.03 | 1.67 | 113.99B | 3.68M | 126.00 | 11.56M | 23-Apr-2025 14:30:40.967 |
| UBA | 34.95 | 5.58 | 34.38 | 8.29 | 4.05 | 5.96 | 1,195.27B | 10.14M | 454.00 | 346.29M | 23-Apr-2025 14:31:34.593 |
| CAVERTON | 2.40 | 5.00 | 2.33 | 1.15 | 1.57 | 5.52 | 8.04B | 968.97K | 47.00 | 2.22M | 23-Apr-2025 14:30:38.697 |
| VERITASKAP | 1.05 | 4.76 | 1.02 | 48.77 | 0.02 | 4.17 | 14.56B | 3.37M | 61.00 | 3.49M | 23-Apr-2025 14:30:46.110 |
| NASCON | 43.90 | 4.44 | 43.22 | 24.28 | 1.33 | 3.09 | 116.31B | 414.35K | 69.00 | 17.82M | 23-Apr-2025 14:30:42.340 |
| NAHCO | 68.65 | 3.79 | 66.67 | 92.98 | 0.41 | 6.66 | 133.80B | 801.57K | 83.00 | 54.24M | 23-Apr-2025 14:30:42.233 |
| NGXCG | 2,947.31 | 2.22 | 2,928.98 | 443.35 | 327.97 | 0.00 | 0.00 | 551.30M | 5,936.00 | 16.48B | 23-Apr-2025 14:30:58.777 |
| FGSUK2033S6 | 99.92 | 1.93 | 99.46 | 0.00 | 0.00 | 1.26K | 2.00 | 1.25M | 23-Apr-2025 14:30:57.423 | ||
| NGX30 | 3,904.60 | 0.54 | 3,888.22 | 575.61 | 329.08 | 0.00 | 0.00 | 547.81M | 6,135.00 | 16.94B | 23-Apr-2025 14:30:58.620 |
| ASI | 105,305.25 | 0.54 | 104,774.73 | 11.84 | 457.69 | 0.00 | 0.00 | 724.34M | 10,345.00 | 17.75B | 23-Apr-2025 14:30:58.580 |
| NPFMCRFBK | 1.74 | 0.00 | 1.73 | 5.63 | 0.27 | 8.00 | 10.43B | 1.46M | 28.00 | 2.56M | 23-Apr-2025 14:30:43.320 |
NSE: BEAR Signal - Price crossed below 15 Day MA
This signal implies these stocks are under selling pressure and the price might continue to slide and therefore positions should be monitored closely. Further suggested analysis include looking at the overall market (ASI) to see if the downtrend is market wide, sector wide or specific to the stock. If the overal market trend is upwards, then since these stocks are heading in the opposite direction, then further analysis should be done using commands like PC and RV on the InfoWARE Market Data Terminal. Another command is ALERTS to set price triggers for possible exit is necessar
For more detailed analysis,
- On InfoWARE Market Data Terminal <BEARM> <GO>
- On InfoWARE Finance Mobile App ( Android , iPhone & iPad and Windows 10)
| Symbol | Price | %Chg | 15DMA | PE | EPS | DivY | MktCap | Vol | Trades | Value | LstTradeTime |
|---|---|---|---|---|---|---|---|---|---|---|---|
| VFDGROUP | 17.10 | 8.77 | 71.59 | 0.00 | 0.00 | 0.00 | 0.00 | 14.59M | 253.00 | 249.45M | 23-Apr-2025 14:31:32.017 |
| TOTAL | 705.00 | 0.00 | 724.92 | 123.83 | 5.44 | 3.71 | 239.36B | 230.95K | 88.00 | 146.69M | 23-Apr-2025 14:30:44.860 |
| NGXGROWTH | 7,396.74 | -0.22 | 7,404.67 | 18.83 | 0.18 | 0.00 | 0.00 | 997.83K | 52.00 | 4.59M | 23-Apr-2025 14:30:58.867 |
| LOTUSHAL15 | 34.50 | -4.35 | 35.13 | 0.00 | 0.00 | 25.04K | 6.00 | 973.95K | 23-Apr-2025 14:31:32.337 | ||
| JOHNHOLT | 7.00 | -10.71 | 7.69 | 8.80 | 0.91 | 1.25 | 2.72B | 272.52K | 14.00 | 1.91M | 23-Apr-2025 14:30:41.160 |
| MRS | 157.50 | -11.05 | 173.74 | 26.62 | 4.96 | 1.79 | 54.00B | 197.58K | 44.00 | 31.12M | 23-Apr-2025 14:30:41.943 |
| NEWGOLD | 42,000.00 | -19.05 | 44,813.12 | 0.00 | 0.00 | 0.00 | 0.00 | 9.00 | 3.00 | 418.00K | 23-Apr-2025 14:31:32.397 |
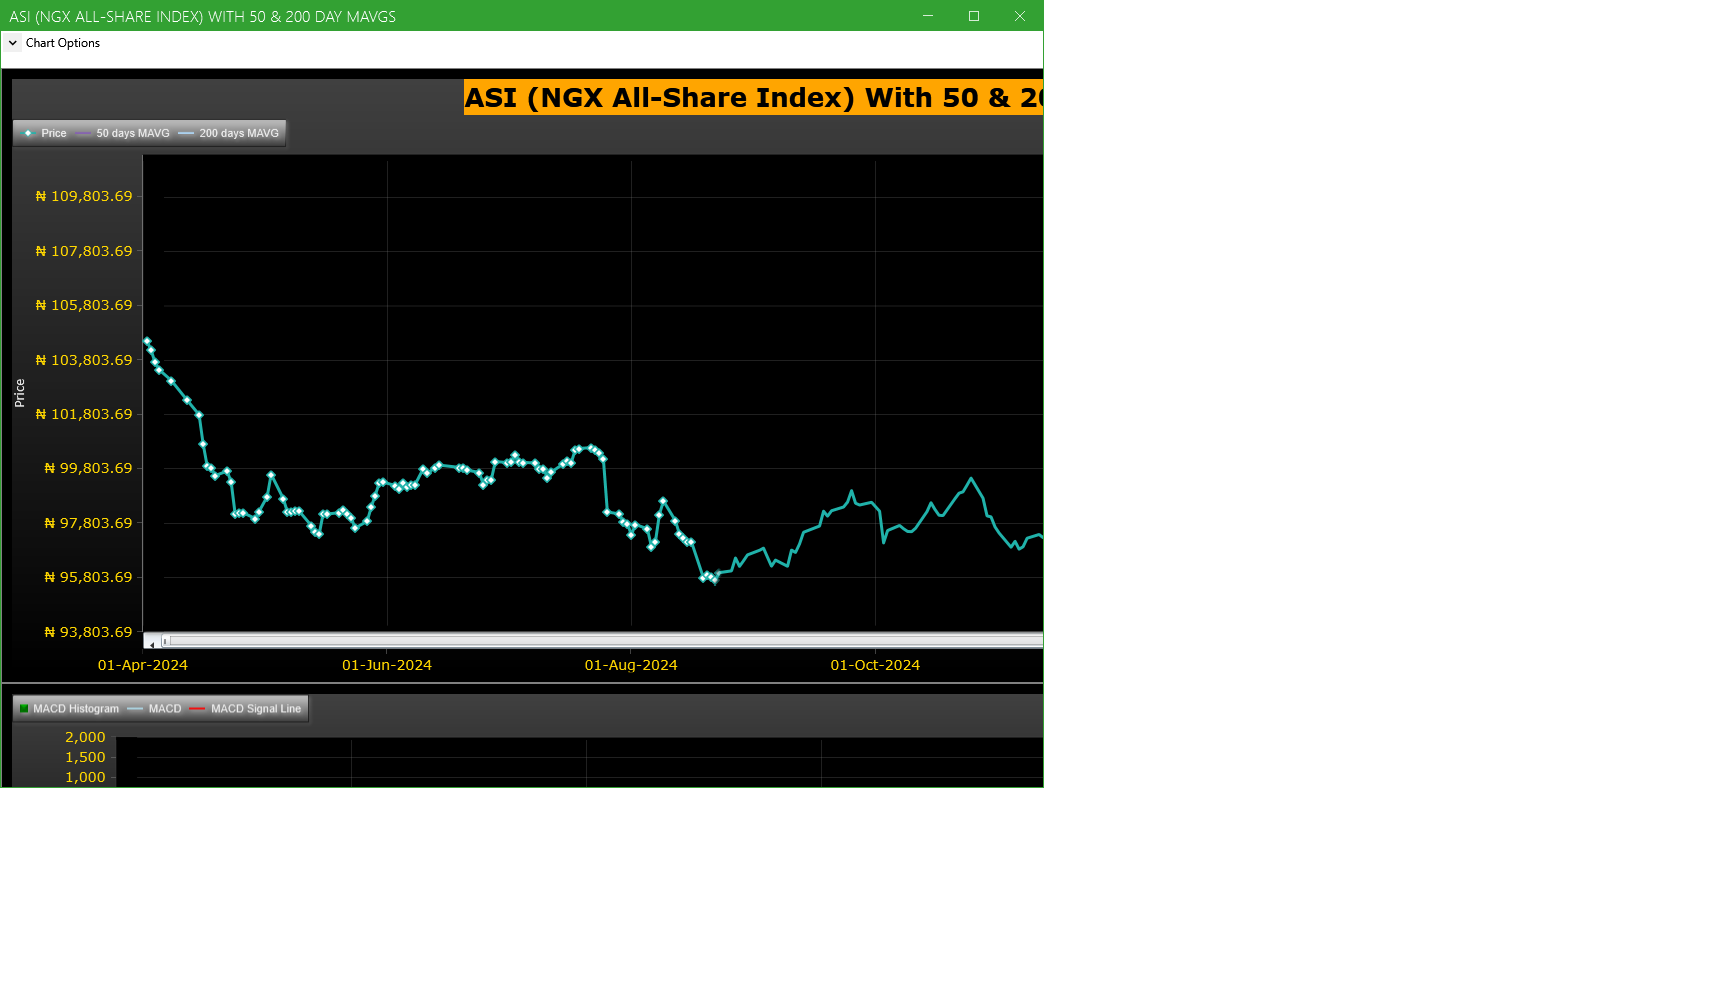
Market Trend - ASI (NGX All-Share-Index) With 50 & 200 Day MAvgs Chart
Technical traders typically use the 50 & 200 day moving averages to aid in choosing
where to enter or exit a position, which then causes these levels to act as strong
support or resistance. As a general guideline, if the price is above a moving average,
the trend is up. If the price is below a moving average, the trend is down.
It is important to note that critics of technical analysis say that moving averages act
as support and resistance because so many traders use these indicators to inform their
trading decisions. Also moving averages tend to work quite well in strong trending conditions
but poorly in choppy or ranging conditions.
Trading Strategies: Crossovers
Crossovers are one of the main moving average strategies. The first type is a price crossover,
which is when the price crosses above or below a moving average to signal a potential change
in trend. Another strategy is to apply two moving averages to a chart: one longer and one
shorter. When the shorter-term MA crosses above the longer-term MA, it is a buy signal, as
it indicates that the trend is shifting up. This is known as a golden cross. Meanwhile, when
the shorter-term MA crosses below the longer-term MA, it is a sell signal, as it indicates that
the trend is shifting down. This is known as a dead/death cross
For more detailed analysis,
- On InfoWARE Market Data Terminal <CI> <GO>
- On InfoWARE Finance Mobile App ( Android , iPhone & iPad and Windows 10) , "Research"
Unusual Volume: Volume traded is more than double the 90 day moving average (All exchanges; ASI & ASem). For more detailed analysis,
- On InfoWARE Market Data Terminal <UV> <GO>
- On InfoWARE Finance Mobile App ( Android , iPhone & iPad and Windows 10)
| Symbol | Name | Volume | 90DAvgVol | %VolChg | Price | LClose | %Chg | Trades | Value |
|---|---|---|---|---|---|---|---|---|---|
| FIDELITYBK | FIDELITY BANK PLC | 388.77M | 25.71M | 1,411.97 | 20.25 | 18.70 | 8.29 | 614 | 7.75B |
| GTCO | GUARANTY TRUST HOLDING COMPANY PLC | 47.00M | 16.50M | 184.81 | 61.00 | 60.00 | 1.67 | 529 | 2.86B |
| UNIVINSURE | UNIVERSAL INSURANCE COMPANY PLC | 41.92M | 15.87M | 164.13 | 0.51 | 0.51 | 0.00 | 98 | 20.97M |
| TANTALIZER | TANTALIZERS PLC | 22.95M | 8.22M | 179.19 | 2.30 | 2.30 | 0.00 | 106 | 52.84M |
| VFDGROUP | VFD GROUP PLC | 14.59M | 607.43K | 2,301.66 | 17.10 | 15.60 | 9.62 | 253 | 249.45M |
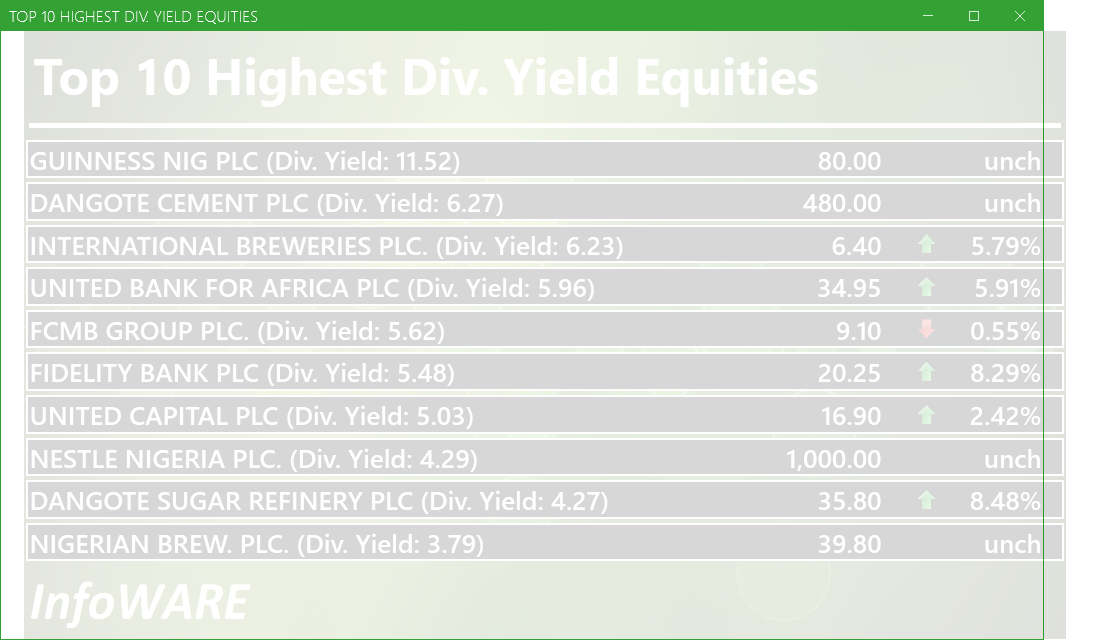
Investment Insights - High Div. Stocks
Dividend stocks distribute a portion of the company earnings to investors on a regular basis and they can a great choice for investors looking for regular income. As an investment or trading strategy, high dividend yield equities provide annual cash payments as against mostly capital gains in the price of a stock. The list in the table below represent the highest dividend paying stocks from the list of the most liquid stocks in the NSE top 30.
For more detailed analysis,
- On InfoWARE Market Data Terminal <HYIELD> <GO>
- On InfoWARE Finance Mobile App ( Android , iPhone & iPad and Windows 10) , "Research"
Investment Insights - Stocks outperforming the ASI but with approximately the same risk
These list of stocks represent equities that are less risky than the ASI but doing better than the ASI (All Shares Index) using the YTD (Year to Date) returns as the measure. The risk is measured by Beta. Beta is an assessment of a stock's tendency to undergo price changes, (its volatility), as well as its potential returns compared to the ASI. It is expressed as a ratio, where a score of 1 represents performance comparable to the ASI, and returns above or below the market may receive scores greater or lower than 1.
For a full list of both positively and negatively corelated stocks visit InfoWARE Market Data Terminal
- On InfoWARE Market Data Terminal <BANL> <GO>
- On InfoWARE Finance Mobile App ( Android , iPhone & iPad and Windows 10)
| Symbol | DivYield | PE | EPS | Beta | %ChgYTD | ASIYTDReturn | BetaDiff |
|---|---|---|---|---|---|---|---|
| HONYFLOUR | 1.40 | 16.28 | 0.31 | 0.99 | 66.91 | 2.06 | 0.01 |
| FIDELITYBK | 5.48 | 13.24 | 1.17 | 0.89 | 19.12 | 2.06 | 0.11 |
| NB | 3.79 | 16.95 | 1.60 | 0.79 | 24.38 | 2.06 | 0.21 |
| UNILEVER | 2.81 | 67.09 | 0.40 | 0.75 | 5.69 | 2.06 | 0.25 |
| HMCALL | 0.00 | 0.00 | 0.00 | -0.74 | 7.19 | 2.06 | 0.26 |
| VETGOODS | 0.00 | 0.71 | 15.41 | 2.06 | 0.29 | ||
| ABBEYBDS | 1.43 | 0.00 | 0.00 | 0.70 | 193.00 | 2.06 | 0.30 |
| NEM | 6.52 | 24.99 | 0.37 | 0.69 | 13.33 | 2.06 | 0.31 |
| TANTALIZER | 1.50 | 0.00 | 0.00 | 0.69 | 2.22 | 2.06 | 0.31 |
| NAHCO | 6.66 | 92.98 | 0.41 | 0.65 | 43.02 | 2.06 | 0.35 |
African Markets
| Name | LClose | Change | %Chg |
|---|---|---|---|
| BRVM Stock Exchange | 290.79 | 1.59 | 0.55 |
| Botswana Stock Exchange | 10,113.04 | 0.00 | 0.00 |
| Egyptian Exchange | 30,810.70 | 730.94 | 2.43 |
| Ghana Stock Exchange | 6,100.93 | 1.22 | 0.02 |
| Casablanca Stock Exchange | 16,070.49 | -306.24 | -1.87 |
| Malawi Stock Exchange | 294,562.18 | -1,837.68 | -0.62 |
| Nigeria Stock Exchange | 104,563.34 | -220.05 | -0.21 |
| Nairobi Securities Exchange | 126.78 | 1.02 | 0.81 |
| Rwanda Stock Exchange | 148.96 | 0.00 | 0.00 |
| Uganda Securities Exchange | 1,262.37 | -32.37 | -2.50 |
Nigeria Market Indexes
| Symbol | LClose | %Chg | WTD% | MTD% | QTD% | YTD% | MktCap | Trades |
|---|---|---|---|---|---|---|---|---|
| ASI | 105,305.25 | 0.54 | 0.53 | -0.23 | -0.23 | 2.06 | 10,345 | |
| NGX30 | 3,904.60 | 0.54 | 0.54 | -0.37 | -0.37 | 2.35 | 6,135 | |
| NGXAFRBVI | 2,520.82 | 2.55 | 2.55 | -5.34 | -5.34 | 1.61 | 2,581 | |
| NGXAFRHDYI | 16,930.79 | 1.58 | 1.58 | 1.72 | 1.72 | -0.57 | 2,167 | |
| NGXASEM | 1,590.30 | 0.00 | 0.00 | 0.15 | 0.15 | 0.42 | 6 | |
| NGXBNK | 1,114.53 | 2.93 | 2.93 | -3.99 | -3.99 | 2.49 | 2,959 | |
| NGXCG | 2,947.31 | 2.27 | 2.27 | -2.10 | -2.10 | 4.17 | 5,936 | |
| NGXCNSMRGDS | 1,900.59 | 1.25 | 1.25 | 4.68 | 4.68 | 9.58 | 1,437 | |
| NGXCOMMDTY | 1,002.53 | 0.00 | 0.00 | -0.10 | -0.10 | 0.25 | ||
| NGXGROWTH | 7,396.74 | -0.22 | -0.96 | 0.06 | 0.06 | -4.72 | 52 | |
| NGXINDUSTR | 3,475.50 | 0.00 | -0.02 | -0.41 | -0.41 | -2.69 | 469 | |
| NGXINS | 632.45 | -0.81 | -0.81 | -7.03 | -7.03 | -19.56 | 794 | |
| NGXLOTUSISLM | 7,483.92 | 0.46 | 0.41 | -0.93 | -0.93 | 7.41 | 1,214 | |
| NGXMAINBOARD | 5,081.89 | 0.54 | 0.54 | 0.41 | 0.41 | 1.56 | 7,678 | |
| NGXMERIGRW | 7,144.12 | 2.75 | 2.75 | 4.14 | 4.14 | 9.52 | 1,253 | |
| NGXMERIVAL | 10,343.92 | 1.82 | 1.82 | 0.49 | 0.49 | -0.83 | 3,253 | |
| NGXOILGAS | 2,417.63 | -0.09 | -0.09 | -1.18 | -1.18 | -10.83 | 223 | |
| NGXPENBRD | 1,897.29 | 0.50 | 0.50 | 0.45 | 0.45 | 3.58 | 8,318 | |
| NGXPENSION | 4,839.04 | 1.33 | 1.33 | 1.10 | 1.10 | 6.73 | 6,625 | |
| NGXPREMIUM | 10,149.26 | 0.54 | 0.54 | -0.16 | -0.16 | 4.28 | 2,615 | |
| NGXSOVBND | 651.61 | 0.00 | 0.00 | 3.95 | 3.95 | 8.32 | 0 |
For more detailed analysis,
- On InfoWARE Market Data Terminal <MKTINS> <GO>
- On InfoWARE Finance Mobile App ( Android, iPhone & iPad and Windows 10) , "Market Indexes"
Find the topic interesting? Will like to comment? Contact Us at solutions@infowarelimited.com
Top News

Chart Of The Day - ASI Chart Vs ASI Advance Decline Line (YTD) (23-Apr-2025 15:08:41.269)
InfoWARE AI Analyst Daily Market Report: 23-Apr-2025

[MERVALUE]>> DAILY INDICATIVE PRICES
Breaking News! Unusual Volume Alert (23-Apr-2025 13:21:42.759)
Breaking News! Bulls Momentum Alert (23-Apr-2025 13:21:36.068)
Breaking News! Bears Momentum Alert (23-Apr-2025 13:21:35.969)
[VSPBONDETF]>> DAILY INDICATIVE PRICES
[XNSA]>> THE NGX FIXED INCOME INDICATIVE PRICE LIST FOR APR 23, 2025
[XNSA]>> WEMA BANK PLC: ACTIVATION OF CODE FOR TRADING IN RIGHTS
[XNSA]>> DAILY FUND PRICE SUBMISSION - FCMB ASSET MANAGEMENT LIMITED
[XNSA]>> RESIGNATION OF A DIRECTOR (COWRY SECURITIES LIMITED)
[LOTUSHAL15]>> DAILY INDICATIVE PRICES
[SIAMLETF40]>> DAILY INDICATIVE PRICES
[XNSA]>> NOTIFICATION OF PRICE ADJUSTMENT
[VFDGROUP]>>Corporate Disclosures-<VFD Group Plc>
[AIRTELAFRI]>>Corporate Disclosures-<Airtel Africa Plc>
[ABBEYBDS]>>Corporate Disclosures-<ABBEY MORTGAGE BANK PLC>
[LASACO]>>Notice of Meeting -<LASACO ASSURANCE PLC.>
[XNSA]>> BEHIND THE LISTING PRESENTATION AND CLOSING GONG CEREMONY
Chart Of The Day - ASI Chart Vs ASI Advance Decline Line (YTD) (22-Apr-2025 15:16:23.973)
InfoWARE AI Analyst Daily Market Report: 22-Apr-2025
[CHAMPION]>>Notice of Meeting -<CHAMPION BREW. PLC.>
[NEM]>>Notice of Meeting -<NEM INSURANCE PLC.>
[XNSA]>> DAILY FUND PRICE SUBMISSION - FCMB ASSET MANAGEMENT LIMITED
[XNSA]>> EMERGING AFRICA DAILY MUTUAL FUND PRICES
[XNSA]>> FACTS BEHIND THE RIGHTS ISSUE PRESENTATION BY WEMA BANK PLC
[VETINDETF]>> DAILY INDICATIVE PRICES
[XNSA]>> NGX FIXED INCOME INDICATIVE PRICE LIST FOR APR 22, 2025
[XNSA]>> WEMA BANK PLC: ACTIVATION OF CODE FOR TRADING IN RIGHTS
[XNSA]>> RECLASSIFICATION OF GOLDEN GUINEA BREWERIES PLC FROM LOW PRICE STOCK GR
Get IDIA - the stock trading app for the modern investor
Solutions by Business
Product Suites
Company
Contacts
- 8th Floor,
- South Atlantic Petroleum Towers,
- 1 Adeola Odeku Street,
- Victoria Island,
- Lagos, Nigeria.
- Email: solutions@infowarelimited.com
Follow Us
 |
 |
 |
 |