


InfoWARE AI Analyst Daily Market Report: 17-Jul-2025 | InfoWARE Finance
Get IDIA - the stock trading app for the modern investor


InfoWARE AI Analyst Daily Market Report: 17-Jul-2025
(Source: InfoWARE Terminal, Date: 17-Jul-2025)
Dear Investor,
NGX Daily Market Summary – Thursday, July 17, 2025
Market Overview
Today's session on the Nigerian Exchange (NGX) delivered an impressive recovery after recent softness. The All Share Index (ASI) closed up 1.02% at 128,967.08, bringing Year-to-Date returns to a robust 26.27%. Volumes and traded value soared: turnover exploded 294.23% to ₦37.81B, driven by high institutional participation and sharp activity in cement, banking, and insurance names. Despite the bullish index move, market breadth leaned cautious: 0.65x (31 advancers vs. 48 decliners), indicating that gains were focused rather than broad-based. Standout gains in BUACEMENT (+10%) contrasted sharply with a -10% loss in megacap DANGCEM, highlighting increasing sector and stock-specific rotations.
Key Market Breadth and Notable Trends
- Market Breadth: Narrow (0.65x), with losers (48) outnumbering advancers (31) despite the headline ASI gain, suggesting rotation into select large-caps while many mid/small-caps lagged.
- Turnover & Volume: Traded value jumped 294% (₦37.81B) and volume more than tripled to 1.06B, signaling heavy institutional flows. Institutional investors dominated, accounting for 70% of volume and 91.83% of traded value.
- Unusual Volume Leaders: FIRSTHOLDCO (+9.94%, 589% above 90-day avg vol), ACCESSCORP (+2.43%, 198% above avg), ZENITHBANK (-1.32%, 174% above avg), NB (+1.35%, 342% above avg), and AIICO (-4.35%, 274% above avg) – all flagged for deep trading interest with a blend of both up and down price moves.
- Top Advancer: BUA CEMENT PLC (BUACEMENT) +10.00% (₦112.20) RSI: 71.4 (Overbought) | Bullish MACD crossover confirmed Sector Leadership: Cement
- Top Loser: DANGOTE CEMENT PLC (DANGCEM) -9.99% (₦473.3) RSI: 46.1 | MACD: negative but flattening
Top 5 Gainers & Losers (YTD)
| Name | Price | YTD % | RSI | MACD | 15D/50D MA | Sector |
|---|---|---|---|---|---|---|
| ABCTRANS | ₦5.18 | +362.60% | 89.88 | 0.55 | 3.57 / 2.95 | Transport |
| EUNISELL | ₦14.85 | +25.87% | 99.78 | 0.35 | 13.45 / 12.65 | Industrial |
| UACN | ₦48.20 | +48.71% | 97.36 | 2.92 | 42.52 / 36.24 | Conglomerates |
| FIRST HOLDCO | ₦35.40 | +25.53% | 71.36 | 0.95 | 28.27 / 26.83 | Banking |
| BUACEMENT | ₦112.20 | +17.61% | 71.38 | 2.44 | 96.84 / 89.02 | Building Materials |
| Name | Price | YTD % | RSI | MACD | Sector |
|---|---|---|---|---|---|
| CONHALLPLC | ₦3.38 | -19.53% | 60.45 | 0.12 | Insurance |
| CUTIX | ₦3.73 | -6.39% | 51.44 | 0.30 | Cables |
| FTNCOCOA | ₦7.02 | +236.17% | 75.82 | 1.19 | Agriculture |
| MCNICHOLS | ₦3.89 | +118.01% | 69.39 | 0.43 | Food |
| ACADEMY | ₦8.33 | +138.10% | 75.66 | 1.16 | Publishing |
Noteworthy Gainers/Losers and Analysis
- ABCTRANS continued its parabolic run (+362.60% YTD, RSI 89.9) – extremely overbought and risky for late entrants, but confirms the power of momentum trades in current market psychology.
- FIRSTHOLDCO doubled up with both YTD Gainer and unusual volume mentions: today's +9.94% gain, 589% vol surge, and RSI 71.4 flag near-term exhaustion but with continued institutional accumulation.
- BUACEMENT and DANGCEM: Rotation within the cement sector. BUACEMENT not only top day gainer but also bullish technicals (RSI 71.4, MACD positive, 15D > 50D MA). DANGCEM, in sharp contrast, was today's worst loser despite a strengthening MACD and normal RSI.
- Insurance Stocks: Several names (CORNERSTONE, PRESTIGE, WAPIC, GUINEAINS, CONHALLPLC) featured in bearish momentum and/or high-volume lists, highlighting sector-level selling pressure.
- Volume Anomalies: Banking again commanded deep flows – both institutional and retail in ACCESSCORP, FIRSTHOLDCO, ZENITHBANK. Watch for further follow-through or profit-taking.
Bullish and Bearish Momentum Table Deep Dive
-
Bullish Momentum: Key stocks crossing above their 15-day MA:
- BUAFOODS (Flat, testing new highs; defensive play), PZ (+6.6%), CORNERSTONE (+7.7%)
- Many of these have strong RSI readings (>70) and/or positive MACDs – watch for short-term euphoria that may revert.
-
Bearish Momentum: Stocks slipping below 15-day MAs:
- Includes ARADEL, AFRIPRUD (defensive, but failed support), several insurance names (PRESTIGE, GUINEAINS, INTENEGINS), and MAYBAKER/MECURE (pharma). Many are also YTD underperformers and/or posted >10% daily losses, signaling breakdowns.
-
Overbought Signal Cross-Checks:
- ABCTRANS (RSI almost 90), EUNISELL (RSI 99.7!), UACN and NESTLE (RSI > 85): these are in strong uptrends but show signs of possible upcoming reversal/correction due to overheating.
- MECURE (Bearish momentum, RSI 99.3): a classic bull-trap risk (high RSI with price decline and breakdown below 15DMA).
Contrarian Signals
- MECURE: Extremely high RSI (99.3) but crossed below 15DMA and down 10% today. Significant risk for reversal—momentum is unsustainably hot but price action signals topping.
- DANGCEM: Big daily loss (-9.99%) but RSI still neutral (46.1). MACD negative but flattening, suggesting possible bounce if sector rotation abates.
- BERGER (Loser, -10%): RSI 76.85, MACD at +3.12, possible exhaustion in selling. High volatility may precede a technical rebound.
- PRESTIGE: Low price, down 4.1%, PE 10.5, but bearish momentum. Still pays 2.5% yield—possibility of "fallen angel” value play if selling intensity decreases.
- Banking Sector (esp. ZENITHBANK, UBA): Negative price momentum today even on strong institutional volume. Possibility of "buy the dip” opportunity if breadth recovers.
Sector Heatmap
| Sector | Performance | Volume Lead | Technical Trend |
|---|---|---|---|
| Cement (Building Materials) | Mixed: BUACEMENT +10% / DANGCEM -10% | BUACEMENT, DANGCEM | Bullish/Rotation |
| Banking | Solid (FIRSTHOLDCO +9.94%, ACCESSCORP +2.43%) | ZENITHBANK, ACCESSCORP, FIRSTHOLDCO | Heavy Volume / Bullish |
| Insurance | Weak: PRESTIGE, GUINEAINS, CONHALLPLC down >4% | AIICO, CONHALLPLC, PRESTIGE | Bearish Momentum |
| Consumer/Food | BUAFOODS steady, PZ strong +6.6%, NB +1.35% | PZ, BUAFOODS, NESTLE | Trend Up/Stable |
| Pharma | Heavy selling, MAYBAKER, MECURE -10% | MAYBAKER, MECURE | Bearish |
Institutional/Retail Activity Patterns:
- Top Institutional Trades: ZENITHBANK (₦6.29B), ACCESSCORP (₦4.62B), FIRSTHOLDCO (₦3.04B). Pattern: Banking sector is the liquid anchor for institutions, likely due to capital allocation, market-making, or active fund strategies.
- Retail Focus: Still heavy banks (ACCESSCORP, GTCO, UBA, ZENITHBANK, FIRSTHOLDCO) but at much lower volumes/values, confirming institutions are price-setters for now.
- Concentration Alerts: ZENITHBANK alone accounted for 20.17% of institutional trade value among top 5 — heightened institutional attention.
Dividend–Beta Matrix (Defensive Stock Map)
| Stock | Dividend Yield | Beta (<1=lower risk) | Current Trend |
|---|---|---|---|
| AFRIPRUD | 1.27% | 0.64 | Bearish momentum, below 15DMA |
| CORNERSTONE | 5.28% | 0.93 | Bullish crossover, above 15DMA |
| PZ | 4.59% | 0.56 | Bullish move, above 15DMA |
| UPL | 0.60% | 0.47 | Bearish, below 15DMA |
| GUINEAINS | 1.96% | 1.51 | Bearish, below 15DMA |
- Insight: Defensive investors can find opportunities in stocks like AFRIPRUD, CORNERSTONE, PZ with above-average yield and sub-market beta. However, note that AFRIPRUD signals near-term caution (bearish momentum), while CORNERSTONE and PZ screen for continued accumulation with upside momentum.
Suggestions & Tactical Insights for Traders
- Momentum Traders: Consider booking partial profits in hyper-extended stocks (ABCTRANS, EUNISELL, UACN) with RSI near/above 90.
- Contrarian Play: Monitor DANGCEM and insurance names for mean-reversion bounce after extreme one-day drops and neutral momentum signals.
- Defensive/Income Traders: Use the Dividend–Beta matrix to cherry-pick high-yield, low-beta laggards that may offer downside protection (e.g., CORNERSTONE, PZ). For AFRIPRUD, wait for sign of selling climax/reversal above 15DMA.
- Volume Surfing: Institutional-favored banks (ZENITHBANK, ACCESSCORP, FIRSTHOLDCO) show strong flow – look for potential continuation on high volume up-days; watch for profit-taking signals if breadth remains negative.
- Bearish Momentum Alerts: Avoid/hedge stocks with breakdowns below 15DMA and high RSI (MECURE, MAYBAKER, CONHALLPLC): these names could be "falling knives.”
- Currency Watch: The Naira continues to depreciate (-0.24%), which may improve exporters and multinationals’ earnings outlook (BUAFOODS, NESTLE) and reduce confidence in purely naira-earning domestics.
Market Activity/Trading Summary Analysis
- Market Structure: Institutional trades = 70% of volume and 91% of value, Retail = 60% of trade count but only 8% of value. Institutions dominated heavy banking flows and buoyed turnover, but retail activity is fragmented and lower-value.
- Correlations: The top 5 most active stocks for both groups are from the banking sector, underscoring where liquidity and volatility will persist in the immediate term. Notably, high institutional flows coincided with outsize volume days in all five names—short-term traders should ride these waves but keep tight stops.
- Volume-Price Divergences: Some banks (e.g., ZENITHBANK) had negative price days on strong volume — watch for trend reversals in subsequent sessions.
Hidden/Subtle Insights and Competitive Edge
- Not All Breadth is Healthy: A rising ASI with poor breadth often precedes periods of volatility; if this persists, broad sell-offs may follow after select "muscle” stocks tire.
- Institutional Clustering: With ZENITHBANK commanding an outsized share of institutional trade, any sharp move (up or down) could trigger sector-wide knock-on effects.
- Overbought Readings: Several top stocks display RSIs well above 80 simultaneously (ABCTRANS, EUNISELL, UACN). This clustering raises the risk of a short-term pullback, even if medium-term trend remains up.
- Dividend/Defensive Candidates: Several high-yield, low beta names are at technical pivot levels (AFRIPRUD, PZ, CORNERSTONE) — opportunity exists to accumulate after flush-outs.
- Sector Relativity: Cement and Banking names are "carrying” the index. If money rotates out of these, index support could be tested.
Summary for Investors & Traders
- Remain nimble; focus on high-volume movers with confirmed bullish crossovers, but be ready to take profits as overbought warning signs flash.
- Watch for sector and institutional rotation – especially shifts away from banking and cement, which have driven returns.
- Run screens for stocks that combine defensive dividend, low beta, and either bullish or post-washout technicals, for reduced risk in coming weeks.
- Monitor for mean-reversion setups in YTD/top losernames (RTBRISCOE, CONHALLPLC), especially if technical breakouts or volume spikes appear.
- Overall, the tape remains bullish, but "winner’s fatigue” is emerging in hot stocks: stagger entries, use dynamic stops, trim into key resistance zones, and keep a contrarian radar active for reversal signals.
Bottom Line: It was a bullish day for the index, but the undercurrent is selective and increasingly choppy. Stay alert for sharp corrections in overbought names, monitor sector flows, and lean into high-yield, low-beta stocks as a defensive anchor while keeping an eye on volumes for short-term tactical trades.
|
Top ASI Gainers Over Last 5 Trading Days
|
Top ASI Losers Over Last 5 Trading Days
|
For more detailed analysis, on InfoWARE Market Data Terminal <NSEPERF> <GO>
On InfoWARE Finance Mobile App (Android, iPhone & iPad, Windows Phone and Windows 8/10), "Top Gainers & Losers"
BUA CEMENT PLC (BUACEMENT) topped the advancers list closing at N112.20 with a gain of 10.00% followed by DANGOTE CEMENT PLC (DANGCEM) which closed at N473.30 with a gain of 9.99%.
On the flip side HALDANE MCCALL PLC (HMCALL) and BERGER PAINTS PLC (BERGER) topped the decliners log with a loss of -10.00% at a close of N4.68, and -10.00% to close the day at N33.75 respectively.
| Symbol | LClose | %Chg |
|---|---|---|
| BUACEMENT | 112.20 | 10.00 |
| DANGCEM | 473.30 | 9.99 |
| CHAMS | 3.09 | 9.96 |
| FIRSTHOLDCO | 35.40 | 9.94 |
| ABCTRANS | 5.69 | 9.85 |
For more detailed analysis,
- On InfoWARE Market Data Terminal <TOPG> <GO>
- On InfoWARE Finance Mobile App ( Android, iPhone & iPad and Windows 10) , "Top Gainers & Losers"
Currency Market
In the currency market, the Naira fell 0.24%(-3.68) against the Dollar to settle at 1 to 1NSE: Bull Signal - Price crossed above 15 Day MA
This signal implies these stocks are under buying pressure and the price might continue to rise and therefore positions should be monitored closely. Further suggested analysis include looking at the overall market (ASI) to see if the uptrend is market wide, sector wide or specific to the stock. Portfolio managers tend to use this as a signal to do more research to add to their positions or lock in some profits. Typically further analysis should be done using commands like PC and RV on the InfoWARE Market Data Terminal. Another command is ALERTS to set price triggers for possible exit or entry as necessary
For more detailed analysis,
- On InfoWARE Market Data Terminal <NSEPERF> <GO>
- On InfoWARE Finance Mobile App ( Android , iPhone & iPad and Windows 10) , "Top Gainers & Losers"
| Symbol | Price | %Chg | 15DMA | PE | EPS | DivY | MktCap | Vol | Trades | Value | LstTradeTime |
|---|---|---|---|---|---|---|---|---|---|---|---|
| FGSUK2027S3 | 96.90 | 18.99 | 80.96 | 0.00 | 0.00 | 9.00K | 3.00 | 8.72M | 17-Jul-2025 14:30:53.567 | ||
| CORNERST | 4.40 | 7.73 | 4.25 | 8.62 | 0.35 | 5.28 | 79.93B | 2.15M | 94.00 | 9.11M | 17-Jul-2025 14:30:25.090 |
| PZ | 37.80 | 6.61 | 35.55 | 44.17 | 0.50 | 4.59 | 150.08B | 3.68M | 153.00 | 133.80M | 17-Jul-2025 14:30:32.410 |
| BUAFOODS | 459.00 | 0.00 | 457.67 | 0.00 | 0.00 | 1.39 | 8,262.00B | 3.32M | 245.00 | 1.42B | 17-Jul-2025 14:30:24.573 |
NSE: BEAR Signal - Price crossed below 15 Day MA
This signal implies these stocks are under selling pressure and the price might continue to slide and therefore positions should be monitored closely. Further suggested analysis include looking at the overall market (ASI) to see if the downtrend is market wide, sector wide or specific to the stock. If the overal market trend is upwards, then since these stocks are heading in the opposite direction, then further analysis should be done using commands like PC and RV on the InfoWARE Market Data Terminal. Another command is ALERTS to set price triggers for possible exit is necessar
For more detailed analysis,
- On InfoWARE Market Data Terminal <BEARM> <GO>
- On InfoWARE Finance Mobile App ( Android , iPhone & iPad and Windows 10)
| Symbol | Price | %Chg | 15DMA | PE | EPS | DivY | MktCap | Vol | Trades | Value | LstTradeTime |
|---|---|---|---|---|---|---|---|---|---|---|---|
| ARADEL | 521.00 | -0.96 | 522.80 | 0.00 | 0.00 | 1.72 | 2,263.66B | 2.76M | 694.00 | 1.44B | 17-Jul-2025 14:30:24.027 |
| AFRIPRUD | 16.00 | -2.19 | 16.19 | 19.57 | 0.61 | 1.27 | 32.00B | 4.14M | 235.00 | 66.60M | 17-Jul-2025 14:30:23.343 |
| PRESTIGE | 1.21 | -4.13 | 1.22 | 10.49 | 0.08 | 2.50 | 16.04B | 5.74M | 74.00 | 7.11M | 17-Jul-2025 14:30:32.270 |
| UPL | 5.80 | -4.31 | 5.96 | 7.13 | 0.59 | 0.60 | 2.50B | 469.15K | 48.00 | 2.78M | 17-Jul-2025 14:30:35.767 |
| NGXGROWTH | 9,503.89 | -5.84 | 9,722.08 | 18.83 | 0.18 | 0.00 | 0.00 | 3.59M | 259.00 | 22.66M | 17-Jul-2025 14:30:55.757 |
| GUINEAINS | 0.94 | -7.45 | 0.98 | 66.79 | 0.01 | 1.96 | 5.77B | 2.46M | 81.00 | 2.39M | 17-Jul-2025 14:30:28.210 |
| INTENEGINS | 2.00 | -8.00 | 2.06 | 0.52 | 2.85 | 3.40 | 2.57B | 1.40M | 48.00 | 2.90M | 17-Jul-2025 14:30:28.863 |
| WAPIC | 2.25 | -9.33 | 2.32 | 72.55 | 0.02 | 2.56 | 53.98B | 8.04M | 142.00 | 18.44M | 17-Jul-2025 14:30:37.360 |
| NEWGOLD | 51,600.00 | -10.47 | 54,894.27 | 0.00 | 0.00 | 0.00 | 0.00 | 3.00 | 2.00 | 165.60K | 17-Jul-2025 14:31:28.520 |
| CONHALLPLC | 3.05 | -10.82 | 3.14 | 69.63 | 0.03 | 2.08 | 32.65B | 19.15M | 271.00 | 58.86M | 17-Jul-2025 14:31:27.380 |
| NEIMETH | 7.92 | -10.98 | 7.95 | 125.52 | 0.02 | 3.38 | 33.84B | 6.72M | 207.00 | 53.58M | 17-Jul-2025 14:30:31.240 |
| ROYALEX | 1.18 | -11.02 | 1.23 | 0.00 | 0.00 | 7.81 | 6.07B | 5.27M | 74.00 | 6.37M | 17-Jul-2025 14:30:32.553 |
| MAYBAKER | 15.30 | -11.11 | 16.93 | 58.94 | 0.14 | 3.75 | 26.40B | 1.76M | 180.00 | 27.32M | 17-Jul-2025 14:30:30.243 |
| MECURE | 11.70 | -11.11 | 12.71 | 0.00 | 0.00 | 1.36M | 64.00 | 15.98M | 17-Jul-2025 14:31:35.467 |
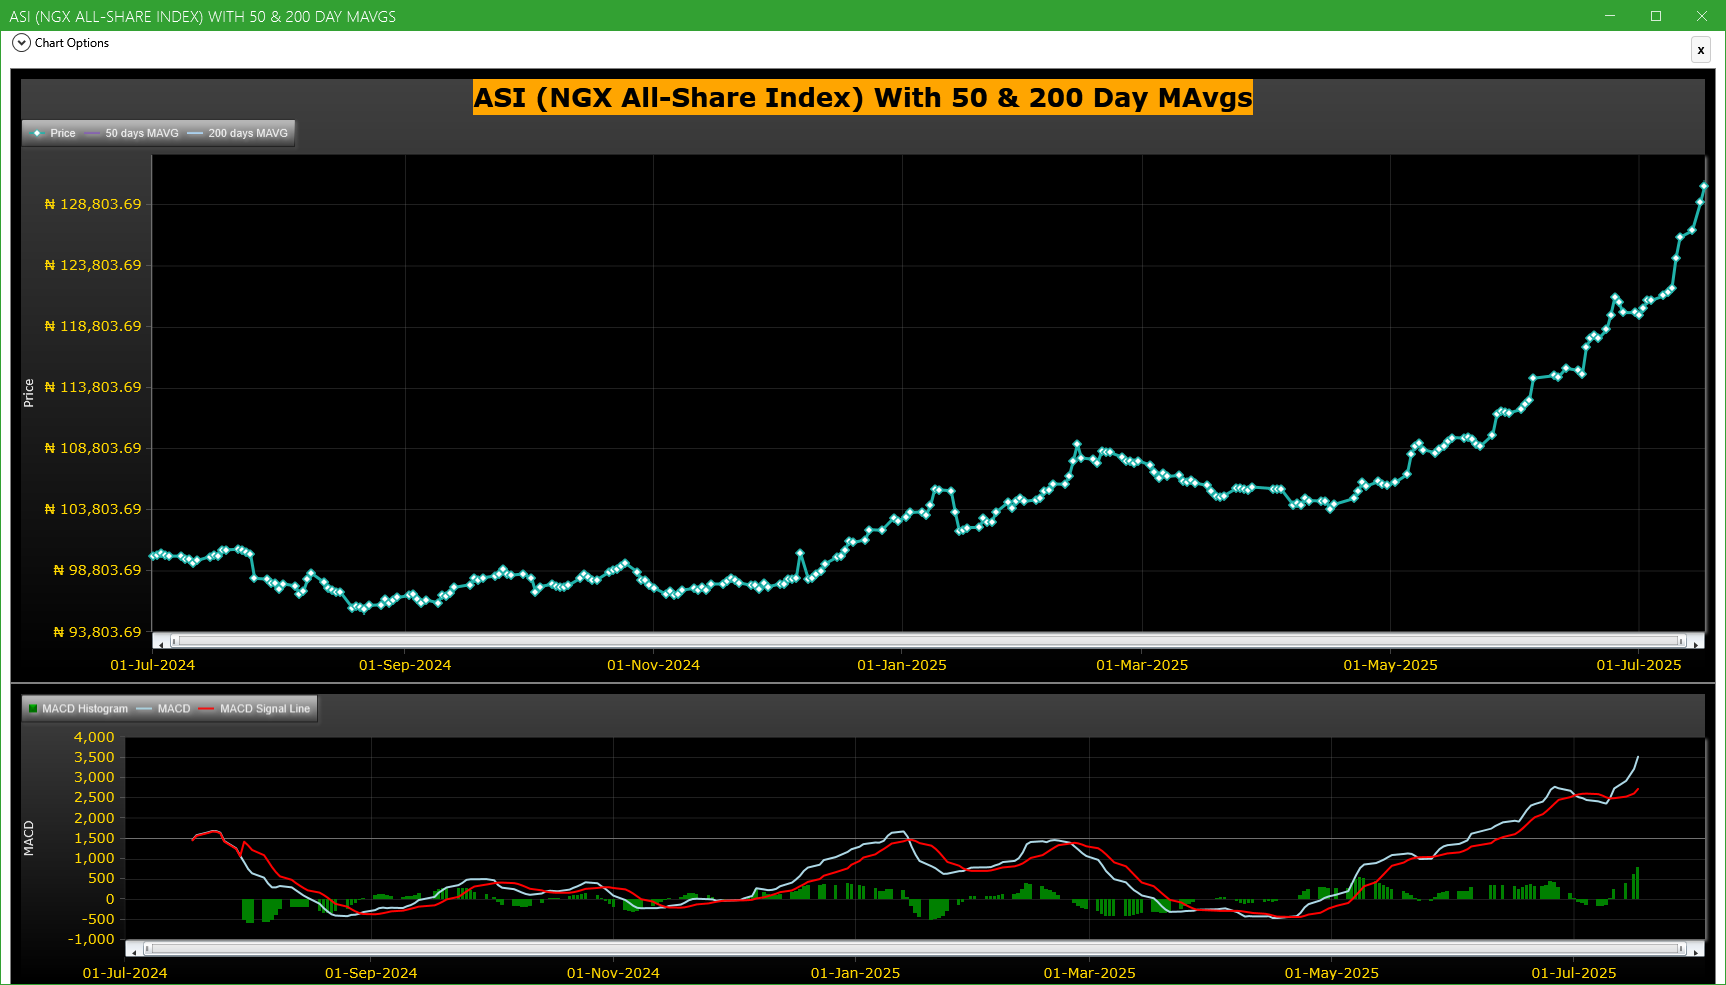
Market Trend - ASI (NGX All-Share-Index) With 50 & 200 Day MAvgs Chart
Technical traders typically use the 50 & 200 day moving averages to aid in choosing
where to enter or exit a position, which then causes these levels to act as strong
support or resistance. As a general guideline, if the price is above a moving average,
the trend is up. If the price is below a moving average, the trend is down.
It is important to note that critics of technical analysis say that moving averages act
as support and resistance because so many traders use these indicators to inform their
trading decisions. Also moving averages tend to work quite well in strong trending conditions
but poorly in choppy or ranging conditions.
Trading Strategies: Crossovers
Crossovers are one of the main moving average strategies. The first type is a price crossover,
which is when the price crosses above or below a moving average to signal a potential change
in trend. Another strategy is to apply two moving averages to a chart: one longer and one
shorter. When the shorter-term MA crosses above the longer-term MA, it is a buy signal, as
it indicates that the trend is shifting up. This is known as a golden cross. Meanwhile, when
the shorter-term MA crosses below the longer-term MA, it is a sell signal, as it indicates that
the trend is shifting down. This is known as a dead/death cross
For more detailed analysis,
- On InfoWARE Market Data Terminal <CI> <GO>
- On InfoWARE Finance Mobile App ( Android , iPhone & iPad and Windows 10) , "Research"
Unusual Volume: Volume traded is more than double the 90 day moving average (All exchanges; ASI & ASem). For more detailed analysis,
- On InfoWARE Market Data Terminal <UV> <GO>
- On InfoWARE Finance Mobile App ( Android , iPhone & iPad and Windows 10)
| Symbol | Name | Volume | 90DAvgVol | %VolChg | Price | LClose | %Chg | Trades | Value |
|---|---|---|---|---|---|---|---|---|---|
| ACCESSCORP | Access Holdings PLC | 168.10M | 56.36M | 198.26 | 27.45 | 26.80 | 2.43 | 2,889 | 4.62B |
| FIRSTHOLDCO | FIRST HOLDCO PLC | 86.42M | 12.54M | 589.08 | 35.40 | 32.20 | 9.94 | 1,454 | 3.04B |
| ZENITHBANK | ZENITH INTERNATIONAL BANK PLC | 83.36M | 30.39M | 174.29 | 75.00 | 76.00 | -1.32 | 2,118 | 6.29B |
| NB | NIGERIAN BREW. PLC. | 68.57M | 15.51M | 342.12 | 75.00 | 74.00 | 1.35 | 387 | 5.08B |
| AIICO | AIICO INSURANCE PLC. | 65.25M | 17.47M | 273.56 | 2.20 | 2.30 | -4.35 | 817 | 139.27M |
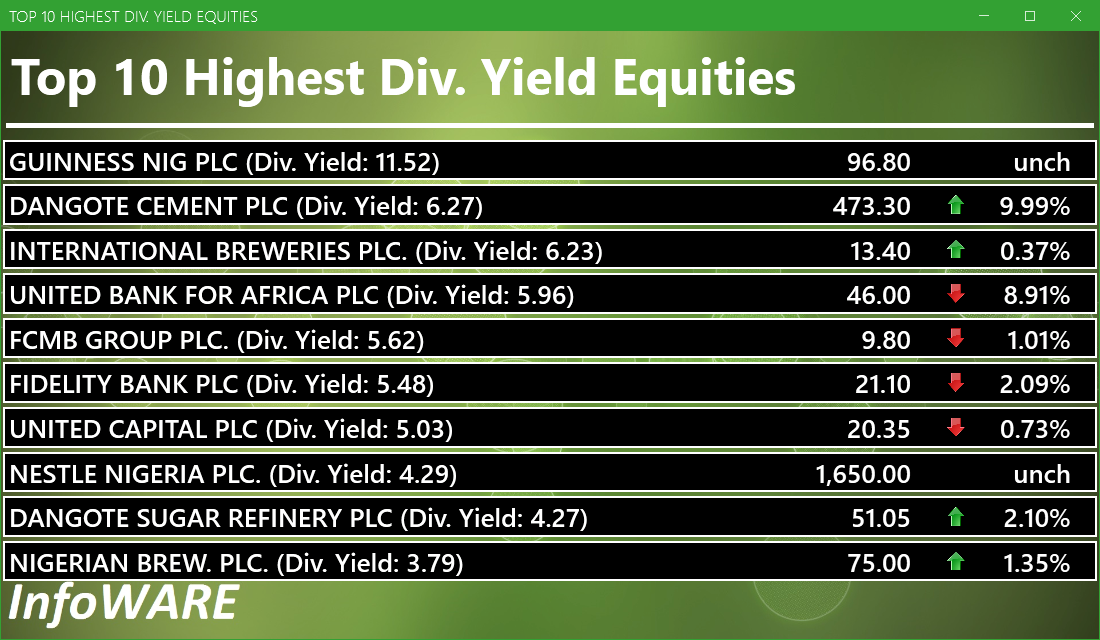
Investment Insights - High Div. Stocks
Dividend stocks distribute a portion of the company earnings to investors on a regular basis and they can a great choice for investors looking for regular income. As an investment or trading strategy, high dividend yield equities provide annual cash payments as against mostly capital gains in the price of a stock. The list in the table below represent the highest dividend paying stocks from the list of the most liquid stocks in the NSE top 30.
For more detailed analysis,
- On InfoWARE Market Data Terminal <HYIELD> <GO>
- On InfoWARE Finance Mobile App ( Android , iPhone & iPad and Windows 10) , "Research"
African Markets
| Name | LClose | Change | %Chg |
|---|---|---|---|
| BRVM Stock Exchange | 310.25 | 3.74 | 1.22 |
| Botswana Stock Exchange | 10,428.27 | 0.00 | 0.00 |
| Egyptian Exchange | 33,473.77 | -461.52 | -1.36 |
| Johannesburg Stock Exchange | 97,064.25 | 48.51 | 0.05 |
| Lusaka Stock Exchange | 20,206.88 | -1,301.24 | -6.05 |
| Casablanca Stock Exchange | 18,818.05 | -5.65 | -0.03 |
| Malawi Stock Exchange | 364,131.18 | 2,135.77 | 0.59 |
| Nigeria Stock Exchange | 128,967.08 | 2,280.36 | 1.80 |
| Nairobi Securities Exchange | 157.60 | 0.57 | 0.36 |
| Namibian Stock Exchange | 1,769.40 | 14.04 | 0.80 |
| Rwanda Stock Exchange | 150.43 | 0.00 | 0.00 |
| Tunis Stock Exchange | 11,793.07 | 24.71 | 0.21 |
| Uganda Securities Exchange | 1,329.75 | -7.89 | -0.59 |
Nigeria Market Indexes
| Symbol | LClose | %Chg | WTD% | MTD% | QTD% | YTD% | MktCap | Trades |
|---|---|---|---|---|---|---|---|---|
| ASI | 130,283.84 | 1.02 | 2.84 | 8.80 | 8.80 | 26.27 | 34,034 | |
| NGX30 | 4,787.63 | 1.08 | 2.99 | 1.35 | 1.35 | 25.50 | 19,149 | |
| NGXAFRBVI | 3,655.49 | -4.13 | 3.34 | 3.16 | 3.16 | 47.35 | 10,218 | |
| NGXAFRHDYI | 22,177.19 | -2.90 | 0.33 | 6.04 | 6.04 | 30.24 | 9,734 | |
| NGXASEM | 1,446.38 | 0.00 | -9.56 | -9.32 | -9.32 | -8.67 | 10 | |
| NGXBNK | 1,552.86 | -2.34 | 4.55 | 2.79 | 2.79 | 42.80 | 10,035 | |
| NGXCG | 4,048.41 | -1.21 | 3.99 | 17.73 | 17.73 | 43.09 | 18,159 | |
| NGXCNSMRGDS | 2,784.70 | 0.54 | 1.88 | -19.72 | -19.72 | 60.56 | 3,699 | |
| NGXCOMMDTY | 1,060.59 | -0.17 | 0.02 | 1.27 | 1.27 | 6.06 | ||
| NGXGROWTH | 9,503.89 | -5.52 | -5.93 | -0.06 | -0.06 | 22.43 | 259 | |
| NGXINDUSTR | 4,154.14 | 9.08 | 10.34 | 17.92 | 17.92 | 16.31 | 2,749 | |
| NGXINS | 866.05 | -0.89 | -3.80 | 17.26 | 17.26 | 10.16 | 2,378 | |
| NGXLOTUSISLM | 10,257.98 | 2.70 | 3.91 | 7.14 | 7.14 | 47.22 | 4,366 | |
| NGXMAINBOARD | 6,214.82 | 0.11 | 1.50 | 5.35 | 5.35 | 24.20 | 24,140 | |
| NGXMERIGRW | 9,172.48 | -1.48 | 2.21 | -4.97 | -4.97 | 40.61 | 3,906 | |
| NGXMERIVAL | 13,609.02 | -1.90 | 3.45 | 13.90 | 13.90 | 30.47 | 10,975 | |
| NGXOILGAS | 2,427.28 | -0.61 | -0.79 | 1.47 | 1.47 | -10.47 | 442 | |
| NGXPENBRD | 2,389.68 | 1.17 | 3.24 | 3.93 | 3.93 | 30.47 | 27,343 | |
| NGXPENSION | 6,532.07 | -0.80 | 2.68 | 2.79 | 2.79 | 44.07 | 21,025 | |
| NGXPREMIUM | 13,268.61 | 2.74 | 5.39 | 15.68 | 15.68 | 36.33 | 9,635 | |
| NGXSOVBND | 665.26 | -0.53 | -0.57 | 1.80 | 1.80 | 10.59 | 0 |
For more detailed analysis,
- On InfoWARE Market Data Terminal <MKTINS> <GO>
- On InfoWARE Finance Mobile App ( Android, iPhone & iPad and Windows 10) , "Market Indexes"
Find the topic interesting? Will like to comment? Contact Us at solutions@infowarelimited.com
Top News

Chart Of The Day - ASI Chart Vs ASI Advance Decline Line (YTD) (17-Jul-2025 15:23:08.892)
InfoWARE AI Analyst Daily Market Report: 17-Jul-2025

[XNSA]>> CORDROS MILESTONE FUNDS' BID & OFFER PRICES
[NEWGOLD]>> DAILY INDICATIVE PRICES
[XNSA]>> EMERGING AFRICA DAILY FUND PRICES
[VSPBONDETF]>> DAILY INDICATIVE PRICES
[AIRTELAFRI]>>Corporate Disclosures-<Airtel Africa Plc>
[MERGROWTH]>> DAILY INDICATIVE PRICES
[MECURE]>>Corporate Disclosures-<MECURE INDUSTRIES PLC>
Chart Of The Day - ASI Chart Vs ASI Advance Decline Line (YTD) (16-Jul-2025 15:07:07.613)
InfoWARE AI Analyst Daily Market Report: 16-Jul-2025
[NPFMCRFBK]>>Notice of Meeting -<NPF MICROFINANCE BANK PLC>
[NEM]>>Notice of Meeting -<NEM INSURANCE PLC.>
[XNSA]>> OFF MARKET TRADE
[AIRTELAFRI]>>Corporate Disclosures-<Airtel Africa Plc>
[AIRTELAFRI]>>Corporate Disclosures-<Airtel Africa Plc>
[PRESTIGE]>>Corporate Disclosures-<PRESTIGE ASSURANCE PLC>
[XNSA]>> POSTPONED CLOSING GONG CEREMONY IN HONOUR OF THE MAYOR OF LONDON
[STANBICETF30]>> DAILY INDICATIVE PRICES
[XNSA]>> NOTIFICATION OF PRICE ADJUSTMENT
InfoWARE AI Analyst Daily Market Report: 14-Jul-2025
Chart Of The Day - ASI Chart Vs ASI Advance Decline Line (YTD) (14-Jul-2025 15:11:06.924)
InfoWARE AI Analyst Daily Market Report: 14-Jul-2025
[MAYBAKER]>>Notice of Meeting -<MAY AND BAKER>
[ASOSAVINGS]>>Corporate Disclosures-<ASO SAVINGS AND LOANS PLC>
[VETGOODS]>> DAILY INDICATIVE PRICES
[XNSA]>> DAILY FUND PRICE SUBMISSION - FCMB ASSET MANAGEMENT LIMITED
[XNSA]>> EMERGING AFRICA DAILY FUND PRICES
[XNSA]>> CORDROS MILESTONE FUNDS' BID & OFFER PRICES
[XNSA]>> NGX FIXED INCOME INDICATIVE PRICE LIST FOR JUL 14, 2025
Get IDIA - the stock trading app for the modern investor
Solutions by Business
Product Suites
Company
Contacts
- 8th Floor,
- South Atlantic Petroleum Towers,
- 1 Adeola Odeku Street,
- Victoria Island,
- Lagos, Nigeria.
- Email: solutions@infowarelimited.com
Follow Us
 |
 |
 |
 |