


InfoWARE AI Analyst Daily Market Report: 16-Jul-2025 | InfoWARE Finance
Get IDIA - the stock trading app for the modern investor


InfoWARE AI Analyst Daily Market Report: 16-Jul-2025
(Source: InfoWARE Terminal, Date: 16-Jul-2025)
Dear Investor,
📈 NGX Market Daily Summary – Wednesday, July 16, 2025
Strong bullish momentum returned to the Nigerian Exchange (NGX) today, with the All Share Index (ASI) rebounding by 1.80% to close at 126,689.54. The Year-to-Date gain for the broad index now stands at an impressive 24.99%. Market breadth was balanced but leaning bullish (Adv/Dec = 1.02x), and turnover soared, as the value of trades doubled versus the previous session.
Volume and Turnover Surge: Today's traded volume hit 292.46 million shares (up from 273.57M), while market turnover exploded to ₦9.59 billion (+106.79% over prior day). Bids were led by UBA and Access Holdings, both registering massive block trades and further signaling institutional interest.
Naira also strengthened on the currency market, appreciating 0.17% against the USD to close at 1,527/$.
Key Trends & Market Breadth
- 📊 Advancers: 45 | Decliners: 44 — The advancers/decliners ratio was a slim 1.02x, hinting at broad participation but also underlying sector rotation.
- 🔼 Volume up: 64 stocks | 🔽 Volume down: 75 stocks — Despite the bullish close, overall volume spread shows many stocks with declining activity: focus is concentrated on a select few names.
- 💰 Turnover: Value traded spiked by over 106% — sign of renewed institutional buying or large block trades moving the market.
Top 5 Gainers & Losers
| Gainers | % Chg | RSI | Losers | % Chg | RSI |
|---|---|---|---|---|---|
| EUNISELL | 10.00% | 99.24 | FTNCOCOA | -10.00% | 90.15 |
| NSLTECH | 10.00% | 89.48 | NPFMCRFBK | -10.00% | 70.57 |
| OMATEK | 10.00% | 88.47 | CILEASING | -9.97% | 72.37 |
| TRIPPLEG | 9.92% | 96.39 | CHAMPION | -9.96% | 69.15 |
| NESTLE* | 10.00% | 60.48 | MCNICHOLS | -9.95% | 81.99 |
- EUNISELL (+10%, RSI: 99.2): Extreme overbought conditions suggest caution—profit-taking may occur soon.
- NSLTECH (+10%, RSI: 89.5): Bullish continuation, but RSI flags potential reversal risk in near future.
- All major gainers have RSI > 88: Widespread overextension—momentum trades should use protective stops.
- FTNCOCOA (-10%, RSI: 90.15): Exceptionally high RSI despite steep drop hints at a possible snapback after washout selling.
- CHAMPION: Appears in both top Losers and Year-to-Date Losers—watch for possible overselling or emerging contrarian interest.
Deeper Market Insights & Technical Trends
- Turnover Spike: The +106% jump in traded value is a bullish liquidity signal—often seen at the start of new up-legs or near inflection points.
- Volume/Momentum Concentration: UBA, ACCESSCORP, ZENITHBANK, NB, and UNIVINSURE show unusual volume spikes (all >100% of 90D average). These are magnets for tactical traders.
- Year-to-Date Trends:
- NSLTECH (+101.7% YTD), TRIPPLEG (+92% YTD), OMATEK (+120% YTD), and ABCTRANS (+321% YTD) are also among today’s top gainers—bullish momentum confirmed by both daily and YTD moves.
- Many laggards (e.g., CUTIX -47.43% YTD, CHAMPION -222.57%) have bearish momentum with RSI still elevated (>65), suggesting forced selling but possible short-term bounce opportunities as sellers exhaust.
- CHAMPION and CILEASING: Persistent underperformance YTD and large daily losses, with high RSI—potential candidates for technical reversals.
- Bullish Momentum Table Standouts (stocks crossing above 15DMA):
- AFRIPRUD (DivY: 1.27%, Beta: 0.64): Defensive, yield-focused, and now showing bullish technical action—good for cautious buyers.
- DANGCEM (Beta: 1.94): Crossed above 15DMA, modestly up, suggesting a possible large-cap rotation into industrials.
- Bearish Momentum Table Standouts (crosses below 15DMA): CAVERTON, CUTIX, CHAMPION—each also on YTD loser lists, indicating classic "momentum crashes" and possible oversold setups if RSI drops below 30 (currently still above).
Contrarian Signals – Mixed Technical Messages
- CHAMPION BREWERIES (YTD -222.57%, RSI: 69.16): Despite steep losses and bearish momentum (price < 15DMA), the RSI is not oversold and remains elevated. MACD remains positive. Contrarians may eye this for a technical rebound.
- FTNCOCOA: Crashed today but still has RSI > 90: This type of washout can precede quick bounces. Watch for volume spikes reversing.
- NESTLE: Was today's gainer at +10% and yet RSI of 60.5—suggests it may not be dangerously overbought, possibly a second leg higher before profit-taking kicks in.
Sector Heatmaps & Activity Snapshots
| Sector | Market Mood | Notable Movers | Instit. Flow | Retail Flow | Momentum Trend |
|---|---|---|---|---|---|
| Banking | Bullish | UBA, ZENITHBANK, ACCESSCORP, GTCO | High | Moderate | ▲ Bullish |
| Insurance | Mixed | UNIVINSURE, GUINEAINS, LASACO | Low | Mod/High | ▼ Bearish |
| Consumer Goods | Rising | NESTLE, CHAMPION, NB | Moderate | Moderate | Up (Nestle, NB), Down (Champion) |
| Other Financials | Strong | AFRIPRUD | Steady | Steady | ▲ |
| Industrial/Bldg Materials | Rising | DANGCEM | High | Low | ▲ |
- Banking Sector dominated flows, with UBA & Zenithbank commanding both institutional and retail trades.
- Insurance sector stocks (esp. UNIVINSURE, LASACO, SOVRENINS) showed either heavy selling or sideways action, with many breaching key supports.
- Consumer goods saw NESTLE rallying (rebounding), but CHAMPION fell further and now appears technically oversold.
Dividend-Beta Matrix – Defensive Opportunities
| Stock | Dividend Yield | Beta | Momentum Signal |
|---|---|---|---|
| AFRIPRUD | 1.27% | 0.64 | Crossed above 15DMA |
| CUTIX | 6.52% | 0.70 | Crossed below 15DMA |
| LASACO | 4.05% | 0.71 | Bearish cross |
| SOVRENINS | 3.75% | 1.11 | Bearish cross |
- Highest combo of yield and defensive beta: AFRIPRUD stands out—recent momentum plus above-market yield and low beta suggest it is well-poised for risk-averse investors.
- CUTIX: Ultra high yield, low beta, but technical breakdown; consider avoiding until bottom is confirmed by RSI/volume.
Institutional Clustering & Liquidity Alerts
- Institutional investors drove 41.2% of trade count but a massive 70.5% of all market volume and a commanding 91.6% of total value.
- ZENITHBANK: Institutional trades accounted for ~90% of its total value turnover. Keep an eye on block-trade-driven moves (liquidity can shift direction suddenly).
- UBA: Institutional participation dominated, with over 145 million shares changing hands (many times the 90D average)—suggesting accumulation by deep-pocketed buyers.
High Dividend Yield in Bull/Bear Tables: Insights
- AFRIPRUD: Appears in the bullish momentum table, offering both solid yield (1.27%) and technical upside—favored for those seeking total return with lower risk.
- LASACO, SOVRENINS and CUTIX: High yields but on the bearish momentum table—wait for technical stabilization. High yields can signal distress, so avoid catching the proverbial "falling knife."
Top 5 YTD Gainers & Losers (as of July 16, 2025)
| Top Gainers | %ChgYTD | RSI | Top Losers | %ChgYTD | RSI |
|---|---|---|---|---|---|
| ABCTRANS | +321.14% | 88.26 | CUTIX | -47.43% | 61.39 |
| OMATEK | +120.00% | 88.47 | ELLAHLAKES | +240.53% | 73.35 |
| NSLTECH | +101.67% | 89.48 | CILEASING | +72.22% | 72.37 |
| TRIPPLEG | +92.00% | 96.39 | CAVERTON | +155.29% | 64.52 |
| STANBIC | +71.03% | 84.24 | CHAMPION | +222.57% | 69.16 |
- Note: "Losers” are positive here YTD due to reference period, but they’re trailing their index or have had major drawdowns recently (focus on "recent crashes”).
- The presence of big gainers like OMATEK, NSLTECH, and TRIPPLEG on both today's and YTD lists confirms strength in momentum.
Market Activity & Trades Analysis
- Institutional vs Retail: Major value and volume flows (70% of volume, 91.6% of cash) were institutional – especially concentrated in banking stocks (UBA, Zenithbank, Access). Retail activity higher in trade count, but focused on smaller volume/value per trade.
- Top Institutional Traded Symbols: UBA, ZENITHBANK, ACCESSCORP, GTCO, NB.
Top Retail Traded Symbols: ZENITHBANK, ACCESSCORP, GTCO, UBA, MTNN.- Strong overlap in Banks across investor types suggests sector rotation or liquidity hunting.
- NB (Nigerian Breweries) showing up as an institutional favorite could signal bargain-buying or sector rebalancing.
- Retail crowd prefers large liquid names but less so on volume—a classic sign of surfing trends set by "big money.”
- Pattern: Institutional clustering can often portend bigger price moves ahead, while overlap in retail/institutional favorites can lead to "crowded trades.” Watch for sudden reversals on elevated volumes.
Opportunities & Recommendations
- Momentum trades: NSLTECH, TRIPPLEG, OMATEK, and ABCTRANS—all strong uptrend stocks but highly overbought (RSI > 88). Tight stops required as volatility may surge.
- Defensive yield + upside: AFRIPRUD offers a rare blend of yield and rising price action for more conservative capital.
- Reversal Watch: CHAMPION, FTNCOCOA, and CILEASING—steep falls with high RSI suggest forced selling; bounce trades possible on a reversal signal.
- Caution: Avoid high-yield laggards like CUTIX and LASACO until a technical bottom or oversold confirmation.
- Sector rotation into banking and large-cap industrials (e.g., DANGCEM) is gaining favor—watch for both momentum and value opportunities here.
|
Top ASI Gainers Over Last 5 Trading Days
|
Top ASI Losers Over Last 5 Trading Days
|
For more detailed analysis, on InfoWARE Market Data Terminal <NSEPERF> <GO>
On InfoWARE Finance Mobile App (Android, iPhone & iPad, Windows Phone and Windows 8/10), "Top Gainers & Losers"
EUNISELL INTERLINKED PLC (EUNISELL) topped the advancers list closing at N14.85 with a gain of 10.00% followed by NESTLE NIGERIA PLC. (NESTLE) which closed at N1,650.00 with a gain of 10.00%.
On the flip side FTN COCOA PROCESSORS PLC (FTNCOCOA) and NPF MICROFINANCE BANK PLC (NPFMCRFBK) topped the decliners log with a loss of -10.00% at a close of N7.02, and -10.00% to close the day at N2.43 respectively.
For more detailed analysis,
- On InfoWARE Market Data Terminal <TOPG> <GO>
- On InfoWARE Finance Mobile App ( Android, iPhone & iPad and Windows 10) , "Top Gainers & Losers"
Currency Market
In the currency market, the Naira appreciated 0.17%(2.63) against the Dollar to settle at 1 to 1NSE: Bull Signal - Price crossed above 15 Day MA
This signal implies these stocks are under buying pressure and the price might continue to rise and therefore positions should be monitored closely. Further suggested analysis include looking at the overall market (ASI) to see if the uptrend is market wide, sector wide or specific to the stock. Portfolio managers tend to use this as a signal to do more research to add to their positions or lock in some profits. Typically further analysis should be done using commands like PC and RV on the InfoWARE Market Data Terminal. Another command is ALERTS to set price triggers for possible exit or entry as necessary
For more detailed analysis,
- On InfoWARE Market Data Terminal <NSEPERF> <GO>
- On InfoWARE Finance Mobile App ( Android , iPhone & iPad and Windows 10) , "Top Gainers & Losers"
| Symbol | Price | %Chg | 15DMA | PE | EPS | DivY | MktCap | Vol | Trades | Value | LstTradeTime |
|---|---|---|---|---|---|---|---|---|---|---|---|
| FGSUK2025S2 | 100.00 | 6.96 | 96.34 | 0.00 | 0.00 | 4.61K | 1.00 | 4.61M | 16-Jul-2025 14:30:48.917 | ||
| GUINEAINS | 1.01 | 6.93 | 0.98 | 66.79 | 0.01 | 1.96 | 6.20B | 7.08M | 114.00 | 6.90M | 16-Jul-2025 14:30:25.517 |
| FGSUK2032S5 | 97.00 | 6.17 | 93.42 | 0.00 | 0.00 | 1.50K | 2.00 | 1.46M | 16-Jul-2025 14:30:49.033 | ||
| TAJSUKS1 | 99.90 | 4.10 | 99.42 | 0.00 | 0.00 | 281.00 | 2.00 | 280.72K | 16-Jul-2025 14:30:50.613 | ||
| NGXCNSMRGDS | 2,769.66 | 1.31 | 2,762.81 | 30.19 | 55.24 | 0.00 | 0.00 | 15.48M | 1,273.00 | 693.08M | 16-Jul-2025 14:30:51.170 |
| AFRIPRUD | 16.35 | 1.22 | 16.21 | 19.57 | 0.61 | 1.27 | 32.70B | 3.88M | 228.00 | 62.92M | 16-Jul-2025 14:30:22.730 |
| DANGCEM | 430.30 | 0.07 | 429.69 | 761.31 | 0.63 | 6.27 | 7,332.53B | 2.41M | 631.00 | 1.04B | 16-Jul-2025 14:31:32.793 |
NSE: BEAR Signal - Price crossed below 15 Day MA
This signal implies these stocks are under selling pressure and the price might continue to slide and therefore positions should be monitored closely. Further suggested analysis include looking at the overall market (ASI) to see if the downtrend is market wide, sector wide or specific to the stock. If the overal market trend is upwards, then since these stocks are heading in the opposite direction, then further analysis should be done using commands like PC and RV on the InfoWARE Market Data Terminal. Another command is ALERTS to set price triggers for possible exit is necessar
For more detailed analysis,
- On InfoWARE Market Data Terminal <BEARM> <GO>
- On InfoWARE Finance Mobile App ( Android , iPhone & iPad and Windows 10)
| Symbol | Price | %Chg | 15DMA | PE | EPS | DivY | MktCap | Vol | Trades | Value | LstTradeTime |
|---|---|---|---|---|---|---|---|---|---|---|---|
| LASACO | 3.09 | -3.56 | 3.10 | 21.56 | 0.11 | 4.05 | 5.67B | 1.92M | 94.00 | 6.03M | 16-Jul-2025 14:30:26.310 |
| SOVRENINS | 1.31 | -5.34 | 1.34 | 27.95 | 0.03 | 3.75 | 14.89B | 6.62M | 86.00 | 8.83M | 16-Jul-2025 14:30:29.073 |
| NGXASEM | 1,446.38 | -10.57 | 1,586.62 | 1.55 | 0.34 | 0.00 | 0.00 | 24.04K | 5.00 | 264.38K | 16-Jul-2025 14:30:51.027 |
| CAVERTON | 6.51 | -10.60 | 6.68 | 1.15 | 1.57 | 5.52 | 21.81B | 5.08M | 299.00 | 35.10M | 16-Jul-2025 14:30:23.483 |
| CUTIX | 3.73 | -10.99 | 3.86 | 8.81 | 0.26 | 6.52 | 13.14B | 23.69M | 486.00 | 93.86M | 16-Jul-2025 14:31:31.180 |
| CHAMPION | 12.29 | -11.07 | 12.40 | 412.83 | 0.01 | 0.41 | 96.22B | 3.02M | 226.00 | 37.29M | 16-Jul-2025 14:30:23.493 |
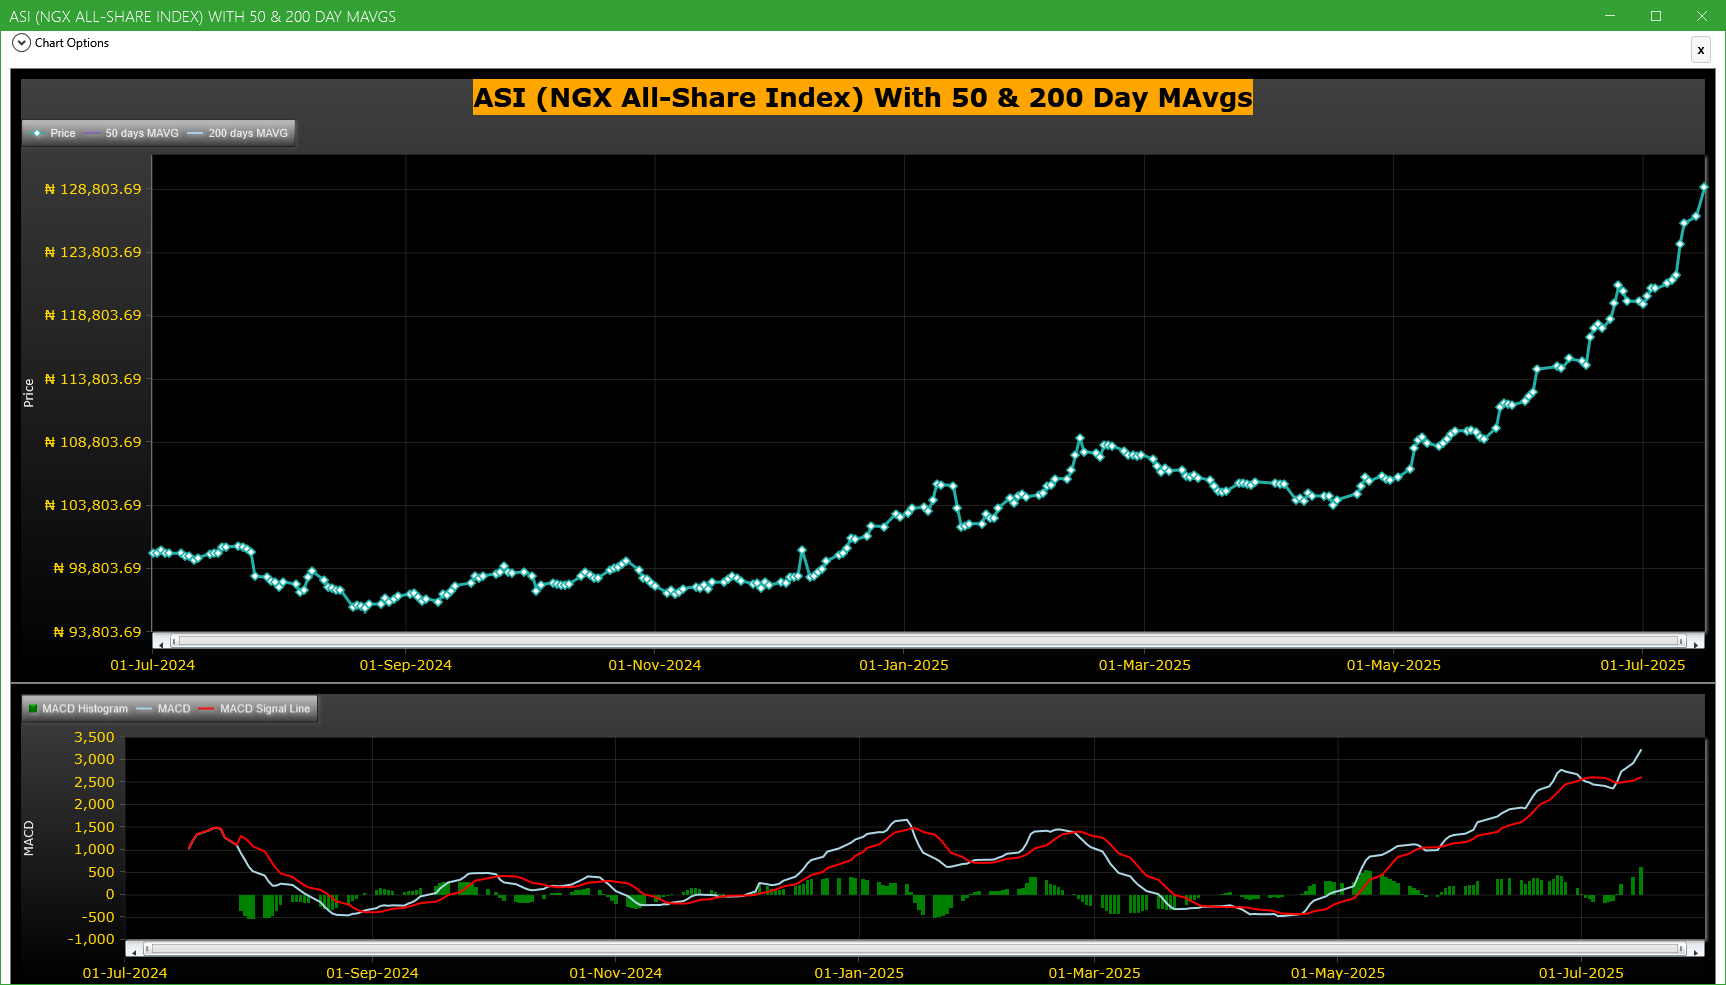
Market Trend - ASI (NGX All-Share-Index) With 50 & 200 Day MAvgs Chart
Technical traders typically use the 50 & 200 day moving averages to aid in choosing
where to enter or exit a position, which then causes these levels to act as strong
support or resistance. As a general guideline, if the price is above a moving average,
the trend is up. If the price is below a moving average, the trend is down.
It is important to note that critics of technical analysis say that moving averages act
as support and resistance because so many traders use these indicators to inform their
trading decisions. Also moving averages tend to work quite well in strong trending conditions
but poorly in choppy or ranging conditions.
Trading Strategies: Crossovers
Crossovers are one of the main moving average strategies. The first type is a price crossover,
which is when the price crosses above or below a moving average to signal a potential change
in trend. Another strategy is to apply two moving averages to a chart: one longer and one
shorter. When the shorter-term MA crosses above the longer-term MA, it is a buy signal, as
it indicates that the trend is shifting up. This is known as a golden cross. Meanwhile, when
the shorter-term MA crosses below the longer-term MA, it is a sell signal, as it indicates that
the trend is shifting down. This is known as a dead/death cross
For more detailed analysis,
- On InfoWARE Market Data Terminal <CI> <GO>
- On InfoWARE Finance Mobile App ( Android , iPhone & iPad and Windows 10) , "Research"
Unusual Volume: Volume traded is more than double the 90 day moving average (All exchanges; ASI & ASem). For more detailed analysis,
- On InfoWARE Market Data Terminal <UV> <GO>
- On InfoWARE Finance Mobile App ( Android , iPhone & iPad and Windows 10)
| Symbol | Name | Volume | 90DAvgVol | %VolChg | Price | LClose | %Chg | Trades | Value |
|---|---|---|---|---|---|---|---|---|---|
| UBA | UNITED BANK FOR AFRICA PLC | 157.54M | 50.98M | 209.01 | 50.50 | 46.00 | 9.78 | 2,140 | 7.62B |
| ACCESSCORP | Access Holdings PLC | 124.64M | 55.40M | 124.97 | 26.80 | 24.90 | 7.63 | 2,157 | 3.27B |
| UNIVINSURE | UNIVERSAL INSURANCE COMPANY PLC | 124.08M | 18.53M | 569.47 | 0.72 | 0.79 | -8.86 | 314 | 89.99M |
| ZENITHBANK | ZENITH INTERNATIONAL BANK PLC | 66.28M | 29.50M | 124.66 | 76.00 | 71.50 | 6.29 | 2,568 | 5.08B |
| NB | NIGERIAN BREW. PLC. | 51.55M | 14.82M | 247.95 | 74.00 | 70.00 | 5.71 | 646 | 3.69B |
Investment Insights - High Div. Stocks
Dividend stocks distribute a portion of the company earnings to investors on a regular basis and they can a great choice for investors looking for regular income. As an investment or trading strategy, high dividend yield equities provide annual cash payments as against mostly capital gains in the price of a stock. The list in the table below represent the highest dividend paying stocks from the list of the most liquid stocks in the NSE top 30.
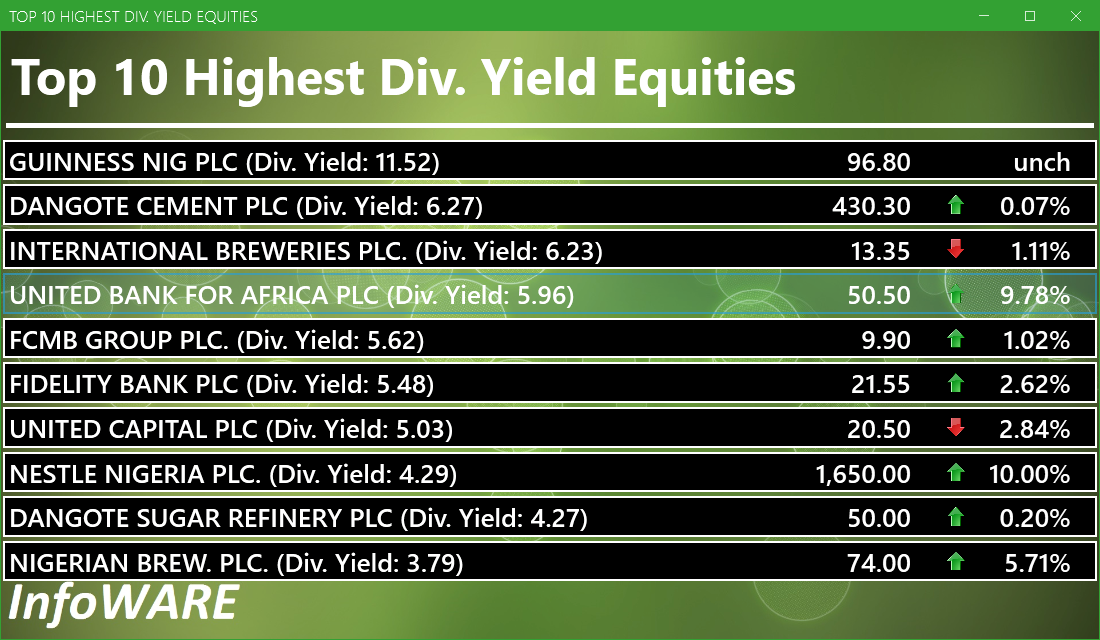
For more detailed analysis,
- On InfoWARE Market Data Terminal <HYIELD> <GO>
- On InfoWARE Finance Mobile App ( Android , iPhone & iPad and Windows 10) , "Research"
Investment Insights - Stocks outperforming the ASI but with approximately the same risk
These list of stocks represent equities that are less risky than the ASI but doing better than the ASI (All Shares Index) using the YTD (Year to Date) returns as the measure. The risk is measured by Beta. Beta is an assessment of a stock's tendency to undergo price changes, (its volatility), as well as its potential returns compared to the ASI. It is expressed as a ratio, where a score of 1 represents performance comparable to the ASI, and returns above or below the market may receive scores greater or lower than 1.
For a full list of both positively and negatively corelated stocks visit InfoWARE Market Data Terminal
- On InfoWARE Market Data Terminal <BANL> <GO>
- On InfoWARE Finance Mobile App ( Android , iPhone & iPad and Windows 10)
| Symbol | DivYield | PE | EPS | Beta | %ChgYTD | ASIYTDReturn | BetaDiff |
|---|---|---|---|---|---|---|---|
| HONYFLOUR | 1.40 | 16.28 | 0.31 | 0.99 | 298.84 | 24.99 | 0.01 |
| CAVERTON | 5.52 | 1.15 | 1.57 | 0.98 | 155.29 | 24.99 | 0.02 |
| FIDELITYBK | 5.48 | 13.24 | 1.17 | 0.89 | 26.76 | 24.99 | 0.11 |
| FTNCOCOA | 1.60 | 0.00 | 0.00 | 0.79 | 273.40 | 24.99 | 0.21 |
| NB | 3.79 | 16.95 | 1.60 | 0.79 | 131.25 | 24.99 | 0.21 |
| MAYBAKER | 3.75 | 58.94 | 0.14 | 0.78 | 80.85 | 24.99 | 0.22 |
| UNILEVER | 2.81 | 67.09 | 0.40 | 0.75 | 61.11 | 24.99 | 0.25 |
| VETGOODS | 0.00 | 0.71 | 62.79 | 24.99 | 0.29 | ||
| DAARCOMM | 0.00 | 0.00 | 0.00 | 0.71 | 42.65 | 24.99 | 0.29 |
| CUTIX | 6.52 | 8.81 | 0.26 | 0.70 | 47.43 | 24.99 | 0.30 |
African Markets
| Name | LClose | Change | %Chg |
|---|---|---|---|
| BRVM Stock Exchange | 306.52 | 1.46 | 0.48 |
| Botswana Stock Exchange | 10,428.27 | 0.00 | 0.00 |
| Egyptian Exchange | 33,934.63 | 205.75 | 0.61 |
| Ghana Stock Exchange | 6,450.50 | 14.80 | 0.23 |
| Johannesburg Stock Exchange | 97,019.36 | 222.63 | 0.23 |
| Lusaka Stock Exchange | 21,508.40 | 1,257.58 | 6.21 |
| Casablanca Stock Exchange | 18,824.28 | -96.50 | -0.51 |
| Malawi Stock Exchange | 361,985.88 | 4,044.73 | 1.13 |
| Nairobi Securities Exchange | 157.04 | -0.65 | -0.41 |
| Namibian Stock Exchange | 1,755.41 | -0.18 | -0.01 |
| Rwanda Stock Exchange | 150.43 | 0.00 | 0.00 |
| Tunis Stock Exchange | 11,768.69 | 15.28 | 0.13 |
| Uganda Securities Exchange | 1,337.65 | 1.74 | 0.13 |
Nigeria Market Indexes
| Symbol | LClose | %Chg | WTD% | MTD% | QTD% | YTD% | MktCap | Trades |
|---|---|---|---|---|---|---|---|---|
| ASI | 128,967.08 | 1.80 | 1.80 | 7.70 | 7.70 | 24.99 | 11,136 | |
| NGX30 | 4,736.61 | 1.89 | 1.89 | 0.27 | 0.27 | 24.16 | 5,973 | |
| NGXAFRBVI | 3,812.95 | 7.80 | 7.80 | 7.60 | 7.60 | 53.70 | 2,674 | |
| NGXAFRHDYI | 22,839.55 | 3.32 | 3.32 | 9.21 | 9.21 | 34.13 | 3,049 | |
| NGXASEM | 1,446.38 | -9.56 | -9.56 | -9.32 | -9.32 | -8.67 | 5 | |
| NGXBNK | 1,590.09 | 7.05 | 7.05 | 5.25 | 5.25 | 46.23 | 3,356 | |
| NGXCG | 4,098.20 | 5.27 | 5.27 | 19.18 | 19.18 | 44.85 | 5,430 | |
| NGXCNSMRGDS | 2,769.66 | 1.33 | 1.33 | -20.15 | -20.15 | 59.69 | 1,273 | |
| NGXCOMMDTY | 1,062.39 | 0.19 | 0.19 | 1.45 | 1.45 | 6.24 | 654 | |
| NGXGROWTH | 10,058.88 | -0.44 | -0.44 | 5.78 | 5.78 | 29.58 | 132 | |
| NGXINDUSTR | 3,808.29 | 1.15 | 1.15 | 8.10 | 8.10 | 6.63 | 849 | |
| NGXINS | 873.81 | -2.94 | -2.94 | 18.31 | 18.31 | 11.14 | 771 | |
| NGXLOTUSISLM | 9,988.29 | 1.18 | 1.18 | 4.32 | 4.32 | 43.35 | 1,716 | |
| NGXMAINBOARD | 6,208.04 | 1.39 | 1.39 | 5.24 | 5.24 | 24.06 | 7,966 | |
| NGXMERIGRW | 9,310.00 | 3.75 | 3.75 | -3.55 | -3.55 | 42.72 | 1,373 | |
| NGXMERIVAL | 13,872.22 | 5.45 | 5.45 | 16.11 | 16.11 | 33.00 | 2,626 | |
| NGXOILGAS | 2,442.11 | -0.19 | -0.19 | 2.09 | 2.09 | -9.92 | 518 | |
| NGXPENBRD | 2,362.11 | 2.05 | 2.05 | 2.73 | 2.73 | 28.96 | 8,585 | |
| NGXPENSION | 6,584.97 | 3.51 | 3.51 | 3.62 | 3.62 | 45.23 | 6,348 | |
| NGXPREMIUM | 12,915.33 | 2.58 | 2.58 | 12.60 | 12.60 | 32.70 | 3,038 | |
| NGXSOVBND | 668.78 | -0.04 | -0.04 | 2.34 | 2.34 | 11.18 | 1 |
For more detailed analysis,
- On InfoWARE Market Data Terminal <MKTINS> <GO>
- On InfoWARE Finance Mobile App ( Android, iPhone & iPad and Windows 10) , "Market Indexes"
Find the topic interesting? Will like to comment? Contact Us at solutions@infowarelimited.com
Top News

InfoWARE AI Analyst Weekly Market Report: 18-Jul-2025
Chart Of The Day - ASI Chart Vs ASI Advance Decline Line (YTD) (18-Jul-2025 15:07:31.411)
InfoWARE AI Analyst Daily Market Report: 18-Jul-2025

[XNSA]>> CORDROS MILESTONE FUNDS' BID & OFFER PRICES
[AIRTELAFRI]>>Corporate Disclosures-<Airtel Africa Plc>
[XNSA]>> NORRENBERGER MUTUAL FUNDS WEEKLY UPDATE
[XNSA]>> NGX FIXED INCOME INDICATIVE PRICE LIST FOR JUL 18, 2025
[XNSA]>> OFF MARKET TRADE
[SIAMLETF40]>> DAILY INDICATIVE PRICES
Chart Of The Day - ASI Chart Vs ASI Advance Decline Line (YTD) (17-Jul-2025 15:23:08.892)
InfoWARE AI Analyst Daily Market Report: 17-Jul-2025
[XNSA]>> CORDROS MILESTONE FUNDS' BID & OFFER PRICES
[NEWGOLD]>> DAILY INDICATIVE PRICES
[XNSA]>> EMERGING AFRICA DAILY FUND PRICES
[VSPBONDETF]>> DAILY INDICATIVE PRICES
[AIRTELAFRI]>>Corporate Disclosures-<Airtel Africa Plc>
[MERGROWTH]>> DAILY INDICATIVE PRICES
[MECURE]>>Corporate Disclosures-<MECURE INDUSTRIES PLC>
Chart Of The Day - ASI Chart Vs ASI Advance Decline Line (YTD) (16-Jul-2025 15:07:07.613)
InfoWARE AI Analyst Daily Market Report: 16-Jul-2025
[NPFMCRFBK]>>Notice of Meeting -<NPF MICROFINANCE BANK PLC>
[NEM]>>Notice of Meeting -<NEM INSURANCE PLC.>
[XNSA]>> OFF MARKET TRADE
[AIRTELAFRI]>>Corporate Disclosures-<Airtel Africa Plc>
[AIRTELAFRI]>>Corporate Disclosures-<Airtel Africa Plc>
[PRESTIGE]>>Corporate Disclosures-<PRESTIGE ASSURANCE PLC>
[XNSA]>> POSTPONED CLOSING GONG CEREMONY IN HONOUR OF THE MAYOR OF LONDON
[STANBICETF30]>> DAILY INDICATIVE PRICES
[XNSA]>> NOTIFICATION OF PRICE ADJUSTMENT
InfoWARE AI Analyst Daily Market Report: 14-Jul-2025
Get IDIA - the stock trading app for the modern investor
Solutions by Business
Product Suites
Company
Contacts
- 8th Floor,
- South Atlantic Petroleum Towers,
- 1 Adeola Odeku Street,
- Victoria Island,
- Lagos, Nigeria.
- Email: solutions@infowarelimited.com
Follow Us
 |
 |
 |
 |