


InfoWARE AI Analyst Daily Market Report: 14-Jul-2025 | InfoWARE Finance
Get IDIA - the stock trading app for the modern investor


InfoWARE AI Analyst Daily Market Report: 14-Jul-2025
(Source: InfoWARE Terminal, Date: 14-Jul-2025)
Dear Investor,
NGX Market Summary – Monday, July 14, 2025
The Nigerian equities market kicked off the week on a positive note, with the NGX All Share Index (ASI) climbing 0.43% to 126,151.04, notching a robust 22.78% YTD return. However, beneath the index’s mild ascent, activity painted a far more subdued picture: turnover plummeted by -83.52% to just NGN 4.64 billion, and volumes slid to 273.57 million (from 1.34 billion previously). While the broader market was marginally bullish (market breadth 1.12x, advancers outpacing decliners 46 to 41), institutional and retail dynamics diverged sharply. Volume traded rose for 65 stocks but declined for 74, suggesting a shift from speculative excess toward more selective accumulation. The currency market was firmer, with the Naira appreciating by 0.20% to 1,530/USD.
Key Takeaways and Trends
-
Market Breadth & Participation:
- Advancers (46) vs. Decliners (41) yields a slightly bullish breadth (1.12x), yet the drop-off in turnover and volume is notable. This could signal cautious re-entry by institutions after prior exuberance.
- Volumes were up for 65 stocks but down for 74 – breadth looks better on price than on conviction. -
Top Gainers (%):
- GREENWETF (+10.00%): Unusual top gainer among ETFs, but RSI (19.54) is deeply oversold despite today’s bounce and huge negative YTD (-62.92% see YTD Losers table). Caution: this looks technical and not fundamental.
- ABBEYBDS (+9.99%): Trades with elevated RSI (71.89) and a tiny PE, suggesting strong momentum but nearing overbought levels. Rapid short-term run-up may attract profit-taking.
- IKEJAHOTEL (+9.95%): Surging with a very high RSI of 86.27, paired with bullish MACD. A brief overbought condition—watch for mean reversion.
- MCNICHOLS (+9.92%): Major YTD gainer (168.32%, see table below). RSI is very high at 78.74; MACD is bullish; uptrend intact, but technical correction risk is elevated.
-
Top Losers (%):
- CUTIX (-10.00%): RSI 76.88; remains overbought despite sharp drop—possible correction in prior overextended rally.
- RTBRISCOE (-10.00%): RSI 80.95; high volatility continues, with repeated spikes and dumps.
- TANTALIZER (-10.00%): Still has elevated RSI (68.25), suggesting more room to fall if sellers persist.
- CAVERTON (-10.00%): High RSI (78.16); see above on volatility—likely corrective move.
- NEIMETH (-9.95%, YTD 228.29%): Mixed signals—a negative daily and 5-day change despite ultra-strong YTD. Directional conviction is lacking; possible exhaustion.
-
Unusual Volume Stocks:
- ACCESSCORP (Volume: 138M, +157.62% over 90d avg): Flat daily move (+0.4%), but heavy institutional trading (see Market Trades section below).
- AIICO (504.96% over 90d avg): Posted +1.32% on the day; indicative of renewed institutional interest or block trading.
- JAIZBANK (739.43% over 90d avg): +0.84%; also saw intense block activity, suggesting possible accumulation.
- JAPAULGOLD & UNIVINSURE: Both saw >200% jump in volume but closed lower (-9.85% and -9.20% respectively), hinting at distribution or large-scale profit-taking.
-
YTD Top Gainers:
- MCNICHOLS (+168.32%), OMATEK (+100.0%), THOMASWY (+104.74%), REDSTAREX (+225.40%) all show RSIs above 78 (overbought); technical correction likely soon.
- NEIMETH - curious case: YTD +228.29%, but among day’s top losers (-9.95%), signaling a sharp reversal.
-
YTD Top Losers:
- GREENWETF (-62.92% YTD) is today’s top gainer (+10.00%) but remains technically weak (RSI 19.54), reinforcing this as a technical bounce.
- LEGENDINT, INTBREW, GUINEAINS, LINKASSURE, TANTALIZER, LIVESTOCK all continue weak showing, and many have bearsih 15DMA/50DMA crossovers and RSI trending lower.
-
Bullish Momentum (Closing Price Crossed Above 15DMA):
- STANBIC (+7.08%), BUACEMENT (+5.05%), SUNUASSUR (+4.20%): All show strong momentum despite market-wide volume drop. Watch for continued institutional rotation into defensive/large-cap names.
-
Bearish Momentum (Closing Price Crossed Below 15DMA):
- LINKASSURE, INTBREW, GUINEAINS, CORNERST, LIVESTOCK all show negative momentum; each is also present in the YTD losers table, confirming a sector-wide cooling in Insurance and select Consumer Goods.
-
Turnover Implications:
A sharp drop in turnover (value -83.52%) and a 5x lower market volume signals traders taking a wait-and-see approach. Accumulation is selective. Opportunities for breakout traders will hinge on large volumes returning to leading gainers and unusual volume stocks. -
Institutions vs. Retail:
- Institutions drove 63.09% of total market volume and 87.96% of total market value (despite representing just 42.34% of deals), focusing heavily on ACCESSCORP, ZENITHBANK, UBA, GTCO, FIRSTHOLDCO—blue chip banking/core financials—suggesting sector rotation or defensive allocation.
- Retail was more dispersed, favoring GTCO, ACCESSCORP, UBA, ZENITHBANK, and FTNCOCOA (see below for patterns).
Contrarian Signals
-
GREENWETF: Today's top gainer (+10%), but still among the worst YTD losers (-62.9%) and has an extremely low RSI (19.5).
Takeaway: This is more likely a ‘dead cat bounce’ than a turnaround; not confirmed by technicals. - CHAMPION (YTD 258.27%): RSI only 54.4 and recent decline of -8.4%; MACD is bullish. Looks like a pause (consolidation) in a longer-term uptrend—watch for re-accumulation by buyers.
- NEIMETH: Huge YTD run +228.29%, but top daily loser (-9.95%). Signals exhaustion—could be the start of a deeper pullback.
Sector Heatmap
| Sector | Performance | Top Movers | Technicals | Institutional Interest |
|---|---|---|---|---|
| Banking | Mildly Positive | ACCESSCORP, UBA, ZENITHBANK, GTCO | ACCESSCORP: Heavy vol, 15DMA crossover, RSI rising UBA: Top YTD, bullish MACD |
ACCESSCORP (biggest vol), ZENITHBANK (high value) |
| Insurance | Weak | AIICO, UNIVINSURE, CORNERST, GUINEAINS | GUINEAINS, LINKASSURE, CORNERST all below 15DMA, declining RSIs | AIICO (unusual vol), GUINEAINS (steady selling) |
| Consumer Goods | Negative | INTBREW, LIVESTOCK | Both below 15DMA, weak RSIs, MACD bearish | Low interest |
| ETF | Volatile Bounce | GREENWETF | RSI 19.54 (deep oversold); PE unavailable | N/A |
| Building Materials | Improving | BUACEMENT | 15DMA crossover, institutional buying | BUACEMENT gaining traction |
Sparklines/crossovers: Many blue-chip bank stocks are showing 15DMA crossovers above 50DMA (bullish), with ACCESSCORP and UBA leading the charge.
Dividend-Beta Matrix: Defensive Opportunities
| Stock | Div. Yield (%) | Beta | Quick Comment |
|---|---|---|---|
| AFRIPRUD | 1.27 | 0.64 | Low beta, steady yield—classic defensive play during volatility |
| BUACEMENT | 2.11 | 1.36 | Higher yield, moderate beta; recent bullish momentum |
| SUNUASSUR | 0.99 | 0.27 | Low beta, income flavor, but in a weak Insurance sector |
Note: Dividend payers are not heavily represented in today's bullish/bearish short-term signals. However, stocks like AFRIPRUD (high yield, low beta) offer a classic defensive hedge.
Institutional Clustering Alerts
- ZENITHBANK: Accounted for 20.17% of institutional trade value. This, along with high activity in ACCESSCORP and UBA, suggests institutional sector rotation within top banks.
- ACCESSCORP: Appears in both institutional and retail top traded lists; with heavy volume and rising price, watch for further accumulation.
YTD Top Gainers & Losers (as of July 14, 2025)
| Stock | Symbol | YTD % | 5D % | 1D % | RSI | MACD | DivYield |
|---|---|---|---|---|---|---|---|
| MCNICHOLS PLC | MCNICHOLS | 168.3% | 32.5% | 9.92% | 78.7 | 0.33 | 5.88 |
| OMATEK | OMATEK | 100.0% | 32.2% | 9.59% | 86.3 | 0.15 | 0.00 |
| THOMASWYATT | THOMASWY | 104.7% | 30.5% | 8.36% | 82.9 | 0.31 | 1.05 |
| RED STAR EXPRESS | REDSTAREX | 225.4% | 29.2% | 6.77% | 94.8 | 1.17 | 6.12 |
| UNITED BANK FOR AFRICA | UBA | 34.5% | 27.8% | 5.63% | 74.9 | 1.19 | 5.96 |
| LEGEND INTERNET | LEGENDINT | 4.4% | -19.1% | -7.57% | 44.7 | 0.00 | 0.00 |
| NEIMETH | NEIMETH | 228.3% | -17.5% | -9.95% | 75.4 | 1.54 | 3.38 |
| INTBREW | INTBREW | 145.5% | -10.3% | -9.09% | 73.9 | 1.37 | 6.23 |
| GREENWETF | GREENWETF | -62.9% | -10.0% | 10.00% | 19.5 | -51.6 | 0.00 |
| GUINEAINS | GUINEAINS | 5.6% | -9.6% | -9.6% | 65.0 | 0.10 | 1.96 |
Note: Multiple YTD gainers have RSI above 70 and are susceptible to near-term profit-taking. GREENWETF is a rare case: today's top gainer but a massive YTD loser—technical, not trend reversal.
Market Activity / Trades Summary Insights
-
Daily Institutional vs Retail Breakdown:
- Institutional: 63.09% of total volume, 87.96% of trade value but just 42.34% of deals — focusing on blue-chips, indicating high-conviction, block-style trading.
- Retail: 57.66% of trade count, 36.91% of volume, 12.04% of trade value — broad participation but lower ticket size.
- Institutional Top 5 (by value): ACCESSCORP, ZENITHBANK, UBA, GTCO, FIRSTHOLDCO – all in the banking sector and YTD leaders, highlighting sector rotation or defensive accumulation of high liquidity blue-chips.
- Retail Top 5: GTCO, ACCESSCORP, UBA, ZENITHBANK, FTNCOCOA – overlap with institutional names, but FTNCOCOA appears only in retail; high-volatility favorite for smaller traders.
- Pattern: Best-performing/YTD rising stocks (ACCESSCORP, UBA) are seeing both retail and institutional flows—a strong confirmation for their trend.
Traders’ Key Suggestions & Opportunities
- Consider locking in partial profits on stocks with RSIs above 80 (MCNICHOLS, OMATEK, IKEJAHOTEL, REDSTAREX), especially after rapid rallies.
- Bullish crossovers (e.g., STANBIC, BUACEMENT, SUNUASSUR): Watch for follow-through; use dips to accumulate or trail stops higher.
- Contrarian bounce: Tight stops for GREENWETF; today's pop isn’t trend-reversing—wait for confirmation.
- Institutional/retail overlap: Stay with ACCESSCORP, UBA for further momentum; both have confirmed support across investor classes.
- Caution: In Insurance & Consumer Goods, price under 15DMA & declining RSI signals ongoing risk-off; trims, hedges, or avoidance are recommended.
- Yield-hunting? Consider AFRIPRUD if volatility persists; not a short-term momentum play, but solid for portfolios seeking income + low beta.
- Volume spikes in AIICO, JAIZBANK, and ACCESSCORP should be watched for follow-through buying/selling in the coming sessions.
Last Week’s Recap
The previous week ended with the All Share Index consolidating after a strong run, as investor enthusiasm moderated. Multiple blue-chip banks (ACCESSCORP, UBA, ZENITHBANK) continued to attract both institutional and retail inflows, pushing their momentum further. Select high-flying industrials and insurance names rotated into profit-taking, while consumer and insurance sectors gradually trended downwards, culminating in today’s more cautious, selective trading action.
Summary
- ASI modestly higher amid sharply lower turnover (down -83.52%) — signals trader caution.
- Bullish: Top banks, building materials, selected financials (esp. under institutional accumulation).
- Bearish: Insurance & consumer goods, especially those with RSI below 30 or declining under 15DMA (LINKASSURE, GUINEAINS, LIVESTOCK).
- Opportunities: Trade liquid momentum favorites with stop-loss discipline; seek defensive yield in high-dividend, low-beta names where risk appetite wanes.
- Contrarian Signals: Don't chase technical bounces in structurally weak names; let volume and momentum confirm the trend.
- Stay nimble: Rapid winners are now overbought, and selective profit-taking is prudent. Keep eyes on institutional flows for sector leadership clues.
|
Top ASI Gainers Over Last 5 Trading Days
|
Top ASI Losers Over Last 5 Trading Days
|
For more detailed analysis, on InfoWARE Market Data Terminal <NSEPERF> <GO>
On InfoWARE Finance Mobile App (Android, iPhone & iPad, Windows Phone and Windows 8/10), "Top Gainers & Losers"
GREENWICH ASSET ETF (GREENWETF) topped the advancers list closing at N198.00 with a gain of 10.00% followed by SECURE ELECTRONIC TECHNOLOGY PLC (NSLTECH) which closed at N1.10 with a gain of 10.00%.
On the flip side CAVERTON OFFSHORE SUPPORT GRP PLC (CAVERTON) and CUTIX PLC. (CUTIX) topped the decliners log with a loss of -10.00% at a close of N7.20, and -10.00% to close the day at N4.14 respectively.
| Symbol | LClose | %Chg |
|---|---|---|
| GREENWETF | 198.00 | 10.00 |
| NSLTECH | 1.10 | 10.00 |
| ABBEYBDS | 7.60 | 9.99 |
| Ikejahotel | 22.10 | 9.95 |
| MCNICHOLS | 4.32 | 9.92 |
| Symbol | LClose | %Chg |
|---|---|---|
| CAVERTON | 7.20 | -10.00 |
| CUTIX | 4.14 | -10.00 |
| RTBRISCOE | 3.96 | -10.00 |
| TANTALIZER | 2.70 | -10.00 |
| NEIMETH | 8.24 | -9.95 |
For more detailed analysis,
- On InfoWARE Market Data Terminal <TOPG> <GO>
- On InfoWARE Finance Mobile App ( Android, iPhone & iPad and Windows 10) , "Top Gainers & Losers"
Currency Market
In the currency market, the Naira appreciated 0.20%(3.09) against the Dollar to settle at 1 to 1Investment Insights - Top 5 Gainers YTD
These stocks are the best performers whose price has risen faster than the market as a whole with the best returns year to date. Momentum investors believe that stocks that have outperformed the market will often continue to do so because the factors that caused them to outperform will not suddenly disappear. In addition, other investors seeking to benefit from the stock’s outperformance will often purchase the stock, further bidding its price higher and pushing the stock higher still
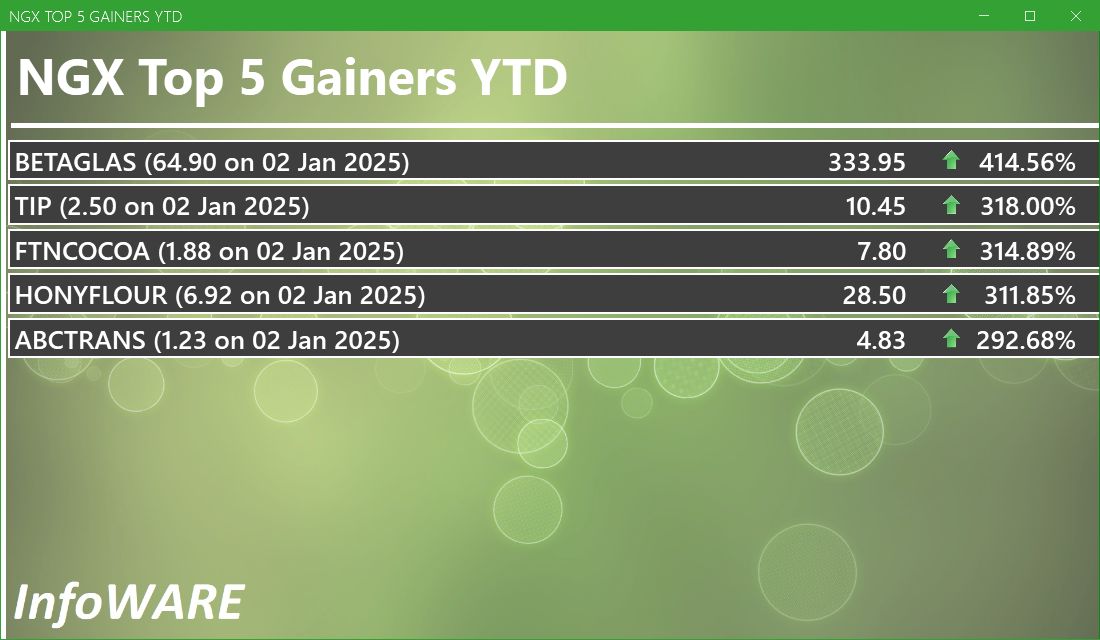
For more detailed analysis,
- On InfoWARE Market Data Terminal <T5YTD2> <GO>
- On InfoWARE Finance Mobile App ( Android , iPhone & iPad and Windows 10) , "Research"
NSE: Bull Signal - Price crossed above 15 Day MA
This signal implies these stocks are under buying pressure and the price might continue to rise and therefore positions should be monitored closely. Further suggested analysis include looking at the overall market (ASI) to see if the uptrend is market wide, sector wide or specific to the stock. Portfolio managers tend to use this as a signal to do more research to add to their positions or lock in some profits. Typically further analysis should be done using commands like PC and RV on the InfoWARE Market Data Terminal. Another command is ALERTS to set price triggers for possible exit or entry as necessary
For more detailed analysis,
- On InfoWARE Market Data Terminal <NSEPERF> <GO>
- On InfoWARE Finance Mobile App ( Android , iPhone & iPad and Windows 10) , "Top Gainers & Losers"
| Symbol | Price | %Chg | 15DMA | PE | EPS | DivY | MktCap | Vol | Trades | Value | LstTradeTime |
|---|---|---|---|---|---|---|---|---|---|---|---|
| FGS202656 | 100.00 | 40.00 | 89.33 | 0.00 | 0.00 | 252.00 | 9.00 | 251.09K | 14-Jul-2025 14:31:07.573 | ||
| STANBIC | 90.45 | 7.08 | 85.31 | 6.87 | 8.23 | 3.54 | 1,171.96B | 1.35M | 199.00 | 121.89M | 14-Jul-2025 14:30:56.877 |
| FGSUK2033S6 | 100.00 | 6.00 | 94.40 | 0.00 | 0.00 | 50.00 | 1.00 | 50.00K | 14-Jul-2025 14:31:11.890 | ||
| BUACEMENT | 99.00 | 5.05 | 95.36 | 0.00 | 0.00 | 2.11 | 3,352.57B | 1.76M | 411.00 | 173.36M | 14-Jul-2025 14:30:37.867 |
| SUNUASSUR | 5.00 | 4.20 | 4.90 | 0.00 | 0.00 | 0.99 | 29.05B | 6.39M | 140.00 | 32.37M | 14-Jul-2025 14:30:57.087 |
NSE: BEAR Signal - Price crossed below 15 Day MA
This signal implies these stocks are under selling pressure and the price might continue to slide and therefore positions should be monitored closely. Further suggested analysis include looking at the overall market (ASI) to see if the downtrend is market wide, sector wide or specific to the stock. If the overal market trend is upwards, then since these stocks are heading in the opposite direction, then further analysis should be done using commands like PC and RV on the InfoWARE Market Data Terminal. Another command is ALERTS to set price triggers for possible exit is necessar
For more detailed analysis,
- On InfoWARE Market Data Terminal <BEARM> <GO>
- On InfoWARE Finance Mobile App ( Android , iPhone & iPad and Windows 10)
| Symbol | Price | %Chg | 15DMA | PE | EPS | DivY | MktCap | Vol | Trades | Value | LstTradeTime |
|---|---|---|---|---|---|---|---|---|---|---|---|
| LINKASSURE | 1.45 | 8.28 | 1.56 | 59.89 | 0.02 | 5.56 | 20.30B | 6.76M | 125.00 | 9.70M | 14-Jul-2025 14:30:54.110 |
| MERGROWTH | 400.00 | 0.00 | 400.86 | 0.00 | 0.00 | 7.00 | 2.00 | 2.80K | 14-Jul-2025 14:34:54.387 | ||
| NGXCNSMRGDS | 2,733.27 | -1.76 | 2,750.87 | 30.19 | 55.24 | 0.00 | 0.00 | 4.71M | 1,047.00 | 114.78M | 14-Jul-2025 14:31:13.813 |
| LIVESTOCK | 9.00 | -5.56 | 9.23 | 0.00 | 0.00 | 2.94 | 27.00B | 2.27M | 226.00 | 20.95M | 14-Jul-2025 14:30:54.217 |
| CORNERST | 4.03 | -6.45 | 4.23 | 8.62 | 0.35 | 5.28 | 73.21B | 2.51M | 117.00 | 10.51M | 14-Jul-2025 14:30:38.400 |
| INTBREW | 13.50 | -10.00 | 14.39 | 0.00 | 0.00 | 6.23 | 362.64B | 4.95M | 219.00 | 69.68M | 14-Jul-2025 14:30:41.140 |
| GUINEAINS | 0.94 | -10.64 | 0.97 | 66.79 | 0.01 | 1.96 | 5.77B | 11.89M | 150.00 | 12.00M | 14-Jul-2025 14:30:40.043 |
| FGS202890 | 90.00 | -11.11 | 96.00 | 0.00 | 0.00 | 500.00 | 1.00 | 450.00K | 14-Jul-2025 14:31:10.537 |
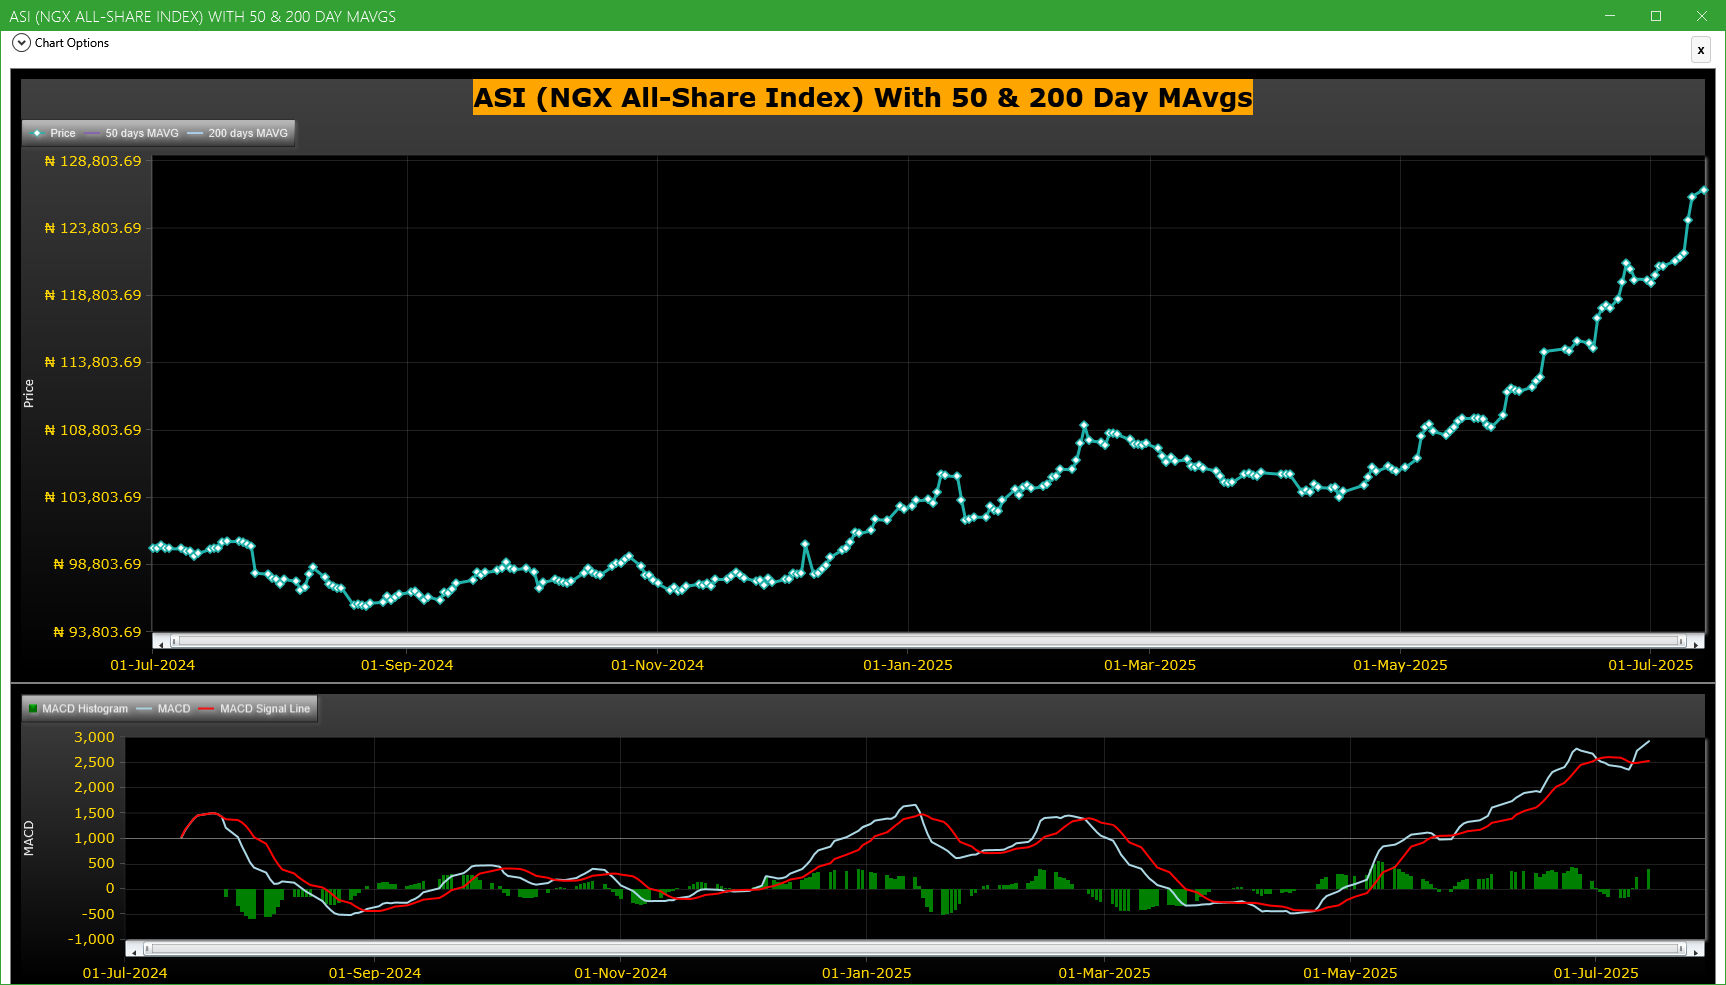
Market Trend - ASI (NGX All-Share-Index) With 50 & 200 Day MAvgs Chart
Technical traders typically use the 50 & 200 day moving averages to aid in choosing
where to enter or exit a position, which then causes these levels to act as strong
support or resistance. As a general guideline, if the price is above a moving average,
the trend is up. If the price is below a moving average, the trend is down.
It is important to note that critics of technical analysis say that moving averages act
as support and resistance because so many traders use these indicators to inform their
trading decisions. Also moving averages tend to work quite well in strong trending conditions
but poorly in choppy or ranging conditions.
Trading Strategies: Crossovers
Crossovers are one of the main moving average strategies. The first type is a price crossover,
which is when the price crosses above or below a moving average to signal a potential change
in trend. Another strategy is to apply two moving averages to a chart: one longer and one
shorter. When the shorter-term MA crosses above the longer-term MA, it is a buy signal, as
it indicates that the trend is shifting up. This is known as a golden cross. Meanwhile, when
the shorter-term MA crosses below the longer-term MA, it is a sell signal, as it indicates that
the trend is shifting down. This is known as a dead/death cross
For more detailed analysis,
- On InfoWARE Market Data Terminal <CI> <GO>
- On InfoWARE Finance Mobile App ( Android , iPhone & iPad and Windows 10) , "Research"
Unusual Volume: Volume traded is more than double the 90 day moving average (All exchanges; ASI & ASem). For more detailed analysis,
- On InfoWARE Market Data Terminal <UV> <GO>
- On InfoWARE Finance Mobile App ( Android , iPhone & iPad and Windows 10)
| Symbol | Name | Volume | 90DAvgVol | %VolChg | Price | LClose | %Chg | Trades | Value |
|---|---|---|---|---|---|---|---|---|---|
| ACCESSCORP | Access Holdings PLC | 138.03M | 53.58M | 157.62 | 24.90 | 24.80 | 0.40 | 2,578 | 3.50B |
| JAPAULGOLD | JAPAUL GOLD & VENTURES PLC | 93.37M | 29.21M | 219.67 | 3.02 | 3.35 | -9.85 | 809 | 292.93M |
| AIICO | AIICO INSURANCE PLC. | 93.36M | 15.43M | 504.96 | 2.30 | 2.27 | 1.32 | 1,076 | 220.55M |
| JAIZBANK | JAIZ BANK PLC | 59.65M | 7.11M | 739.43 | 3.60 | 3.57 | 0.84 | 578 | 231.09M |
| UNIVINSURE | UNIVERSAL INSURANCE COMPANY PLC | 55.97M | 17.64M | 217.32 | 0.79 | 0.87 | -9.20 | 406 | 47.88M |
Investment Insights - High Div. Stocks
Dividend stocks distribute a portion of the company earnings to investors on a regular basis and they can a great choice for investors looking for regular income. As an investment or trading strategy, high dividend yield equities provide annual cash payments as against mostly capital gains in the price of a stock. The list in the table below represent the highest dividend paying stocks from the list of the most liquid stocks in the NSE top 30.
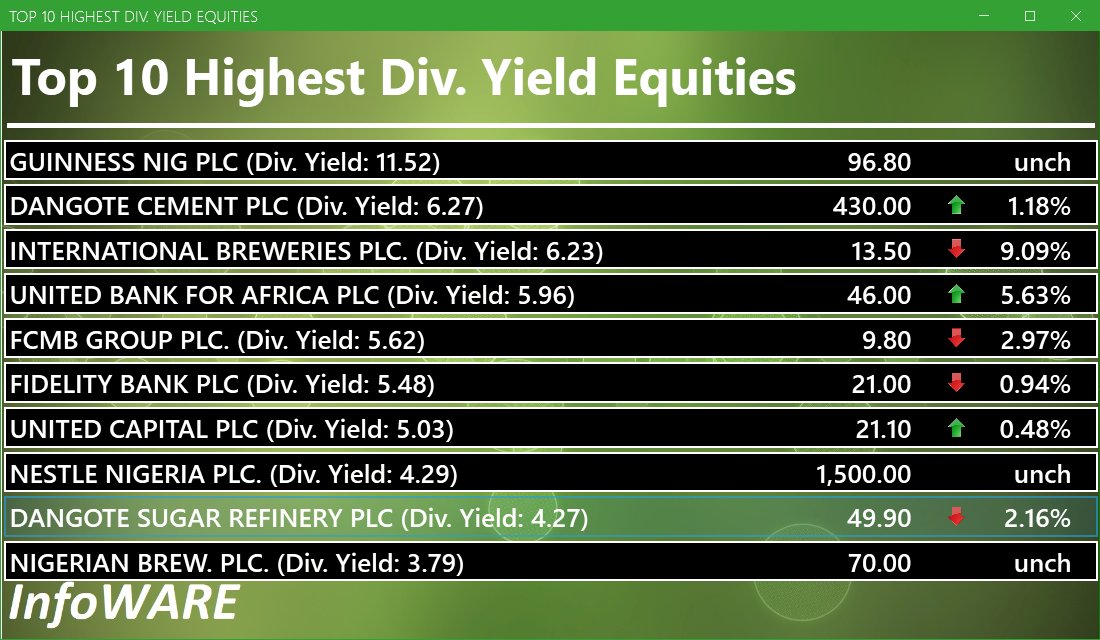
For more detailed analysis,
- On InfoWARE Market Data Terminal <HYIELD> <GO>
- On InfoWARE Finance Mobile App ( Android , iPhone & iPad and Windows 10) , "Research"
Investment Insights - Stocks outperforming the ASI but with approximately the same risk
These list of stocks represent equities that are less risky than the ASI but doing better than the ASI (All Shares Index) using the YTD (Year to Date) returns as the measure. The risk is measured by Beta. Beta is an assessment of a stock's tendency to undergo price changes, (its volatility), as well as its potential returns compared to the ASI. It is expressed as a ratio, where a score of 1 represents performance comparable to the ASI, and returns above or below the market may receive scores greater or lower than 1.
For a full list of both positively and negatively corelated stocks visit InfoWARE Market Data Terminal
- On InfoWARE Market Data Terminal <BANL> <GO>
- On InfoWARE Finance Mobile App ( Android , iPhone & iPad and Windows 10)
| Symbol | DivYield | PE | EPS | Beta | %ChgYTD | ASIYTDReturn | BetaDiff |
|---|---|---|---|---|---|---|---|
| HONYFLOUR | 1.40 | 16.28 | 0.31 | 0.99 | 311.85 | 22.78 | 0.01 |
| CAVERTON | 5.52 | 1.15 | 1.57 | 0.98 | 182.35 | 22.78 | 0.02 |
| FIDELITYBK | 5.48 | 13.24 | 1.17 | 0.89 | 23.53 | 22.78 | 0.11 |
| DEAPCAP | 13.76 | 188.84 | 0.01 | 0.89 | 32.50 | 22.78 | 0.11 |
| FTNCOCOA | 1.60 | 0.00 | 0.00 | 0.79 | 314.89 | 22.78 | 0.21 |
| NB | 3.79 | 16.95 | 1.60 | 0.79 | 118.75 | 22.78 | 0.21 |
| MAYBAKER | 3.75 | 58.94 | 0.14 | 0.78 | 80.85 | 22.78 | 0.22 |
| UNILEVER | 2.81 | 67.09 | 0.40 | 0.75 | 61.11 | 22.78 | 0.25 |
| VETGOODS | 0.00 | 0.71 | 62.50 | 22.78 | 0.29 | ||
| DAARCOMM | 0.00 | 0.00 | 0.00 | 0.71 | 30.88 | 22.78 | 0.29 |
African Markets
| Name | LClose | Change | %Chg |
|---|---|---|---|
| BRVM Stock Exchange | 305.93 | 0.55 | 0.18 |
| Botswana Stock Exchange | 10,428.27 | 0.00 | 0.00 |
| Egyptian Exchange | 33,324.38 | 172.39 | 0.52 |
| Ghana Stock Exchange | 6,424.90 | 10.26 | 0.16 |
| Johannesburg Stock Exchange | 97,221.56 | -146.05 | -0.15 |
| Lusaka Stock Exchange | 20,445.99 | 230.46 | 1.14 |
| Casablanca Stock Exchange | 18,998.71 | 158.26 | 0.84 |
| Malawi Stock Exchange | 350,875.20 | 6,440.92 | 1.87 |
| Nigeria Stock Exchange | 126,149.59 | 1,704.89 | 1.37 |
| Nairobi Securities Exchange | 159.06 | -1.20 | -0.75 |
| Namibian Stock Exchange | 1,765.87 | -29.99 | -1.67 |
| Rwanda Stock Exchange | 150.39 | -0.05 | -0.03 |
| Tunis Stock Exchange | 11,746.15 | 46.80 | 0.40 |
| Uganda Securities Exchange | 1,335.95 | 3.86 | 0.29 |
Nigeria Market Indexes
| Symbol | LClose | %Chg | WTD% | MTD% | QTD% | YTD% | MktCap | Trades |
|---|---|---|---|---|---|---|---|---|
| ASI | 126,689.54 | 0.43 | 0.00 | 5.80 | 5.80 | 22.78 | 8,955 | |
| NGX30 | 4,648.55 | 0.60 | 0.00 | -1.59 | -1.59 | 21.86 | 4,762 | |
| NGXAFRBVI | 3,537.21 | 2.28 | 0.00 | -0.18 | -0.18 | 42.58 | 2,170 | |
| NGXAFRHDYI | 22,104.82 | 0.92 | 0.00 | 5.69 | 5.69 | 29.82 | 2,581 | |
| NGXASEM | 1,599.25 | 0.00 | 0.00 | 0.26 | 0.26 | 0.98 | 4 | |
| NGXBNK | 1,485.35 | 1.88 | 0.00 | -1.68 | -1.68 | 36.59 | 2,799 | |
| NGXCG | 3,892.99 | 0.97 | 0.00 | 13.21 | 13.21 | 37.60 | 4,532 | |
| NGXCNSMRGDS | 2,733.27 | -1.73 | 0.00 | -21.20 | -21.20 | 57.60 | 1,047 | |
| NGXCOMMDTY | 1,060.33 | 0.41 | 0.00 | 1.25 | 1.25 | 6.03 | 406 | |
| NGXGROWTH | 10,103.12 | 0.84 | 0.00 | 6.24 | 6.24 | 30.15 | 57 | |
| NGXINDUSTR | 3,764.82 | 2.27 | 0.00 | 6.87 | 6.87 | 5.41 | 724 | |
| NGXINS | 900.28 | -0.42 | 0.00 | 21.89 | 21.89 | 14.51 | 769 | |
| NGXLOTUSISLM | 9,872.15 | 1.28 | 0.00 | 3.11 | 3.11 | 41.68 | 1,173 | |
| NGXMAINBOARD | 6,123.22 | 0.13 | 0.00 | 3.80 | 3.80 | 22.37 | 6,577 | |
| NGXMERIGRW | 8,973.77 | 1.79 | 0.00 | -7.03 | -7.03 | 37.57 | 1,281 | |
| NGXMERIVAL | 13,154.69 | 2.03 | 0.00 | 10.10 | 10.10 | 26.12 | 1,975 | |
| NGXOILGAS | 2,446.64 | 0.03 | 0.00 | 2.28 | 2.28 | -9.76 | 414 | |
| NGXPENBRD | 2,314.75 | 0.82 | 0.00 | 0.67 | 0.67 | 26.38 | 7,115 | |
| NGXPENSION | 6,361.52 | 0.89 | 0.00 | 0.11 | 0.11 | 40.31 | 5,057 | |
| NGXPREMIUM | 12,590.47 | 0.98 | 0.00 | 9.77 | 9.77 | 29.36 | 2,321 | |
| NGXSOVBND | 669.05 | 0.00 | 0.00 | 2.38 | 2.38 | 11.22 | 0 |
For more detailed analysis,
- On InfoWARE Market Data Terminal <MKTINS> <GO>
- On InfoWARE Finance Mobile App ( Android, iPhone & iPad and Windows 10) , "Market Indexes"
Find the topic interesting? Will like to comment? Contact Us at solutions@infowarelimited.com
Top News

Chart Of The Day - ASI Chart Vs ASI Advance Decline Line (YTD) (14-Jul-2025 15:11:06.924)
InfoWARE AI Analyst Daily Market Report: 14-Jul-2025

[MAYBAKER]>>Notice of Meeting -<MAY AND BAKER>
[ASOSAVINGS]>>Corporate Disclosures-<ASO SAVINGS AND LOANS PLC>
[VETGOODS]>> DAILY INDICATIVE PRICES
[XNSA]>> DAILY FUND PRICE SUBMISSION - FCMB ASSET MANAGEMENT LIMITED
[XNSA]>> EMERGING AFRICA DAILY FUND PRICES
[XNSA]>> CORDROS MILESTONE FUNDS' BID & OFFER PRICES
[XNSA]>> NGX FIXED INCOME INDICATIVE PRICE LIST FOR JUL 14, 2025
[AIRTELAFRI]>>Corporate Disclosures-<Airtel Africa Plc>
[AIRTELAFRI]>>Corporate Disclosures-<Airtel Africa Plc>
[GEREGU]>>Corporate Disclosures-<GEREGU POWER PLC>
[XNSA]>> CLOSING GONG CEREMONY
[CORNERST]>>Notice of Meeting -<CORNERSTONE INSURANCE PLC>
[STANBICETF30]>> DAILY INDICATIVE PRICES
[XNSA]>> NOTIFICATION OF PRICE ADJUSTMENT
[MCNICHOLS]>>Notice of Meeting -<MCNICHOLS CONSOLIDATED PLC>
InfoWARE AI Analyst Weekly Market Report: 11-Jul-2025
Chart Of The Day - ASI Chart Vs ASI Advance Decline Line (YTD) (11-Jul-2025 15:07:28.717)
InfoWARE AI Analyst Daily Market Report: 11-Jul-2025
[XNSA]>> CORDROS MILESTONE FUNDS' BID & OFFER PRICES
[VETGOODS]>> DAILY INDICATIVE PRICES
[XNSA]>> SCHEDULED MAINTENANCE ON OUR SOPHOS PLATFORM
[NEWGOLD]>> DAILY INDICATIVE PRICES
[XNSA]>> NGX FIXED INCOME INDICATIVE PRICE LIST FOR JUL 11, 2025
[XNSA]>> DAILY FUND PRICE SUBMISSION - FCMB ASSET MANAGEMENT LIMITED
[XNSA]>> CLOSING GONG CEREMONY
[SIAMLETF40]>> DAILY INDICATIVE PRICES
[MBENEFIT]>>Notice of Meeting -<MUTUAL BENEFITS ASSURANCE PLC.>
[OMATEK]>>Notice of Meeting -<OMATEK VENTURES PLC>
Get IDIA - the stock trading app for the modern investor
Solutions by Business
Product Suites
Company
Contacts
- 8th Floor,
- South Atlantic Petroleum Towers,
- 1 Adeola Odeku Street,
- Victoria Island,
- Lagos, Nigeria.
- Email: solutions@infowarelimited.com
Follow Us
 |
 |
 |
 |