


InfoWARE AI Analyst Daily Market Report: 29-Apr-2025 | InfoWARE Finance
Get IDIA - the stock trading app for the modern investor


InfoWARE AI Analyst Daily Market Report: 29-Apr-2025
(Source: InfoWARE Terminal, Date: 29-Apr-2025)
Dear Investor,
NGX Daily Market Summary – Tuesday, April 29, 2025
The NGX All Share Index (ASI) eased -0.17% to close at 106,116.18, bringing year-to-date returns to 2.67%. Despite the minor market decline, underlying activity was exceptionally robust with traded value (turnover) surging +207.76% to ₦34.43B, and volume rocketing to 712.23M shares. Market breadth remained healthy at 1.64x with 36 advancers versus 22 decliners, signaling persisting positive sentiment in several corners. Banking stocks dominated both institutional and retail activity, but select consumer and ETF names stood out among top movers. Unusual volumes and technical crossovers flag several opportunities – and risks – for active traders.
1. Key Market Breadth & Trends
- Turnover Updrift: Market turnover jumped +207.76% compared to the prior day, indicating heightened institutional participation and significant block trades driving value (despite moderate price movement).
- Advancers Outnumber Decliners: Breadth at 1.64x (36 advancers to 22 decliners). This is a positive setup with leadership concentrated in small- and mid-cap names and ETFs.
- Volume Dynamics: Trading volume up in 68 companies, down in 72 — showing select pockets of accumulation and profit-taking.
- Unusual Volumes: FIDELITYBK (+758% of 90-day avg), MTNN (+2857%!), and LIVESTOCK (+205%) – sharp institutional-driven moves observed.
2. Noteworthy Gainers & Losers (Day & YTD)
| Stock | Price | %Chg | RSI | MACD |
|---|---|---|---|---|
| VSPBONDETF | 281.00 | +11.95% | 57.45 | 7.95 |
| LEGENDINT | 8.25 | +10.00% | 0.00 | 0.00 |
| LOTUSHAL15 | 40.20 | +9.99% | 55.89 | 0.11 |
| ABCTRANS | 1.88 | +9.94% | 76.30 | 0.04 |
| CADBURY | 32.15 | +9.91% | 77.41 | 0.33 |
| Stock | Price | %Chg | RSI | MACD |
|---|---|---|---|---|
| NEWGOLD ETF | 47,500.00 | -12.04% | 60.42 | 2160 |
| LIVESTOCK | 7.72 | -9.71% | 49.03 | 0.32 |
| MULTIVERSE | 7.05 | -9.62% | 14.93 | -0.25 |
| MCNICHOLS | 1.72 | -9.47% | 78.09 | 0.05 |
| OMATEK | 0.59 | -9.23% | 51.36 | -0.02 |
| Stock | Price | %ChgYTD | RSI | DivYield |
|---|---|---|---|---|
| ETERNA | 43.85 | +97.53% | 77.29 | 0.68% |
| VITAFOAM | 47.90 | +100.42% | 94.01 | 7.03% |
| CADBURY | 29.25 | +49.53% | 77.41 | 1.88% |
| INTBREW | 8.47 | +49.09% | 92.41 | 6.23% |
| ABCTRANS | 1.71 | +52.85% | 76.30 | 2.19% |
| Stock | Price | %ChgYTD | RSI | DivYield |
|---|---|---|---|---|
| REGALINS | 0.54 | -31.25% | 43.02 | 6.52% |
| ARADEL | 448.00 | -25.08% | 4.03 | 1.72% |
| OMATEK | 0.65 | -26.25% | 51.36 | 0.00% |
| MULTIVERSE | 7.80 | -12.42% | 14.93 | 0.85% |
| TRIPPLEG | 1.79 | -20.44% | 0.51 | 5.32% |
- Reverse Fortunes: LIVESTOCK is a paradox, featuring as both a top loser today (-9.71%) and still a YTD gainer (+74%) – suggesting profit-taking post-surge and potentially overextended moves unwinding.
- Bullish Outliers: CADBURY and ABCTRANS appear on both daily and YTD gainers lists with extremely high RSI (77+), denoting possibly overbought territory but strong overall technicals.
- Bearish Extremes: ARADEL and MULTIVERSE have sub-15 RSI (4.03; 14.93), indicating aggressive selling and potentially near-term exhaustion.
3. Technical Momentum & Volume Insights
-
Overbought/Bullish: Several major YTD gainers (CADBURY, ETERNA, VITAFOAM, INTBREW) and today's gainers (ABCTRANS, MCNICHOLS) have RSI well over 70 – classic overbought signals, but with strong positive MACD and momentum.
- CADBURY: RSI 77.41, MACD up, price above both 15DMA & 50DMA – strong bullish confluence, but caution warranted for late entries.
- ABCTRANS: RSI 76.30, MACD up, sustained on momentum charts.
- Bullish 15DMA Cross & Institutional Focus: ZENITHBANK (crossed above 15DMA; PE 3.33; DivYield 2.25%; Price: 47.75) – robust institutional activity, solid EPS (₦13.30), and sector support.
- Bears Make a Stand: MTNN, OMATEK, and the NGX Growth Index all closed below 15DMA, suggesting near-term selling pressure in both large caps and growth/tech proxies.
- Unusual Volumes as a Tell: MTNN's trade volume (+2857%!) and sharp price drop (-6.46%) signal either forced selling or a major shift in institutional positioning. FIDELITYBK also stands out for exceptional volume.
4. Contrarian Signals
- MCNICHOLS: Notable as both a top loser today (-9.47%) and yet with an RSI of 78.09 (highly overbought) plus a bullish MACD. This conflicting setup warns of a liquidity event or sharp reversal.
- LIVESTOCK: Sits YTD #1 gainer (+74.27%) but is a top loser today (-9.71%), with RSI dropping to 49.03. Watch for whipsaw moves.
- ZENITHBANK: Appears with bullish price crossover but RSI remains neutral (47.15–54.40 range recently), indicating cautious institutional participation, not exuberant retail buying.
- MTNN: Down -6.46% on surreal volume, but with a still-elevated RSI 64.50. Suggests panic/forced selling into a previously overbought, still institutionally held name.
5. Sector Heatmap & Institutional/Technical Activity
| Sector | Direction | Leaders (Top Traded/Active) | Technical |
|---|---|---|---|
| Banking | Bullish | FIDELITYBK, ZENITHBANK, GTCO, UBA | ZENITHBANK 15DMA-X↑, FIDELITYBK (unusual vol), broad flows |
| Telecoms | Bearish | MTNN | MTNN below 15DMA↓, huge vol selloff |
| Food/Beverages | Bullish | CADBURY, INTBREW | Both overbought (RSI>90), momentum run |
| ETFs/Index Funds | Bullish | VSPBONDETF, LOTUSHAL15 | Strong inflows, top price movers, global beta |
| Insurance | Mixed | REGALINS, SUNUASSUR | REGALINS (high-yield, YTD loser) |
6. Dividend–Beta Matrix: Defensive Plays
| Stock | Div Yield | Beta | YTD Perf |
|---|---|---|---|
| VITAFOAM | 7.03% | 0.47 | +100.42% |
| REGALINS | 6.52% | 0.47 | -31.25% |
| UBA | 5.96% | 1.56 | +2.19% |
| FIDELITYBK | 5.48% | 0.89 | +19.12% |
| INTBREW | 6.23% | 1.04 | +49.09% |
- VITAFOAM stands out as a low-beta, high-yield find with momentum, offering attractive risk-adjusted return.
- INTBREW and FIDELITYBK also combine healthy dividend with solid price momentum, but betas are mid-range.
- REGALINS is high-yield but deeply negative YTD – caution on value traps.
7. Institutional Clustering Alerts
- Institutional money dominated trade value and volume (81% of volume, 95.5% of value!), confirming that today’s market was institutionally led.
- FIDELITYBK (Banking): Massive institutional volume (283M shares), strongly outperforming 90-day average. Also, MTNN (Telecom) saw huge institutional block trades (86.7M shares, 59% of day’s value).
- ZENITHBANK: Featured as a bullish crossover, solid dividends and sits amongst the top 5 most institutionally traded stocks, highlighting sector focus.
8. Dividend Yield & Bullish/Bearish Stock Overlaps
- VITAFOAM (high yield, low beta, and strongest YTD gainer) is in bull mode – often seen as a "defensive momentum” play.
- FIDELITYBK and UBA combine solid yields and price/volume momentum, but sector risk (banking) remains.
- REGALINS is a "yield trap” – high dividend, but falling price and negative YTD.
9. Trader Suggestions & Cautions
- Momentum/Breakout Plays: Consider profit-take or tight trailing stops in VITAFOAM, CADBURY, ABCTRANS – all in technical overbought with strong institutional momentum.
- Bounce Watch: MULTIVERSE, ARADEL have extreme low RSI (<15/5) – monitor for bottoming reversal, but avoid catching "falling knives” until stabilisation is visible.
- Volume Spikes as Triggers: FIDELITYBK, MTNN, LIVESTOCK – unusual volumes can signal trend continuation or major reversal as institutional hands shuffle.
- Yield Shield: Defensive allocations may consider VITAFOAM & FIDELITYBK, but avoid REGALINS/"trapped” high yielders unless technicals stabilise.
- Bullish Intraday Action: Banking sector and ETFs are the high activity, low-risk "carry” trades when market breadth is supportive.
10. YTD Gainers & Losers Recap (Tuesdays Highlight)
| Stock | YTD %Chg |
|---|---|
| VITAFOAM | +100.42% |
| ETERNA | +97.53% |
| ABCTRANS | +52.85% |
| CADBURY | +49.53% |
| INTBREW | +49.09% |
| Stock | YTD %Chg |
|---|---|
| REGALINS | -31.25% |
| OMATEK | -26.25% |
| ARADEL | -25.08% |
| TRIPPLEG | -20.44% |
| MULTIVERSE | -12.42% |
11. Market Activity/Trades Summary – Insights
- Retail: Contributed 88% of trades, but only 18.6% of volume and 4.5% of value – reflecting many small-ticket orders.
- Institutional: Accounted for 81% of volume and 95.6% of value – block trades, especially in banking (FIDELITYBK, ACCESSCORP, GTCO, UBA) and MTNN, drove the real market direction today.
- Top 5 Institutional Traded: FIDELITYBK, MTNN, ACCESSCORP, GTCO, UBA – aligning with volume spikes and price action.
- Top 5 Retail Traded: ACCESSCORP, GTCO, UBA, ZENITHBANK, ARADEL – more banking sector focus.
- Correlation: Stocks with the greatest value and volume (FIDELITYBK, MTNN) also show technical momentum or breakdowns; strong sector clustering (especially banks) suggests that macro/sector catalysts are driving short-term moves and these should be watched closely for follow through or mean reversion.
- Trader Edge: Watch for reversals in names where institutional volumes spike alongside technical extremes – moves may reverse faster than usual. Banking and select consumer cyclicals remain the core "hot tape” sectors.
Hidden Insights & Subtle Patterns
- ETF Action: VSPBONDETF and LOTUSHAL15 as top day gainers signals risk rotation, with investors hedging sector bets through ETFs.
- Overbought, but No Turn Yet: Exceptionally high RSI (VITAFOAM 94, INTBREW 92, CADBURY 77) on strong gainers, yet no "selling” trigger visible – power of momentum outweighing mean reversion for the moment.
- Yield "Value Trap” Warning: REGALINS’ high dividend but negative YTD flags caution. Yield-obsessed investors must check price trend before diving in.
- Bullish Retail Shift: Retail is increasingly active in ACCESSCORP and UBA, signaling broader risk appetite even as institutions steer the macro flow.
- Bounce Plays? Aradel and Multiverse at historically oversold levels; monitor for reversal patterns in coming sessions – but discipline is key.
Summary Takeaway
The NGX remains in a rotation-driven environment: Financials, select consumer plays, and ETFs lead trading, with banks at the heart of institutional clusters and most technical momentum. Overbought signals abound in major gainers, but aggressive volume and sector focus suggest momentum could yet continue. Yield-seekers should prefer low-beta, positive performance names like VITAFOAM over high-yield value traps. Contrarian traders may eye possible bounces in deeply oversold ARADEL and MULTIVERSE, but should act tactically. Extreme volumes in heavyweights like MTNN and FIDELITYBK signal major hands are at work – fade or follow accordingly.
|
Top ASI Gainers Over Last 5 Trading Days
|
Top ASI Losers Over Last 5 Trading Days
|
For more detailed analysis, on InfoWARE Market Data Terminal <NSEPERF> <GO>
On InfoWARE Finance Mobile App (Android, iPhone & iPad, Windows Phone and Windows 8/10), "Top Gainers & Losers"
VETIVA S & P NIGERIA SOVEREIGN BOND ETF (VSPBONDETF) topped the advancers list closing at N281.00 with a gain of 11.95% followed by LEGEND INTERNET PLC (LEGENDINT) which closed at N8.25 with a gain of 10.00%.
On the flip side NEWGOLD EXCHANGE TRADED FUND (ETF) (NEWGOLD) and LIVESTOCK FEEDS PLC. (LIVESTOCK) topped the decliners log with a loss of -12.04% at a close of N47,500.00, and -9.71% to close the day at N7.72 respectively.
| Symbol | LClose | %Chg |
|---|---|---|
| VSPBONDETF | 281.00 | 11.95 |
| LEGENDINT | 8.25 | 10.00 |
| LOTUSHAL15 | 40.20 | 9.99 |
| ABCTRANS | 1.88 | 9.94 |
| CADBURY | 32.15 | 9.91 |
| Symbol | LClose | %Chg |
|---|---|---|
| NEWGOLD | 47,500.00 | -12.04 |
| LIVESTOCK | 7.72 | -9.71 |
| MULTIVERSE | 7.05 | -9.62 |
| MCNICHOLS | 1.72 | -9.47 |
| OMATEK | 0.59 | -9.23 |
For more detailed analysis,
- On InfoWARE Market Data Terminal <TOPG> <GO>
- On InfoWARE Finance Mobile App ( Android, iPhone & iPad and Windows 10) , "Top Gainers & Losers"
Currency Market
In the currency market, the Naira was unchanged against the dollar at 1 to 1NSE: Bull Signal - Price crossed above 15 Day MA
This signal implies these stocks are under buying pressure and the price might continue to rise and therefore positions should be monitored closely. Further suggested analysis include looking at the overall market (ASI) to see if the uptrend is market wide, sector wide or specific to the stock. Portfolio managers tend to use this as a signal to do more research to add to their positions or lock in some profits. Typically further analysis should be done using commands like PC and RV on the InfoWARE Market Data Terminal. Another command is ALERTS to set price triggers for possible exit or entry as necessary
For more detailed analysis,
- On InfoWARE Market Data Terminal <NSEPERF> <GO>
- On InfoWARE Finance Mobile App ( Android , iPhone & iPad and Windows 10) , "Top Gainers & Losers"
| Symbol | Price | %Chg | 15DMA | PE | EPS | DivY | MktCap | Vol | Trades | Value | LstTradeTime |
|---|---|---|---|---|---|---|---|---|---|---|---|
| ZENITHBANK | 47.75 | 2.83 | 46.87 | 3.33 | 13.30 | 2.25 | 1,499.18B | 12.69M | 761.00 | 601.14M | 29-Apr-2025 14:31:05.377 |
NSE: BEAR Signal - Price crossed below 15 Day MA
This signal implies these stocks are under selling pressure and the price might continue to slide and therefore positions should be monitored closely. Further suggested analysis include looking at the overall market (ASI) to see if the downtrend is market wide, sector wide or specific to the stock. If the overal market trend is upwards, then since these stocks are heading in the opposite direction, then further analysis should be done using commands like PC and RV on the InfoWARE Market Data Terminal. Another command is ALERTS to set price triggers for possible exit is necessar
For more detailed analysis,
- On InfoWARE Market Data Terminal <BEARM> <GO>
- On InfoWARE Finance Mobile App ( Android , iPhone & iPad and Windows 10)
| Symbol | Price | %Chg | 15DMA | PE | EPS | DivY | MktCap | Vol | Trades | Value | LstTradeTime |
|---|---|---|---|---|---|---|---|---|---|---|---|
| NGXGROWTH | 7,391.66 | -0.25 | 7,405.91 | 18.83 | 0.18 | 0.00 | 0.00 | 1.75M | 125.00 | 6.31M | 29-Apr-2025 14:30:34.393 |
| NGXLOTUSISLM | 7,458.31 | -1.10 | 7,486.64 | 1,270.93 | 62.77 | 0.00 | 0.00 | 93.08M | 2,182.00 | 21.64B | 29-Apr-2025 14:30:34.480 |
| VETGRIF30 | 39.50 | -1.77 | 39.70 | 0.00 | 0.00 | 10.00 | 1.00 | 395.00 | 29-Apr-2025 14:31:00.757 | ||
| MTNN | 240.00 | -6.46 | 244.23 | 16,715.80 | 0.01 | 3.29 | 4,885.08B | 86.85M | 662.00 | 20.93B | 29-Apr-2025 14:31:05.330 |
| OMATEK | 0.59 | -10.17 | 0.60 | 6.82 | 0.10 | 0.00 | 1.74B | 1.69M | 45.00 | 1.02M | 29-Apr-2025 14:30:22.293 |
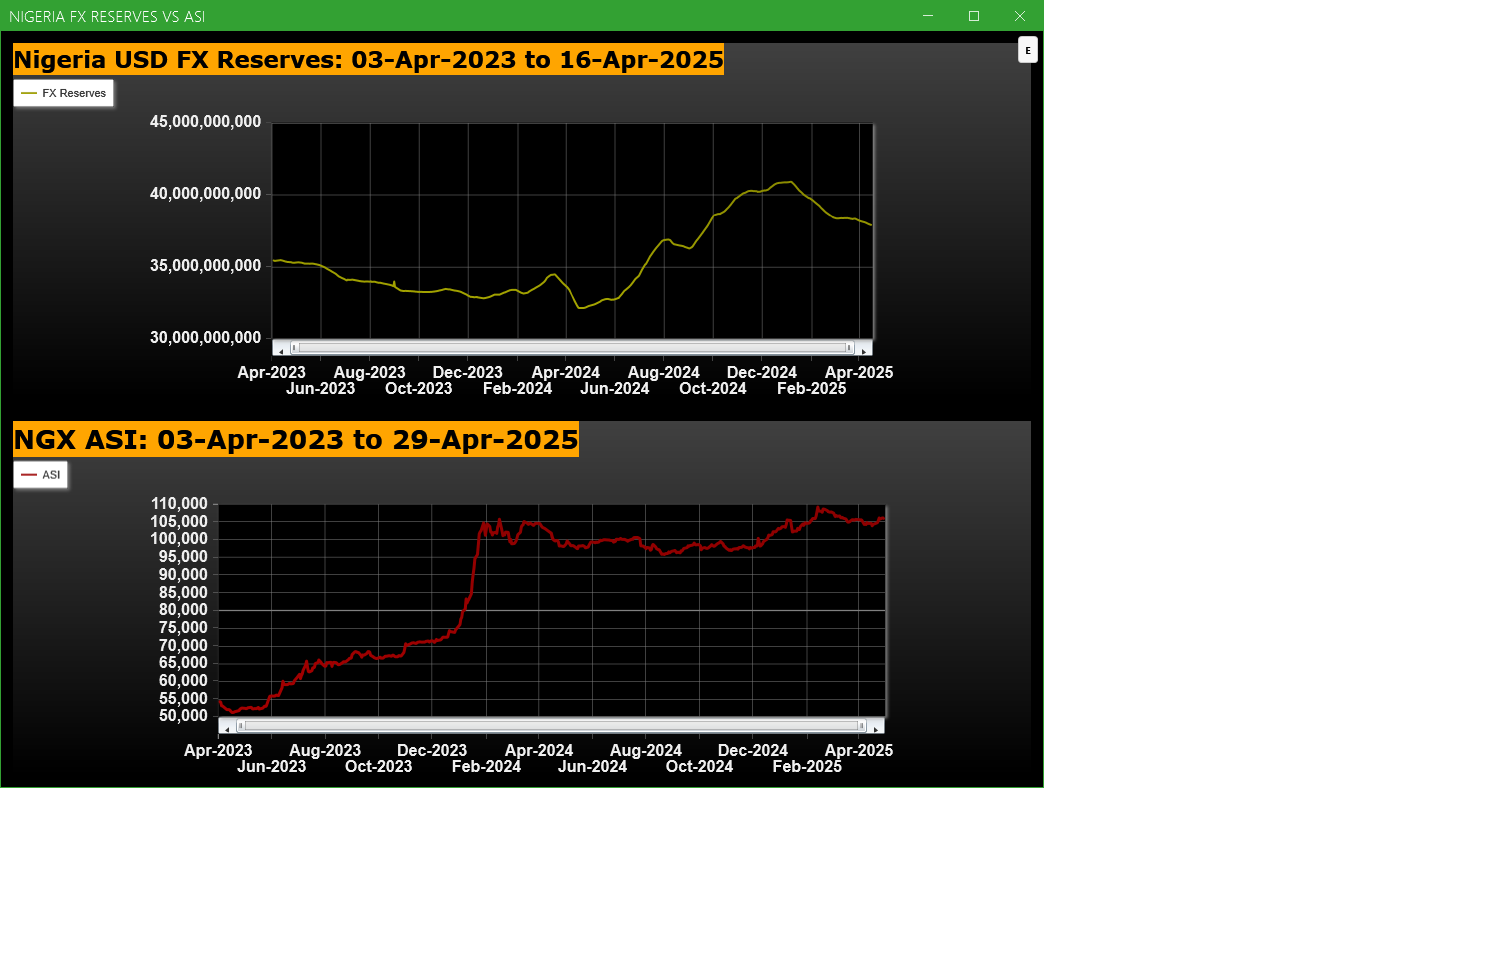
Economic Indicators - Nigeria FX Reserves Vs ASI Chart
Nigeria FX Reserves are assets held on reserve by CBN in foreign currencies. These reserves are used to back liabilities and influence monetary policy. Given the nature of the Nigeria economy, FX Reserves can appear to have an outsize influence on the economy and hence on the capital market. The chart below allows comparison of FX Reserves against the ASI to make investment decisions
For more detailed analysis,
- On InfoWARE Market Data Terminal <CI> <GO>
- On InfoWARE Finance Mobile App ( Android , iPhone & iPad and Windows 10) , "Research"
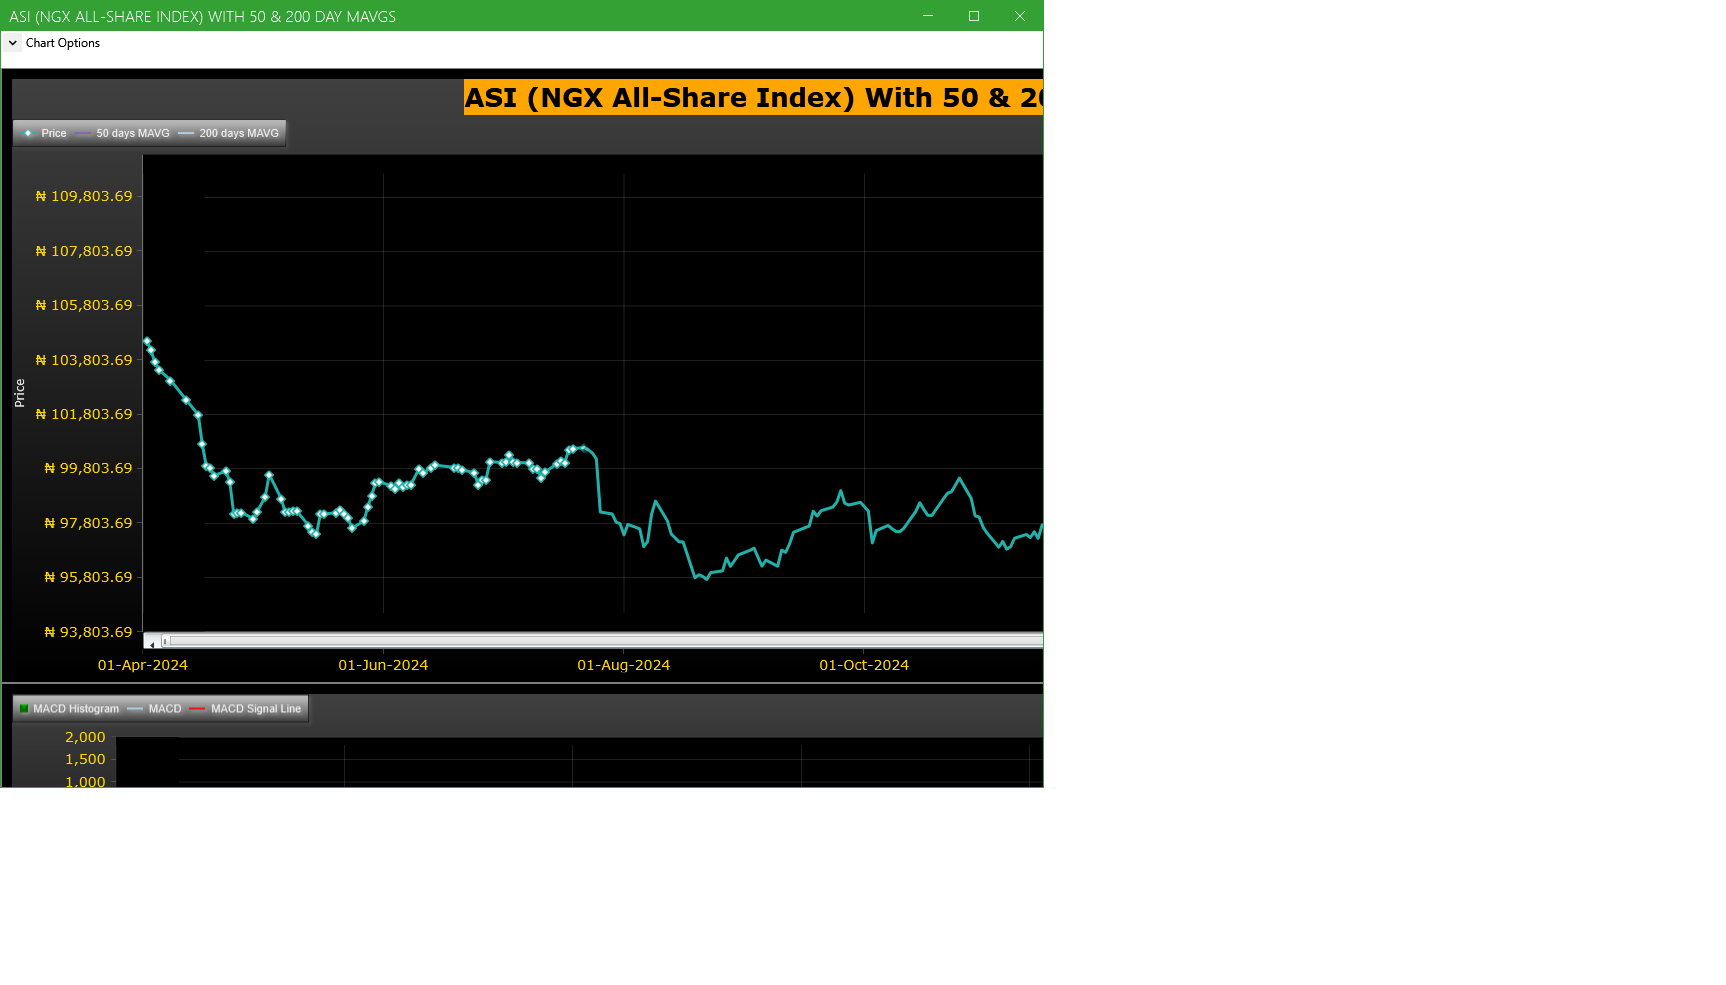
Market Trend - ASI (NGX All-Share-Index) With 50 & 200 Day MAvgs Chart
Technical traders typically use the 50 & 200 day moving averages to aid in choosing
where to enter or exit a position, which then causes these levels to act as strong
support or resistance. As a general guideline, if the price is above a moving average,
the trend is up. If the price is below a moving average, the trend is down.
It is important to note that critics of technical analysis say that moving averages act
as support and resistance because so many traders use these indicators to inform their
trading decisions. Also moving averages tend to work quite well in strong trending conditions
but poorly in choppy or ranging conditions.
Trading Strategies: Crossovers
Crossovers are one of the main moving average strategies. The first type is a price crossover,
which is when the price crosses above or below a moving average to signal a potential change
in trend. Another strategy is to apply two moving averages to a chart: one longer and one
shorter. When the shorter-term MA crosses above the longer-term MA, it is a buy signal, as
it indicates that the trend is shifting up. This is known as a golden cross. Meanwhile, when
the shorter-term MA crosses below the longer-term MA, it is a sell signal, as it indicates that
the trend is shifting down. This is known as a dead/death cross
For more detailed analysis,
- On InfoWARE Market Data Terminal <CI> <GO>
- On InfoWARE Finance Mobile App ( Android , iPhone & iPad and Windows 10) , "Research"
Unusual Volume: Volume traded is more than double the 90 day moving average (All exchanges; ASI & ASem). For more detailed analysis,
- On InfoWARE Market Data Terminal <UV> <GO>
- On InfoWARE Finance Mobile App ( Android , iPhone & iPad and Windows 10)
| Symbol | Name | Volume | 90DAvgVol | %VolChg | Price | LClose | %Chg | Trades | Value |
|---|---|---|---|---|---|---|---|---|---|
| FIDELITYBK | FIDELITY BANK PLC | 285.15M | 33.24M | 757.98 | 20.25 | 20.15 | 0.50 | 489 | 5.77B |
| MTNN | MTN NIGERIA PLC | 86.85M | 2.94M | 2,857.06 | 240.00 | 255.50 | -6.07 | 662 | 20.93B |
| LIVESTOCK | LIVESTOCK FEEDS PLC. | 13.30M | 4.37M | 204.67 | 7.72 | 8.55 | -9.71 | 338 | 104.58M |
| INTBREW | INTERNATIONAL BREWERIES PLC. | 8.44M | 2.30M | 266.66 | 8.20 | 8.47 | -3.19 | 246 | 72.72M |
| SUNUASSUR | SUNU ASSURANCES NIGERIA PLC. | 6.51M | 1.42M | 359.09 | 4.90 | 5.20 | -5.77 | 58 | 30.93M |
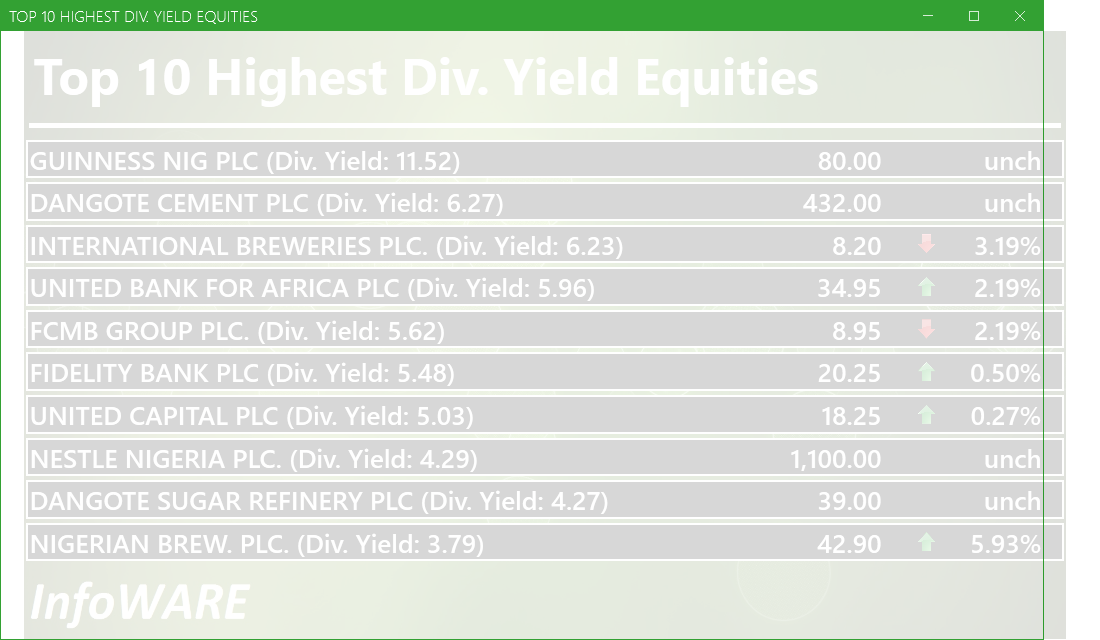
Investment Insights - High Div. Stocks
Dividend stocks distribute a portion of the company earnings to investors on a regular basis and they can a great choice for investors looking for regular income. As an investment or trading strategy, high dividend yield equities provide annual cash payments as against mostly capital gains in the price of a stock. The list in the table below represent the highest dividend paying stocks from the list of the most liquid stocks in the NSE top 30.
For more detailed analysis,
- On InfoWARE Market Data Terminal <HYIELD> <GO>
- On InfoWARE Finance Mobile App ( Android , iPhone & iPad and Windows 10) , "Research"
African Markets
| Name | LClose | Change | %Chg |
|---|---|---|---|
| BRVM Stock Exchange | 287.27 | -0.60 | -0.21 |
| Botswana Stock Exchange | 10,233.06 | 5.11 | 0.05 |
| Egyptian Exchange | 31,855.12 | 215.15 | 0.68 |
Nigeria Market Indexes
| Symbol | LClose | %Chg | WTD% | MTD% | QTD% | YTD% | MktCap | Trades |
|---|---|---|---|---|---|---|---|---|
| ASI | 105,931.18 | -0.17 | -0.18 | 0.36 | 0.36 | 2.67 | 15,212 | |
| NGX30 | 3,930.59 | -0.28 | -0.28 | 0.29 | 0.29 | 3.03 | 8,446 | |
| NGXAFRBVI | 2,652.72 | 1.84 | 1.84 | -0.39 | -0.39 | 6.93 | 3,748 | |
| NGXAFRHDYI | 17,909.32 | 1.38 | 1.38 | 7.60 | 7.60 | 5.18 | 3,720 | |
| NGXASEM | 1,591.68 | 0.00 | 0.00 | 0.24 | 0.24 | 0.50 | 1 | |
| NGXBNK | 1,159.23 | 1.30 | 1.30 | -0.14 | -0.14 | 6.60 | 3,925 | |
| NGXCG | 3,038.00 | 0.52 | 0.51 | 0.92 | 0.92 | 7.38 | 8,315 | |
| NGXCNSMRGDS | 2,045.51 | 0.48 | 0.48 | 12.66 | 12.66 | 17.94 | 1,864 | |
| NGXCOMMDTY | 985.67 | 0.00 | 0.00 | -1.78 | -1.78 | -1.44 | ||
| NGXGROWTH | 7,391.66 | -0.25 | -0.25 | 0.00 | 0.00 | -4.78 | 125 | |
| NGXINDUSTR | 3,364.30 | 0.00 | 0.00 | -3.60 | -3.60 | -5.80 | 1,069 | |
| NGXINS | 668.16 | 0.53 | -0.54 | -1.78 | -1.78 | -15.01 | 1,148 | |
| NGXLOTUSISLM | 7,458.31 | -1.08 | -1.08 | -1.27 | -1.27 | 7.04 | 2,182 | |
| NGXMAINBOARD | 5,188.91 | 0.25 | 0.24 | 2.52 | 2.52 | 3.70 | 10,942 | |
| NGXMERIGRW | 7,316.32 | -0.02 | -0.02 | 6.65 | 6.65 | 12.16 | 1,760 | |
| NGXMERIVAL | 10,696.84 | 1.38 | 1.38 | 3.92 | 3.92 | 2.55 | 4,630 | |
| NGXOILGAS | 2,353.73 | 0.09 | 0.09 | -3.80 | -3.80 | -13.18 | 489 | |
| NGXPENBRD | 1,900.07 | -0.14 | -0.14 | 0.60 | 0.60 | 3.74 | 12,254 | |
| NGXPENSION | 4,948.31 | 0.29 | 0.29 | 3.38 | 3.38 | 9.14 | 9,348 | |
| NGXPREMIUM | 9,922.30 | -1.00 | -1.00 | -2.39 | -2.39 | 1.95 | 4,145 | |
| NGXSOVBND | 651.24 | 0.00 | 0.00 | 3.89 | 3.89 | 8.26 | 0 |
For more detailed analysis,
- On InfoWARE Market Data Terminal <MKTINS> <GO>
- On InfoWARE Finance Mobile App ( Android, iPhone & iPad and Windows 10) , "Market Indexes"
Find the topic interesting? Will like to comment? Contact Us at solutions@infowarelimited.com
Top News

Chart Of The Day - ASI Chart Vs ASI Advance Decline Line (YTD) (29-Apr-2025 15:06:46.508)
InfoWARE AI Analyst Daily Market Report: 29-Apr-2025

[VITAFOAM]>>Corporate Disclosures-<VITAFOAM NIG PLC.>
Breaking News! Unusual Volume Alert (29-Apr-2025 14:21:09.830)
Breaking News! Bulls Momentum Alert (29-Apr-2025 14:21:07.065)
Breaking News! Bears Momentum Alert (29-Apr-2025 14:21:06.926)
[UBA]>>Corporate Disclosures-<UNITED BANK FOR AFRICA PLC>
[UCAP]>>Corporate Disclosures-<UNITED CAPITAL PLC>
[XNSA]>> CORDROS MILESTONE FUNDS' BID & OFFER PRICES
[XNSA]>> CLOSING GONG CEREMONY IN HONOUR OF DR. PASCAL G DOZIE, OON, CON
[LOTUSHAL15]>> DAILY INDICATIVE PRICES
[VETBANK]>> DAILY INDICATIVE PRICES
[XNSA]>> NGX FIXED INCOME INDICATIVE PRICE LIST FOR APR 29, 2025
[XNSA]>> EMERGING AFRICA DAILY MUTUAL FUND PRICES
[STANBICETF30]>> DAILY INDICATIVE PRICES
[XNSA]>> WEMA BANK PLC: ACTIVATION OF CODE FOR TRADING IN RIGHTS
CSL Nigeria Daily - 29 April 2025

CardinalStone Research | Q1'25 | Earnings Updates | SEPLAT | ARADEL | FIDSON
Market Summary 28-04-2025
[NEWGOLD]>> DAILY INDICATIVE PRICES
[SIAMLETF40]>> DAILY INDICATIVE PRICES
[RONCHESS]>>Corporate Disclosures-<RONCHESS GLOBAL RESOURCES PLC>
[RONCHESS]>>Corporate Disclosures-<RONCHESS GLOBAL RESOURCES PLC>

Afrinvest Stock Recommendation | "BUY" ACCESSCORP... "HOLD" on WAPCO
Corporate Actions | ZENITH, FCMB, and FIDELITY Payment is This Week!
Weekly Update on NT-Bills [20.51% down 19bps] and FGN Bond [18.60%]
CSL Nigeria Weekly Update
CardinalStone Company Update - Guaranty Trust Holdings Plc - Balance sheet optimization to drive quality earnings
CardinalStone Research Model Equity Portfolio - 28 April 2025

MARKET PERFORMANCE REPORT & DAILY PRICE LIST
Get IDIA - the stock trading app for the modern investor
Solutions by Business
Product Suites
Company
Contacts
- 8th Floor,
- South Atlantic Petroleum Towers,
- 1 Adeola Odeku Street,
- Victoria Island,
- Lagos, Nigeria.
- Email: solutions@infowarelimited.com
Follow Us
 |
 |
 |
 |