


InfoWARE AI Analyst Daily Market Report: 17-Jun-2025 | InfoWARE Finance
Get IDIA - the stock trading app for the modern investor


InfoWARE AI Analyst Daily Market Report: 17-Jun-2025
(Source: InfoWARE Terminal, Date: 17-Jun-2025)
Dear Investor,
NGX Daily Market Summary – Tuesday, June 17, 2025
Nigeria’s equities market experienced a modest retreat today as the NGX All Share Index (ASI) shed -0.30% to close at 115,258.77. Despite the dip, year-to-date returns remain positive at 11.37%. Turnover jumped sharply by 15.34% to ₦24.08bn, and traded volume climbed to 757.19m shares, up from yesterday. Market breadth was soft at 0.79x, with 30 advancers and 38 decliners—reflecting consolidation following recent strong upward moves. Notably, we saw robust institutional participation, major spikes in volume for select banking stocks, and some technical signals hinting at evolving sectoral rotation and possible contrarian plays.
Market Trends & Breadth
- Turnover Strength: Turnover rose +15.34% indicating renewed institutional risk appetite, yet price action points to mild profit-taking.
- Breadth Weakening: 30 advancers versus 38 decliners keeps breadth at 0.79x, suggesting recent bullishness is maturing or pausing.
- Volume Surge: Trading volume increased on a down day (bearish divergence), typically a caution flag—especially as 62 stocks saw higher volumes, but a greater number (74) witnessed volume contraction.
Top Gainers & Losers (One-day Performance)
| Top Gainers | %Chg | Insights |
|---|---|---|
| LEARN AFRICA PLC (LEARNAFRCA) | +10.00% | Crossed above 15DMA; RSI at 42.8 (no overbought sign yet); 8.53% dividend yield offers compelling total return for defensives. |
| MUTUAL BENEFITS ASSURANCE PLC. (MBENEFIT) | +10.00% | Sustained rally; Beta 1.27 (high risk); Recent bullish cross above 15DMA; RSI at mid-50s gives upside room. |
| C & I LEASING PLC (CILEASING) | +10.00% | Crossed above 15DMA signals fresh momentum; but RSI has dropped from 63.6 to 47.9—watch for swing volatility. |
| UNIVERSITY PRESS PLC. (UPL) | +9.82% | MACD positive; price extended above both 15DMA and 50DMA; room for further gains. |
| NEWGOLD EXCHANGE TRADED FUND | +9.23% | Further ETF inflows; momentum as safe-haven play on recent equity volatility. |
| Top Losers | %Chg | Insights |
| VETIVA S & P NIGERIA SOVEREIGN BOND ETF (VSPBONDETF) | -20.51% | Liquidation event? Massive discount to 15DMA. ETF sector showing cross-asset volatility. |
| TRANSCORP POWER PLC (TRANSPOWER) | -9.98% | Extremely low RSI (0.99); bears in control, extended oversold territory—possible dead-cat bounce soon. |
| OANDO PLC | -9.97% | RSI 70: Technically still overbought despite sharp selloff—a sell climax? Contrarian watchlist. |
| ELLAH LAKES PLC. | -9.87% | RSI 83.7: Volatile with persistent retail churn; sharp drop on high volume — extreme overbought unwinding. |
| OMATEK VENTURES PLC. | -9.33% | Broke below 15DMA; accelerated selling, but not in oversold RSI territory yet (RSI 54). |
Key Insights & Predictions
- Turnover Increase: +15.34% jump in turnover with a falling ASI reflects aggressive profit-taking by institutions, but also a potential sector rotation under the surface. Banks dominated with up to 72% of the volume.
- Advancers vs Decliners: More decliners indicate consolidation or a maturing rally. Short-term swings (momentum shifts) likely in coming sessions.
-
Unusual Volumes: ZENITHBANK, GTCO, ETI, ELLAHLAKES showed volumes exceeding 2x–30x 90-day average:
- ZENITHBANK: 4x usual volume, but price -2.02%. Heavy institutional activity (over 15% of all institutional trade values!), potential for near-term volatility or short covering.
- ETI: 31x daily average, moderate price gain. Strong bid under the surface.
- ELLAHLAKES: 6x volume yet heavily sold off, raising the specter of forced liquidations or event-driven trade.
- Momentum Overlaps: LEARNAFRCA, MBENEFIT, CILEASING, and NEWGOLD are dominant across daily gainers and bullish momentum lists: cross-confirmed upward bias—and LEARNAFRCA stands out with its high dividend yield (8.53%).
- Bearish Momentum: OMATEK & VSPBONDETF were on both the daily and YTD losers lists and triggered bearish 15DMA cross-downs; OMATEK volume surge points to possible capitulation.
- Banking Sector: Notable that UBA, ACCESSCORP, and ZENITHBANK are among YTD laggards, experienced high volumes, and were institutionally traded today—rotation or bottom-fishing candidates as RSI levels approach oversold.
- Contrasts in RSI: Multiple stocks (ELLAHLAKES, OANDO) are technically overbought on RSI, yet down sharply today—risk of further mean reversion.
Contrarian Signals
- OANDO: -9.97% today, still overbought on RSI 70.0. Typically stocks with high RSI and heavy selling can see further sharp moves as herd unwinds. Watch for bounce once RSI falls sub-60.
- ELLAHLAKES: Collapsed nearly -10%, but RSI at 83.7 (historically rare). Buyers beware: "overbought" can get more overbought, but capitulation could trigger short, sharp reversals.
- ZENITHBANK: Huge institutional flows, outsized volume, but price down. Previous similar events often prelude sharp reversals or further downside—especially now that RSI (40.3) is nearing oversold.
- TRANSPOWER: RSI of 0.99 (extreme), consecutive YTD and daily loser—death spiral or the bottom?
Year-To-Date Top Gainers and Losers
| Top 5 YTD Gainers | ||||||||
|---|---|---|---|---|---|---|---|---|
| Stock | Price | YTD% | 5D% | 1D% | RSI | Dividend Yield | Beta | Sector |
| FIDSON HEALTHCARE PLC | 42.10 | 183.17 | 16.15 | 5.94 | 98.4 | 4.14 | 0.25 | Healthcare |
| ABBEY BUILDING SOCIETY PLC | 5.90 | 96.67 | 7.27 | 0.00 | 39.4 | 1.43 | 0.70 | Finance |
| NEWGOLD EXCHANGE TRADED FUND (ETF) | 52,000 | 95.17 | 6.17 | 9.23 | 46.0 | 0.00 | 0.23 | ETF |
| SKYWAY AVIATION HANDLING COMPANY PLC | 58.40 | 88.34 | 7.88 | 7.88 | 48.3 | 1.15 | 0.04 | Transport |
| LIVINGTRUST MORTGAGE BANK PLC | 5.72 | 41.55 | 8.39 | 8.39 | 100.0 | 1.67 | 0.00 | Mortgage |
| Top 5 YTD Losers | ||||||||
| REGALINS | 0.60 | -27.50 | -10.77 | -3.33 | 46.2 | 6.52 | 0.47 | Insurance |
| ACCESSCORP | 20.50 | -16.81 | -10.29 | -2.20 | 37.4 | 1.87 | 1.42 | Banking |
| OMATEK | 0.75 | -15.00 | -13.92 | -9.33 | 54.0 | 0.00 | 0.52 | Computers |
| STERLINGNG | 5.50 | -13.72 | -12.98 | -8.55 | 44.2 | 3.19 | 1.40 | Banking |
| OANDO | 64.70 | -11.47 | -15.58 | -9.97 | 70.0 | 1.15 | 1.12 | Oil & Gas |
Sector Heatmap & Institutional/Retail Activity
| Sector | Key Movers | Today's Perf. | Inst. Flow | Retail Flow | Trend (Tech/RSI) |
|---|---|---|---|---|---|
| Banking | ZENITHBANK, GTCO, ETI, UBA, ACCESSCORP | Mostly negative | 72.6% volume | 27.4% volume | Mixed/Weakening (ZENITH & UBA RSI near oversold, GTCO rising) |
| Insurance | MBENEFIT, AIICO, PRESTIGE | Strong | Modest | Active | Bullish (PRESTIGE, MBENEFIT above 15DMA) |
| ETFs | NEWGOLD, VSPBONDETF, VETGRIF30 | Volatile | Spikes | Mixed | NEWGOLD bullish; VSPBONDETF breakdown |
| Agriculture | ELLAHLAKES | Heavy selloff | Sporadic | High | Overbought RSI, risk of reversal |
| Other Financials | LIVINGTRUST | Strong gains | Low | Retail-led | Momentum intact (RSI 100) |
Dividend-Beta Matrix (Defensive Screen)
| Stock | Dividend Yield | Beta | Momentum Status | Commentary |
|---|---|---|---|---|
| LEARNAFRCA | 8.53% | 0.03 | Bullish | Low risk, high yield, bullish momentum—portfolio defensive play |
| REGALINS | 6.52% | 0.47 | Bearish | Defensive yield but in persistent downtrend; monitor price reversal |
| FIDSON | 4.14% | 0.25 | Bullish (overbought RSI) | Strong YTD, yield kicker—could invite profit-taking soon |
| CORNERST (Insurance) | 5.28% | 0.93 | Bullish | Above 15DMA, modest beta—income and price upside |
| NAHCO | 6.66% | 0.65 | Flat | High-yield, moderate volatility; sector stability |
Institutional Clustering Alerts
- ZENITHBANK: Represented 15.7% of institutional trade values—clustering activity. Heavy block trades often precede sharp moves; either supply overhang or position accumulation.
- GTCO: Over 10% of inst vol and nearly 24% by value. Unusual surge hints at large repositioning or index buy/sell.
- UBA: 7.5% of institutional volume, negative bias—rotation or "catching the falling knife" attempt.
- ELLAHLAKES: Spiked on retail flows (6x normal volume)—potential for further wild swings if forced selling persists.
Dividend Yield in Bull/Bear Stocks
- LEARNAFRCA: High dividend (8.53%), in bullish group above 15DMA—attractive for conservative income-seekers.
- REGALINS: 6.52% yield appears in YTD losers and bearish group; yield may be "trapped" unless price stabilizes.
- NAHCO: Defensive yield, but trend has turned sideways—ideal for income portfolios bracing for volatility.
Opportunities and Cautions for Traders
- Momentum Players: Consider partial profits on FIDSON (overheated RSI), but trail stops to capture any continued trend. Watch LEARNAFRCA for defensive income plus bullish crossover.
- Contrarian Watch: OANDO and ELLAHLAKES—sharp drops but still overbought. Wait for RSI to normalize before bottom-fishing.
- High-Volume Names: ZENITHBANK and GTCO—watch for snapback rallies. Large block trades signal big money moving the needle.
- Bearish Spots: OMATEK, VSPBONDETF—heavy volume breakdown. Avoid new buys until signs of basing or reversal.
- Defensive Seekers: LEARNAFRCA (low beta, high yield) and CORNERST—good for "sleep-better-at-night” portfolios in choppy markets.
Market Activity Deep-Dive
-
Institutional vs Retail:
- Institutions accounted for 36.5% of trade count but a dominant 72.6% of volume and 91.2% of value, showing that big moves today were driven by large fund managers—especially in the banks.
- Retail remains the majority by deal count (63.5%), but focused more on small-caps and low-value trades; activity was highest on ELLAHLAKES and penny financials.
-
Top 5 Most Traded Symbols:
- Institutional: ZENITHBANK, UBA, ACCESSCORP, GTCO, NAHCO — all large-caps, predominantly banking sector, suggests sector-wide reallocation.
- Retail: ZENITHBANK, ACCESSCORP, UBA, ELLAHLAKES, GTCO — with ELLAHLAKES reflecting high retail churn and speculation today.
-
Hidden Correlations:
- ZENITHBANK and GTCO overlap across both institutional and retail lists; price action dislocated from volume, indicating underlying positioning or expectation of event/catalyst.
- ELLAHLAKES features only in retail—high risk of sharp price swings due to lack of institutional "support".
Bottom Line
- Bullish momentum persists in select defensives and insurance, while institutionals are busy rotating through beaten-down banks and large-caps—opportunities for nimble swing trades as technicals begin to reset.
- Volume signals point to coming volatility in the main banking names; monitor closely for reversals or extensions.
- Caution: Overbought stocks with declining prices (OANDO, ELLAHLAKES) can present classic "trap" scenarios—due diligence is key.
- Yield shields (LEARNAFRCA, REGALINS, CORNERST) attract in uncertain tapes; best combined with technical confirmation for entry.
- Contrarian Watch: Extreme RSI (sub-20 or above 80) stocks like TRANSPOWER may become "snapback rally" candidates.
|
Top ASI Gainers Over Last 5 Trading Days
|
Top ASI Losers Over Last 5 Trading Days
|
For more detailed analysis, on InfoWARE Market Data Terminal <NSEPERF> <GO>
On InfoWARE Finance Mobile App (Android, iPhone & iPad, Windows Phone and Windows 8/10), "Top Gainers & Losers"
LEARN AFRICA PLC (LEARNAFRCA) topped the advancers list closing at N4.18 with a gain of 10.00% followed by C & I LEASING PLC. (CILEASING) which closed at N4.62 with a gain of 10.00%.
On the flip side VETIVA S & P NIGERIA SOVEREIGN BOND ETF (VSPBONDETF) and TRANSCORP POWER PLC (TRANSPOWER) topped the decliners log with a loss of -20.51% at a close of N310.00, and -9.98% to close the day at N295.70 respectively.
| Symbol | LClose | %Chg |
|---|---|---|
| LEARNAFRCA | 4.18 | 10.00 |
| CILEASING | 4.62 | 10.00 |
| MBENEFIT | 1.10 | 10.00 |
| UPL | 5.48 | 9.82 |
| NEWGOLD | 56,800.00 | 9.23 |
| Symbol | LClose | %Chg |
|---|---|---|
| VSPBONDETF | 310.00 | -20.51 |
| TRANSPOWER | 295.70 | -9.98 |
| OANDO | 58.25 | -9.97 |
| ELLAHLAKES | 4.29 | -9.87 |
| OMATEK | 0.68 | -9.33 |
For more detailed analysis,
- On InfoWARE Market Data Terminal <TOPG> <GO>
- On InfoWARE Finance Mobile App ( Android, iPhone & iPad and Windows 10) , "Top Gainers & Losers"
Currency Market
In the currency market, the Naira was unchanged against the dollar at 1 to 1NSE: Bull Signal - Price crossed above 15 Day MA
This signal implies these stocks are under buying pressure and the price might continue to rise and therefore positions should be monitored closely. Further suggested analysis include looking at the overall market (ASI) to see if the uptrend is market wide, sector wide or specific to the stock. Portfolio managers tend to use this as a signal to do more research to add to their positions or lock in some profits. Typically further analysis should be done using commands like PC and RV on the InfoWARE Market Data Terminal. Another command is ALERTS to set price triggers for possible exit or entry as necessary
For more detailed analysis,
- On InfoWARE Market Data Terminal <NSEPERF> <GO>
- On InfoWARE Finance Mobile App ( Android , iPhone & iPad and Windows 10) , "Top Gainers & Losers"
| Symbol | Price | %Chg | 15DMA | PE | EPS | DivY | MktCap | Vol | Trades | Value | LstTradeTime |
|---|---|---|---|---|---|---|---|---|---|---|---|
| FGSUK2032S5 | 114.00 | 21.01 | 104.94 | 0.00 | 0.00 | 44.00 | 2.00 | 50.16K | 17-Jun-2025 14:31:31.720 | ||
| FGSUK2031S4 | 93.94 | 9.52 | 85.51 | 0.00 | 0.00 | 698.00 | 2.00 | 655.70K | 17-Jun-2025 14:31:31.637 | ||
| CILEASING | 4.62 | 9.09 | 4.43 | 6.50 | 0.64 | 1.20 | 3.61B | 2.92M | 71.00 | 13.00M | 17-Jun-2025 14:31:03.383 |
| LEARNAFRCA | 4.18 | 9.09 | 4.10 | 5.79 | 0.51 | 8.53 | 3.22B | 826.59K | 49.00 | 3.45M | 17-Jun-2025 14:31:12.543 |
| MBENEFIT | 1.10 | 9.09 | 1.05 | 5.43 | 0.11 | 3.28 | 22.07B | 3.31M | 51.00 | 3.43M | 17-Jun-2025 14:32:50.620 |
| NEWGOLD | 56,800.00 | 8.45 | 55,946.67 | 0.00 | 0.00 | 0.00 | 0.00 | 2.00 | 2.00 | 114.30K | 17-Jun-2025 14:32:51.350 |
| SKYAVN | 63.00 | 7.30 | 60.53 | 153.23 | 0.17 | 1.15 | 85.28B | 216.62K | 41.00 | 13.52M | 17-Jun-2025 14:31:13.343 |
| PRESTIGE | 1.05 | 6.67 | 1.00 | 10.49 | 0.08 | 2.50 | 13.92B | 6.16M | 61.00 | 6.01M | 17-Jun-2025 14:31:13.197 |
| UPDC | 3.09 | 4.53 | 3.02 | 0.00 | 0.00 | 34.25 | 57.35B | 2.33M | 101.00 | 7.13M | 17-Jun-2025 14:31:14.553 |
| AIICO | 1.64 | 3.66 | 1.61 | 2.01 | 0.60 | 4.13 | 60.03B | 16.22M | 268.00 | 26.25M | 17-Jun-2025 14:30:55.327 |
NSE: BEAR Signal - Price crossed below 15 Day MA
This signal implies these stocks are under selling pressure and the price might continue to slide and therefore positions should be monitored closely. Further suggested analysis include looking at the overall market (ASI) to see if the downtrend is market wide, sector wide or specific to the stock. If the overal market trend is upwards, then since these stocks are heading in the opposite direction, then further analysis should be done using commands like PC and RV on the InfoWARE Market Data Terminal. Another command is ALERTS to set price triggers for possible exit is necessar
For more detailed analysis,
- On InfoWARE Market Data Terminal <BEARM> <GO>
- On InfoWARE Finance Mobile App ( Android , iPhone & iPad and Windows 10)
| Symbol | Price | %Chg | 15DMA | PE | EPS | DivY | MktCap | Vol | Trades | Value | LstTradeTime |
|---|---|---|---|---|---|---|---|---|---|---|---|
| JAPAULGOLD | 1.98 | -1.01 | 1.99 | 0.19 | 12.01 | 0.90 | 12.40B | 5.55M | 117.00 | 11.08M | 17-Jun-2025 14:31:11.793 |
| VETGRIF30 | 40.20 | -1.99 | 40.21 | 0.00 | 0.00 | 213.00 | 4.00 | 8.57K | 17-Jun-2025 14:32:51.547 | ||
| OMATEK | 0.68 | -10.29 | 0.75 | 6.82 | 0.10 | 0.00 | 2.00B | 4.86M | 54.00 | 3.38M | 17-Jun-2025 14:31:13.133 |
| VSPBONDETF | 310.00 | -25.81 | 312.92 | 0.00 | 0.00 | 116.00 | 4.00 | 37.46K | 17-Jun-2025 14:32:51.657 |
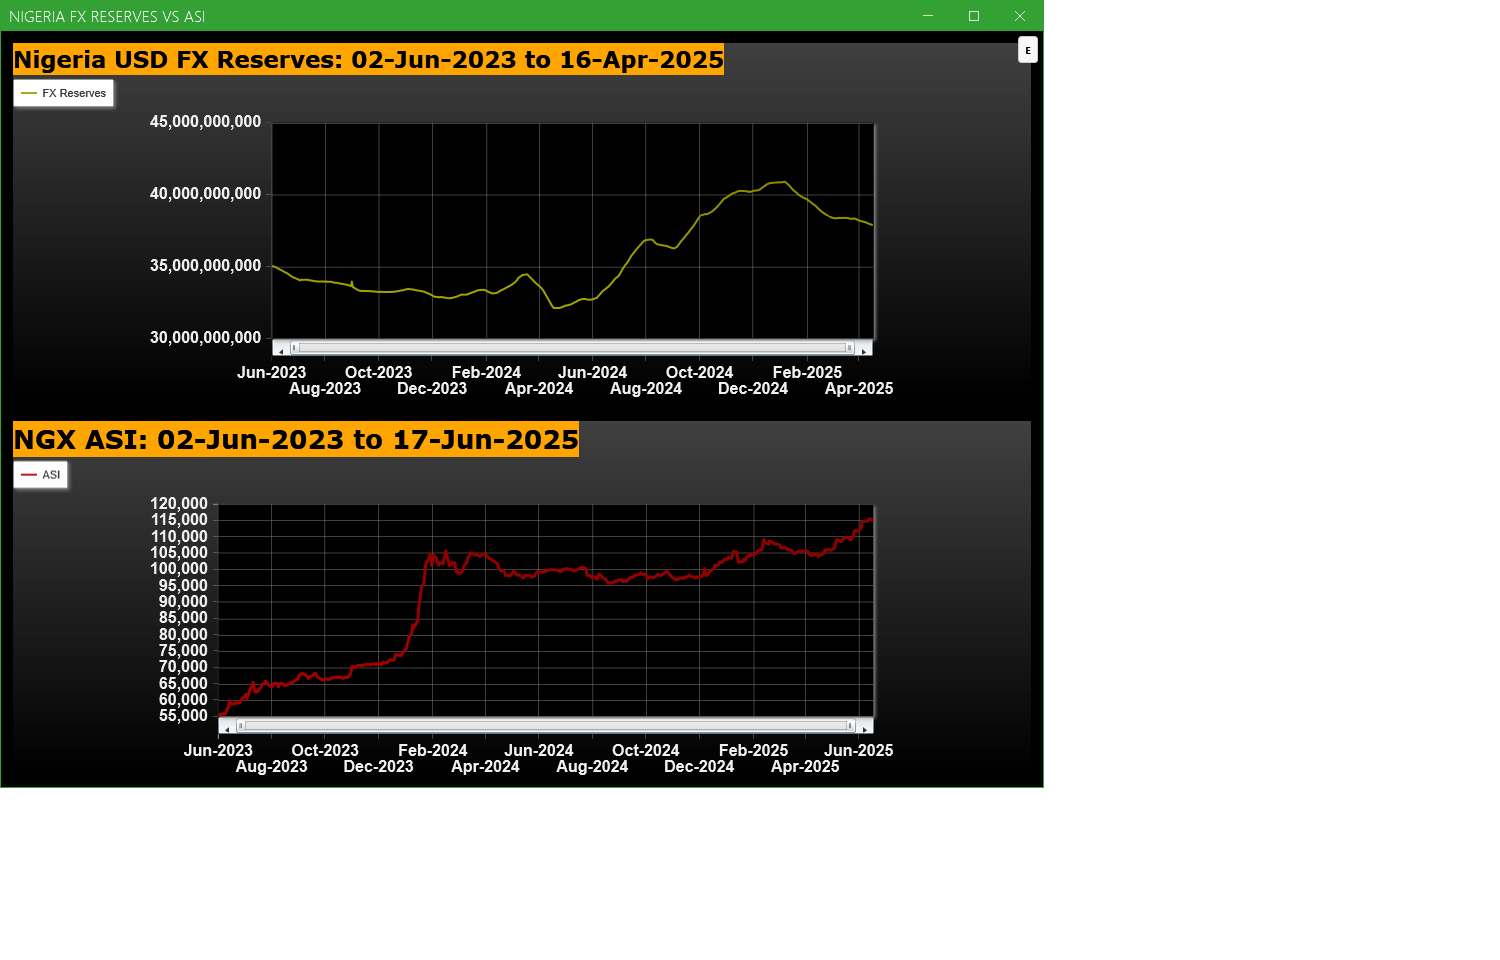
Economic Indicators - Nigeria FX Reserves Vs ASI Chart
Nigeria FX Reserves are assets held on reserve by CBN in foreign currencies. These reserves are used to back liabilities and influence monetary policy. Given the nature of the Nigeria economy, FX Reserves can appear to have an outsize influence on the economy and hence on the capital market. The chart below allows comparison of FX Reserves against the ASI to make investment decisions
For more detailed analysis,
- On InfoWARE Market Data Terminal <CI> <GO>
- On InfoWARE Finance Mobile App ( Android , iPhone & iPad and Windows 10) , "Research"
Market Trend - ASI (NGX All-Share-Index) With 50 & 200 Day MAvgs Chart
Technical traders typically use the 50 & 200 day moving averages to aid in choosing
where to enter or exit a position, which then causes these levels to act as strong
support or resistance. As a general guideline, if the price is above a moving average,
the trend is up. If the price is below a moving average, the trend is down.
It is important to note that critics of technical analysis say that moving averages act
as support and resistance because so many traders use these indicators to inform their
trading decisions. Also moving averages tend to work quite well in strong trending conditions
but poorly in choppy or ranging conditions.
Trading Strategies: Crossovers
Crossovers are one of the main moving average strategies. The first type is a price crossover,
which is when the price crosses above or below a moving average to signal a potential change
in trend. Another strategy is to apply two moving averages to a chart: one longer and one
shorter. When the shorter-term MA crosses above the longer-term MA, it is a buy signal, as
it indicates that the trend is shifting up. This is known as a golden cross. Meanwhile, when
the shorter-term MA crosses below the longer-term MA, it is a sell signal, as it indicates that
the trend is shifting down. This is known as a dead/death cross

For more detailed analysis,
- On InfoWARE Market Data Terminal <CI> <GO>
- On InfoWARE Finance Mobile App ( Android , iPhone & iPad and Windows 10) , "Research"
Unusual Volume: Volume traded is more than double the 90 day moving average (All exchanges; ASI & ASem). For more detailed analysis,
- On InfoWARE Market Data Terminal <UV> <GO>
- On InfoWARE Finance Mobile App ( Android , iPhone & iPad and Windows 10)
| Symbol | Name | Volume | 90DAvgVol | %VolChg | Price | LClose | %Chg | Trades | Value |
|---|---|---|---|---|---|---|---|---|---|
| ZENITHBANK | ZENITH INTERNATIONAL BANK PLC | 96.23M | 25.27M | 280.74 | 46.05 | 47.00 | -2.02 | 2,020 | 4.25B |
| GTCO | GUARANTY TRUST HOLDING COMPANY PLC | 83.36M | 29.78M | 179.95 | 75.65 | 71.50 | 5.80 | 1,044 | 6.24B |
| ETI | ECOBANK TRANSNATIONAL INCORPORATED | 51.73M | 1.64M | 3,045.57 | 30.50 | 30.00 | 1.67 | 119 | 1.57B |
| ELLAHLAKES | ELLAH LAKES PLC. | 48.09M | 7.74M | 520.97 | 4.29 | 4.76 | -9.87 | 847 | 228.24M |
| FIRSTHOLDCO | FIRST HOLDCO PLC | 22.06M | 9.69M | 127.69 | 25.40 | 26.50 | -4.15 | 659 | 556.77M |
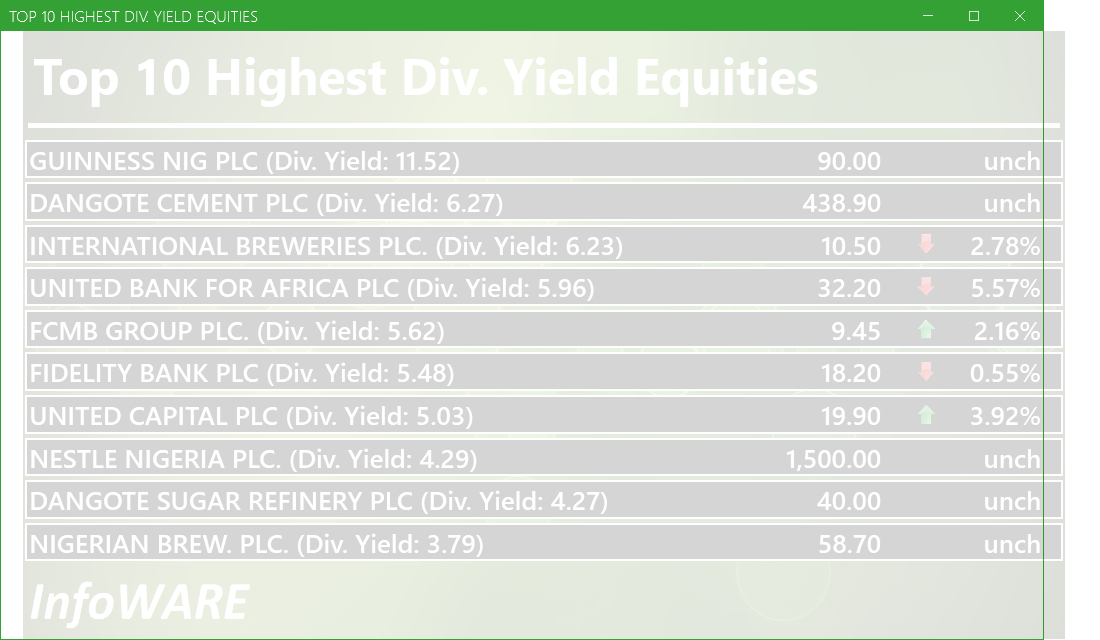
Investment Insights - High Div. Stocks
Dividend stocks distribute a portion of the company earnings to investors on a regular basis and they can a great choice for investors looking for regular income. As an investment or trading strategy, high dividend yield equities provide annual cash payments as against mostly capital gains in the price of a stock. The list in the table below represent the highest dividend paying stocks from the list of the most liquid stocks in the NSE top 30.
For more detailed analysis,
- On InfoWARE Market Data Terminal <HYIELD> <GO>
- On InfoWARE Finance Mobile App ( Android , iPhone & iPad and Windows 10) , "Research"
African Markets
| Name | LClose | Change | %Chg |
|---|---|---|---|
| BRVM Stock Exchange | 306.33 | 0.15 | 0.05 |
| Egyptian Exchange | 31,042.36 | 24.81 | 0.08 |
| Ghana Stock Exchange | 6,227.74 | 53.71 | 0.87 |
| Lusaka Stock Exchange | 20,479.45 | -8.20 | -0.04 |
| Casablanca Stock Exchange | 18,178.61 | -239.43 | -1.30 |
| Malawi Stock Exchange | 291,093.23 | 610.01 | 0.21 |
| Nigeria Stock Exchange | 115,258.77 | -173.15 | -0.15 |
| Nairobi Securities Exchange | 144.68 | -2.92 | -1.98 |
| Rwanda Stock Exchange | 150.53 | -0.18 | -0.12 |
| Tunis Stock Exchange | 11,126.24 | -111.25 | -0.99 |
| Uganda Securities Exchange | 1,273.06 | 5.96 | 0.47 |
Nigeria Market Indexes
| Symbol | LClose | %Chg | WTD% | MTD% | QTD% | YTD% | MktCap | Trades |
|---|---|---|---|---|---|---|---|---|
| ASI | 114,910.16 | -0.30 | -0.30 | 2.57 | 8.87 | 11.37 | 21,786 | |
| NGX30 | 4,244.46 | -0.28 | -0.28 | 2.71 | 8.30 | 11.26 | 12,565 | |
| NGXAFRBVI | 2,631.88 | -0.06 | -0.06 | 0.17 | -1.17 | 6.09 | 6,689 | |
| NGXAFRHDYI | 18,113.55 | 0.83 | 0.83 | -1.65 | 8.83 | 6.38 | 6,374 | |
| NGXASEM | 1,593.40 | 0.00 | 0.00 | 0.00 | 0.35 | 0.61 | 17 | |
| NGXBNK | 1,167.35 | -0.20 | -0.20 | 0.38 | 0.56 | 7.35 | 7,147 | |
| NGXCG | 3,173.26 | -0.02 | -0.02 | 1.52 | 5.41 | 12.16 | 12,413 | |
| NGXCNSMRGDS | 2,503.75 | -0.50 | -0.50 | 5.28 | 37.90 | 44.36 | 2,231 | |
| NGXCOMMDTY | 969.92 | -1.92 | -1.92 | -2.61 | -3.35 | -3.01 | ||
| NGXGROWTH | 8,379.12 | 2.76 | 2.76 | 7.57 | 13.35 | 7.94 | 214 | |
| NGXINDUSTR | 3,533.59 | 0.16 | 0.16 | 2.58 | 1.25 | -1.07 | 1,320 | |
| NGXINS | 706.36 | 0.40 | 0.40 | 2.29 | 3.83 | -10.15 | 1,111 | |
| NGXLOTUSISLM | 8,645.84 | 0.60 | 0.60 | 3.90 | 14.45 | 24.08 | 2,810 | |
| NGXMAINBOARD | 5,692.08 | -0.45 | -0.45 | 2.52 | 12.46 | 13.75 | 14,592 | |
| NGXMERIGRW | 7,588.64 | 0.06 | 0.06 | -0.83 | 10.62 | 16.33 | 2,850 | |
| NGXMERIVAL | 9,827.37 | -1.40 | -1.40 | -4.28 | -4.53 | -5.78 | 7,928 | |
| NGXOILGAS | 2,324.46 | -1.25 | -1.25 | -0.35 | -4.99 | -14.26 | 526 | |
| NGXPENBRD | 2,089.36 | -0.12 | -0.12 | 3.17 | 10.62 | 14.07 | 17,781 | |
| NGXPENSION | 5,433.95 | 0.43 | 0.43 | 3.45 | 13.53 | 19.85 | 13,482 | |
| NGXPREMIUM | 10,891.69 | -0.02 | -0.02 | 4.81 | 7.14 | 11.91 | 6,980 | |
| NGXSOVBND | 657.13 | 0.00 | 0.00 | 0.13 | 4.83 | 9.24 | 0 |
For more detailed analysis,
- On InfoWARE Market Data Terminal <MKTINS> <GO>
- On InfoWARE Finance Mobile App ( Android, iPhone & iPad and Windows 10) , "Market Indexes"
Find the topic interesting? Will like to comment? Contact Us at solutions@infowarelimited.com
Top News

Chart Of The Day - ASI Chart Vs ASI Advance Decline Line (YTD) (17-Jun-2025 15:07:28.073)
InfoWARE AI Analyst Daily Market Report: 17-Jun-2025

[XNSA]>> REGENCY ASSETS MANAGEMENT LIMITED - APPOINTMENT OF A DIRECTOR
[MULTIVERSE]>>Corporate Disclosures-<MULTIVERSE MINING AND EXPLORATION PLC>
[XNSA]>> CIS ACADEMY TRAINING ON "BOND ANALYSIS, VALUATION & TRADING
[XNSA]>> CORDROS MILESTONE FUNDS' BID & OFFER PRICES
[AIRTELAFRI]>>Corporate Disclosures-<Airtel Africa Plc>
[CORNERST]>>Notice of Meeting -<CORNERSTONE INSURANCE PLC>
[ASOSAVINGS]>>Notice of Meeting -<ASO SAVINGS AND LOANS PLC>
[ABBEYBDS]>>Notice of Meeting -<ABBEY MORTGAGE BANK PLC>
[VSPBONDETF]>> DAILY INDICATIVE PRICES
[XNSA]>> NGX FIXED INCOME INDICATIVE PRICE LIST FOR JUN 17, 2025
[XNSA]>> SUPPLEMENTARY LISTING
[XNSA]>> DAILY FUND PRICE SUBMISSION - FCMB ASSET MANAGEMENT LIMITED
[SIAMLETF40]>> DAILY INDICATIVE PRICES
[XNSA]>> H1 2025 BUSINESS CONTINUITY/DISASTER RECOVERY TEST
Chart Of The Day - ASI Chart Vs ASI Advance Decline Line (YTD) (16-Jun-2025 15:12:30.741)
InfoWARE AI Analyst Daily Market Report: 16-Jun-2025
[XNSA]>> CHAMS HOLDING COMPANY PLC: PROPOSED RIGHTS ISSUE
[XNSA]>> CIS ACADEMY TRAINING ON "BOND ANALYSIS, VALUATION & TRADING
[MERGROWTH]>> DAILY INDICATIVE PRICES
[AIRTELAFRI]>>Corporate Disclosures-<Airtel Africa Plc>
[XNSA]>> CORDROS MILESTONE FUNDS' BID & OFFER PRICES
[XNSA]>> DAILY FUND PRICE SUBMISSION - FCMB ASSET MANAGEMENT LIMITED
[VSPBONDETF]>> DAILY INDICATIVE PRICES
[XNSA]>> NGX FIXED INCOME INDICATIVE PRICE LIST FOR JUN 16, 2025
[MRS]>>Corporate Disclosures-<MRS OIL NIGERIA PLC.>
[XNSA]>> LISTING OF NGX30Z5 AND NGXPENSIONZ5 FUTURES CONTRACTS
[SIAMLETF40]>> DAILY INDICATIVE PRICES
[XNSA]>> H1 2025 BUSINESS CONTINUITY/DISASTER RECOVERY TEST
Get IDIA - the stock trading app for the modern investor
Solutions by Business
Product Suites
Company
Contacts
- 8th Floor,
- South Atlantic Petroleum Towers,
- 1 Adeola Odeku Street,
- Victoria Island,
- Lagos, Nigeria.
- Email: solutions@infowarelimited.com
Follow Us
 |
 |
 |
 |