


InfoWARE AI Analyst Daily Market Report: 27-Jun-2025 | InfoWARE Finance
Get IDIA - the stock trading app for the modern investor


InfoWARE AI Analyst Daily Market Report: 27-Jun-2025
(Source: InfoWARE Terminal, Date: 27-Jun-2025)
Dear Investor,
NGX Daily Market Recap: Friday, June 27, 2025
The Nigerian Equities Market concluded the week on a slightly negative note as the NGX All Share Index slipped by -0.64% to close at 120,772.68. Market turnover contracted sharply by -32.86% to 11.44 billion Naira, with trading volumes also lower at 601.83 million units. Breadth was slightly negative with more decliners (34) than advancers (30), yielding a market breadth ratio of 0.88x. Despite today's softness, YTD market return stands at a healthy +16.30%. Defensive trading strategies came into focus amid sector divergence, sudden momentum reversals, and unusually high volumes in select small- and mid-cap stocks, offering several actionable signals for traders.
Key Market Trends
- Breadth Check: Slightly bearish with 30 gainers and 34 losers — a roughly balanced market but bias toward slight weakness.
- Turnover Drop: Significant slide in turnover (-32.86% vs. prior day) suggests either trader caution heading into the weekend, profit booking, or a pause after recent runs.
- Volume Trend: Volumes up for 55 stocks and down for 84 — evidence of selective rotation rather than broad-based volume participation.
Top 5 Gainers & Losers
| Symbol | Name | % Change | RSI | MACD | 15D/50D MA |
| MERVALUE | Meristem Value ETF | +10.00% | 66.35 | -0.081 | 121.4/120.4 ↑ |
| NEIMETH | Neimeth Intl. Pharma | +10.00% | 86.63 | 0.406 | 4.0/3.3 ↑ |
| LEARNAFRCA | Learn Africa Plc | +9.91% | 64.47 | 0.099 | 4.2/4.1 ↑ |
| MECURE | Mecure Industries | +9.91% | 2.58 | -0.011 | 11.2/11.1 ↑ |
| ACADEMY | Academy Press Plc | +9.44% | 62.50 | 0.161 | 4.6/4.0 ↑ |
| LEGENDINT | Legend Internet | -9.98% | 62.24 | 0.226 | 7.5/7.8 ↓ |
| BUACEMENT | BUA Cement Plc | -9.92% | 92.87 | 3.46 | 90.5/85.8 ↑ |
| FTNCOCOA | FTN Cocoa Processors | -9.76% | 78.48 | 0.315 | 2.9/2.4 ↑ |
| OANDO | Oando Plc | -8.72% | 55.31 | 4.18 | 62.3/50.4 ↑ |
| MCNICHOLS | McNichols Plc | -8.44% | 56.45 | 0.055 | 2.3/2.1 ↑ |
- Overbought Action: NEIMETH (RSI 86.6), BUACEMENT (RSI 92.9), and FTNCOCOA (RSI 78.5) are at extreme momentum levels, often forewarning possible reversals or at least consolidation ahead.
- Unusual Volume: ELLAHLAKES (+596% vs 90d avg), JAPAULGOLD (+589%), CAVERTON (+748%), OANDO (+126%), NEIMETH (+235%) – these counters were flashpoints for liquidity, often leading price action.
YTD Top Gainers & Losers (Cross-section Summary)
| Top Gainers YTD | Top Losers YTD | ||||||||
| Symbol | YTD % | 5D % | MTD % | RSI | Symbol | YTD % | 5D % | MTD % | RSI |
| INTBREW | +152.7 | +24.1 | +44.0 | 87.33 | OANDO | -14.1 | -10.6 | +21.8 | 55.31 |
| NEIMETH | +136.7 | +45.9 | +77.3 | 86.63 | FIRSTHOLDCO | -7.09 | -6.43 | +2.75 | 48.83 |
| ELLAHLAKES | +132.6 | +19.5 | +127.3 | 81.22 | DAARCOMM | -10.29 | -4.69 | -6.15 | 46.62 |
| DANGSUGAR | +46.6 | +19.1 | +21.6 | 70.15 | ABCTRANS | +99.2 | -5.77 | -16.95 | 43.85 |
| CWG | +54.4 | +19.8 | +27.8 | 66.11 | MANSARD | +5.88 | -4.50 | +4.37 | 54.32 |
- Notable momentum overlays: NEIMETH and ELLAHLAKES show YTD > +130% with extreme RSI readings (86, 81), signaling continued speculative flows but also imminent overbought risks.
- OANDO maintains negative YTD at -14.1% despite intense trading and institutional/fair retail activity, a sign of persistent selling pressure or rotation out of the name.
- Several gainers are also in the 'unusual volume' list — a sign of momentum chasers crowding in. Contrarian alert warranted (see below).
Bullish & Bearish Momentum — Technical Rundown
| Bullish Momentum (Price Above 15DMA) | Bearish Momentum (Price Below 15DMA) | ||||||
| Symbol | Price | %Chg | Sector | Symbol | Price | %Chg | Sector |
| JAIZBANK | 3.25 | +3.38 | Banking | HONYFLOUR | 21.20 | -2.12 | Food Products |
| UPL | 6.00 | +3.33 | Printing | SUNUASSUR | 5.00 | -2.40 | Insurance |
| NNFM | 108.00 | 0.00 | Food Products | NSLTECH | 0.58 | -3.45 | Specialty |
| MCNICHOLS | 2.17 | -9.22 | Food Products | ||||
| FGSUK2027S3 | 78.50 | -23.48 | Debt | ||||
- Strong bullish signals: JAIZBANK, UPL and NNFM show sustained strength above key averages; track for further upside especially if supported by sector tailwinds.
- Bears take note: MCNICHOLS and NSLTECH have shifted under short-term support, indicating increased sell momentum. MCNICHOLS is especially interesting, combining high dividend yield with a technical downside break.
Unusual Volume Flashpoints
- CAVERTON, JAPAULGOLD, ELLAHLAKES, OANDO, and NEIMETH all recorded volume spikes of over 2x–7x their respective 90-day averages. This "volume shock" often precedes either trend continuation or sharp reversals. Among these, NEIMETH, ELLAHLAKES, and OANDO also cross-reference as YTD leaders/laggards — a note of caution for momentum chasers and an alert for mean reversion trades.
- ELLAHLAKES stands out: +132% YTD, +19.5% 5D, RSI above 80, and almost 600% volume surprise — this is textbook "overheated" territory likely to attract short-term profit takers soon.
Contrarian Signals
- NEIMETH: Outstanding price move (+10% today, +136% YTD), volume surge, and extremely high RSI (86.6, climbing from 83), yet relatively low Beta (0.25) and huge PE (125.5) hint at speculative excess. While MACD is positive, further upside risks a pullback — a classic "overbought, over-loved" setup.
- BUACEMENT: RSI at 92.9 (off-the-chart overbought), massive MACD but deeply negative on the day (-9.9%), suggesting hard money is exiting even as momentum traders pile in.
- MCNICHOLS: Multi-signal conflict — dropped -8.4% (today), below 15DMA and on bearish signal list, yet carries a very high dividend yield (5.88%) and was previously on watchlists for defensive plays. Consider for contrarian buy interest on reversal signs.
- MERVALUE ETF: Up +10% on the day, but YTD still -29%. Technical rebound or deeper value implied? Momentum traders may prefer to scalp, but long-term players remain wary.
Sector Heatmap & Commentary
| Sector | Top Performer | % Change | Trend Sparkline | Retail % Trades | Institutional % Trades |
| Banking | ZENITHBANK | +14.1% (5D) | 📈 (15D: 51.7 - 50D: 48.9) | 3.85 | 1.26 |
| Oil & Gas | OANDO | -8.7% (1D) | 📉 (15D: 62.3 - 50D: 50.4) | 4.31 | 0.55 |
| Printing | LEARNAFRCA | +9.91% (1D) | 📈 (15D: 4.25 - 50D: 4.09) | — | — |
| Crop Prod. | ELLAHLAKES | +2.94% (1D) | 📈 (15D: 5.17 - 50D: 3.79) | 5.62 | 0.63 |
| Food Prod. | NNFM | 0.00% (1D) | 📈 (15D: 107.1 - 50D: 107.06) | — | — |
- Banking sector still foregrounded by institutional flows (see clustering alert).
- Oil & Gas remains polarizing — OANDO volatility and decline, opposite from the positive sector 1-week trend elsewhere.
- Printing (LEARNAFRCA) is an emerging outperformer: high price return, big yield, and low volatility — an outlier for additional research.
Dividend-Beta Matrix: Defensive Opportunities
| Symbol | Dividend Yield (%) | Beta | RSI | 1D %Chg |
| LEARNAFRCA | 8.53 | 0.03 | 64.5 | +9.9 |
| DANGSUGAR | 4.27 | 1.35 | 70.2 | +1.4 |
| MCNICHOLS | 5.88 | -0.11 | 56.5 | -8.4 |
| AFRIPRUD | 1.27 | 0.64 | -- | -- |
| JAIZBANK | 1.67 | 1.14 | -- | +3.4 |
- LEARNAFRCA, with very low beta and high yield, is offering a unique "defensive + growth" profile.
- MCNICHOLS, despite high yield, is technically under pressure — avoid until a reversal or volume support appears.
Institutional Clustering Alerts
- ZENITHBANK: Institutional activity dominated, accounting for 20.17% of today's institutional trade value share. Notably, the stock's strong YTD (+26.5%) and robust 5D momentum suggest continued buy-in from funds.
- GTCO, ACCESSCORP, ELLAHLAKES, and OANDO are also institutional favorites, but take note of divergent performances (for instance, OANDO is seeing high trades but falling price — possible distribution).
Market Activity Summary: Retail vs. Institutional Insights
| Investor Type | Trade Count | % of Trades | Total Volume | % Volume | Total Value (N) | % Value |
| Institutional | 2,131 | 37.67 | 422.7M | 67.55 | 10.88B | 84.9 |
| Retail | 19,738 | 62.33 | 203.1M | 32.45 | 1.94B | 15.1 |
- Trade Count: Retail investors contributed nearly two-thirds of trade count but only a third of volume/trade value, reflecting a higher number of smaller trades (often noise or trend chasing).
- Volume/Value: Institutional players are steering the market, handling ~85% of value and nearly 70% of volume. Today is a classic example of "smart money" leading price direction.
| Top 5 Institutional Trades | Top 5 Retail Trades | ||||||||||||
| Symbol | Trade Cnt | Volume | Value | %Value | %WTD | 1D % | Symbol | Trade Cnt | Volume | Value | %Value | %WTD | 1D % |
| ZENITHBANK | 275 | 28.8M | 1.66B | 12.93 | +14.1 | -0.51 | ELLAHLAKES | 1,228 | 29.0M | 201M | 1.57 | +19.5 | +2.94 |
| GTCO | 210 | 14.9M | 1.23B | 9.60 | -1.26 | -0.60 | OANDO | 942 | 1.8M | 108M | 0.84 | -10.6 | -8.72 |
| ACCESSCORP | 159 | 49.2M | 1.09B | 8.54 | -1.34 | -2.43 | ACCESSCORP | 940 | 6.9M | 153M | 1.19 | -1.34 | -2.43 |
| ELLAHLAKES | 137 | 51.1M | 354M | 2.76 | +19.5 | +2.94 | ZENITHBANK | 843 | 1.7M | 99.5M | 0.78 | +14.1 | -0.51 |
| OANDO | 120 | 9.6M | 563M | 4.40 | -10.6 | -8.72 | GTCO | 644 | 0.86M | 71.1M | 0.55 | -1.26 | -0.60 |
- Pattern: Banking names (ZENITHBANK, GTCO) topped institutional interest, aligning with sector performance. For retail, ELLAHLAKES and OANDO were favorites—one on momentum chase, the other possibly on mean reversion trade attempts following sharp sell-offs.
- High-value stocks drew more institutional flows, likely for liquidity and because foreign or local funds are rebalancing into strength and away from volatility chokepoints (e.g., OANDO).
Actionable Observations, Risks, and Opportunities
- Momentum Flags: Stocks with extreme RSI/volume spikes (NEIMETH, ELLAHLAKES, BUACEMENT) are entering "crowded trade" zones. Traders should tighten stops or consider partial profit taking.
- Volume+Momentum Sweet Spot: Names like JAPAULGOLD and CAVERTON with huge volume jumps—if further price strength follows Monday, potential short-term breakout trades may emerge.
- Defensive Signals: LEARNAFRCA offers combination of yield, positive trend (above 15DMA), and surprisingly low beta. Suitable for lower-risk portfolios.
- Contrarian Buys: Consider watching MCNICHOLS and MERVALUE for reversal signals as they are technically oversold/under-held by fast money but offer high dividends or deep value on longer timeframes.
- Institutional Follow-through: Names showing clustering of institutional action (ZENITHBANK, GTCO) tend to enjoy near-term stability and outperformance. Watch for fund flows into value pullbacks in these leaders.
- Caution: High-yield stocks that just entered bearish momentum lists (MCNICHOLS, with 5.88% yield, now below 15DMA and multiple day losses) should be treated with caution until reversal evidence.
Key Trader Suggestions
- Lock in gains on overheated momentum names — particularly if you see both high RSI and volume spike.
- Monitor volume reversals: Day traders can watch ELLAHLAKES, JAPAULGOLD, NEIMETH, CAVERTON for signs of institutional lean or exit—move with the first hour strength/weakness on Monday.
- Leverage sector leadership: Follow institutional buying into banks; consider rotating out of short-term overextensions in small caps.
- Steer clear of names with negative price action, low liquidity, and now technical breaks below key averages—MCNICHOLS and SUNUASSUR caution examples.
- Tail event risk: Turnover drop today is a warning for lower liquidity and potential for sudden, larger price swings next week.
|
Top ASI Gainers Over Last 5 Trading Days
|
Top ASI Losers Over Last 5 Trading Days
|
For more detailed analysis, on InfoWARE Market Data Terminal <NSEPERF> <GO>
On InfoWARE Finance Mobile App (Android, iPhone & iPad, Windows Phone and Windows 8/10), "Top Gainers & Losers"
MERISTEM VALUE EXCHANGE TRADED FUND (MERVALUE) topped the advancers list closing at N141.57 with a gain of 10.00% followed by NEIMETH INTERNATIONAL PHARMACEUTICALS PLC (NEIMETH) which closed at N5.94 with a gain of 10.00%.
On the flip side LEGEND INTERNET PLC (LEGENDINT) and BUA CEMENT PLC (BUACEMENT) topped the decliners log with a loss of -9.98% at a close of N8.03, and -9.92% to close the day at N95.40 respectively.
| Symbol | LClose | %Chg |
|---|---|---|
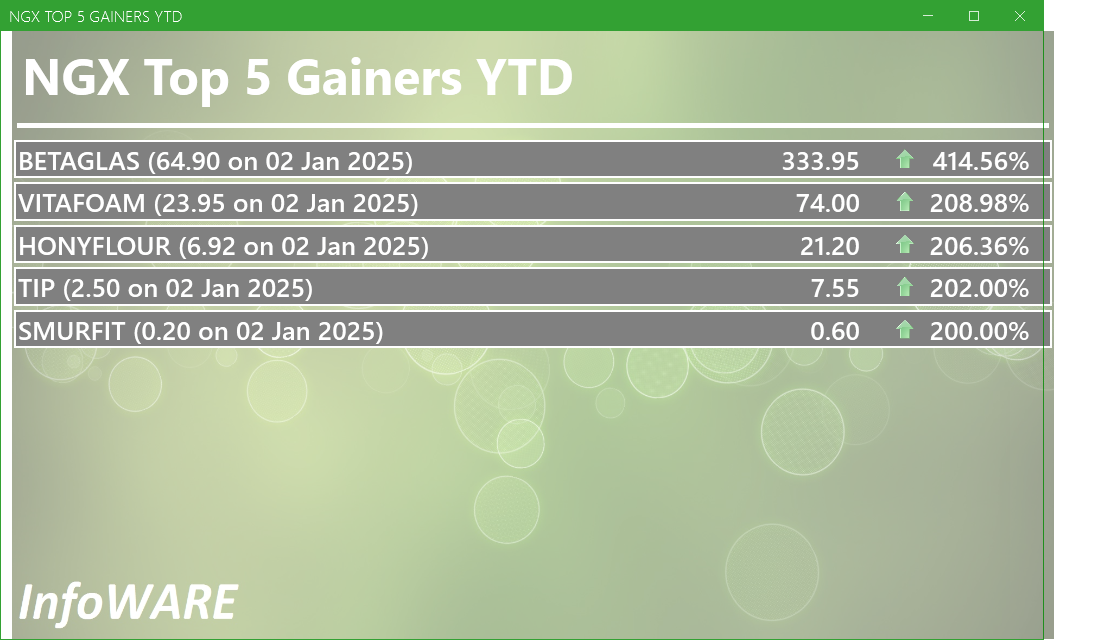
| MERVALUE | 141.57 | 10.00 |
| NEIMETH | 5.94 | 10.00 |
| LEARNAFRCA | 5.10 | 9.91 |
| MECURE | 12.20 | 9.91 |
| ACADEMY | 5.10 | 9.44 |
For more detailed analysis,
- On InfoWARE Market Data Terminal <TOPG> <GO>
- On InfoWARE Finance Mobile App ( Android, iPhone & iPad and Windows 10) , "Top Gainers & Losers"
Currency Market
In the currency market, the Naira was unchanged against the dollar at 1 to 1Investment Insights - Top 5 Gainers YTD
These stocks are the best performers whose price has risen faster than the market as a whole with the best returns year to date. Momentum investors believe that stocks that have outperformed the market will often continue to do so because the factors that caused them to outperform will not suddenly disappear. In addition, other investors seeking to benefit from the stock’s outperformance will often purchase the stock, further bidding its price higher and pushing the stock higher still
For more detailed analysis,
- On InfoWARE Market Data Terminal <T5YTD2> <GO>
- On InfoWARE Finance Mobile App ( Android , iPhone & iPad and Windows 10) , "Research"
NSE: Bull Signal - Price crossed above 15 Day MA
This signal implies these stocks are under buying pressure and the price might continue to rise and therefore positions should be monitored closely. Further suggested analysis include looking at the overall market (ASI) to see if the uptrend is market wide, sector wide or specific to the stock. Portfolio managers tend to use this as a signal to do more research to add to their positions or lock in some profits. Typically further analysis should be done using commands like PC and RV on the InfoWARE Market Data Terminal. Another command is ALERTS to set price triggers for possible exit or entry as necessary
For more detailed analysis,
- On InfoWARE Market Data Terminal <NSEPERF> <GO>
- On InfoWARE Finance Mobile App ( Android , iPhone & iPad and Windows 10) , "Top Gainers & Losers"
NSE: BEAR Signal - Price crossed below 15 Day MA
This signal implies these stocks are under selling pressure and the price might continue to slide and therefore positions should be monitored closely. Further suggested analysis include looking at the overall market (ASI) to see if the downtrend is market wide, sector wide or specific to the stock. If the overal market trend is upwards, then since these stocks are heading in the opposite direction, then further analysis should be done using commands like PC and RV on the InfoWARE Market Data Terminal. Another command is ALERTS to set price triggers for possible exit is necessar
For more detailed analysis,
- On InfoWARE Market Data Terminal <BEARM> <GO>
- On InfoWARE Finance Mobile App ( Android , iPhone & iPad and Windows 10)
| Symbol | Price | %Chg | 15DMA | PE | EPS | DivY | MktCap | Vol | Trades | Value | LstTradeTime |
|---|---|---|---|---|---|---|---|---|---|---|---|
| HONYFLOUR | 21.20 | -2.12 | 21.52 | 16.28 | 0.31 | 1.40 | 168.12B | 3.12M | 312.00 | 66.86M | 27-Jun-2025 14:30:20.193 |
| SUNUASSUR | 5.00 | -2.40 | 5.06 | 0.00 | 0.00 | 0.99 | 29.05B | 2.55M | 35.00 | 12.73M | 27-Jun-2025 14:31:19.883 |
| NSLTECH | 0.58 | -3.45 | 0.59 | 0.00 | 0.00 | 15.87 | 3.27B | 4.15M | 41.00 | 2.44M | 27-Jun-2025 14:30:22.943 |
| MCNICHOLS | 2.17 | -9.22 | 2.31 | 26.80 | 0.05 | 5.88 | 1.56B | 3.14M | 78.00 | 6.87M | 27-Jun-2025 14:31:27.613 |
| FGSUK2027S3 | 78.50 | -23.48 | 86.47 | 0.00 | 0.00 | 2.50K | 1.00 | 1.96M | 27-Jun-2025 14:30:41.027 |
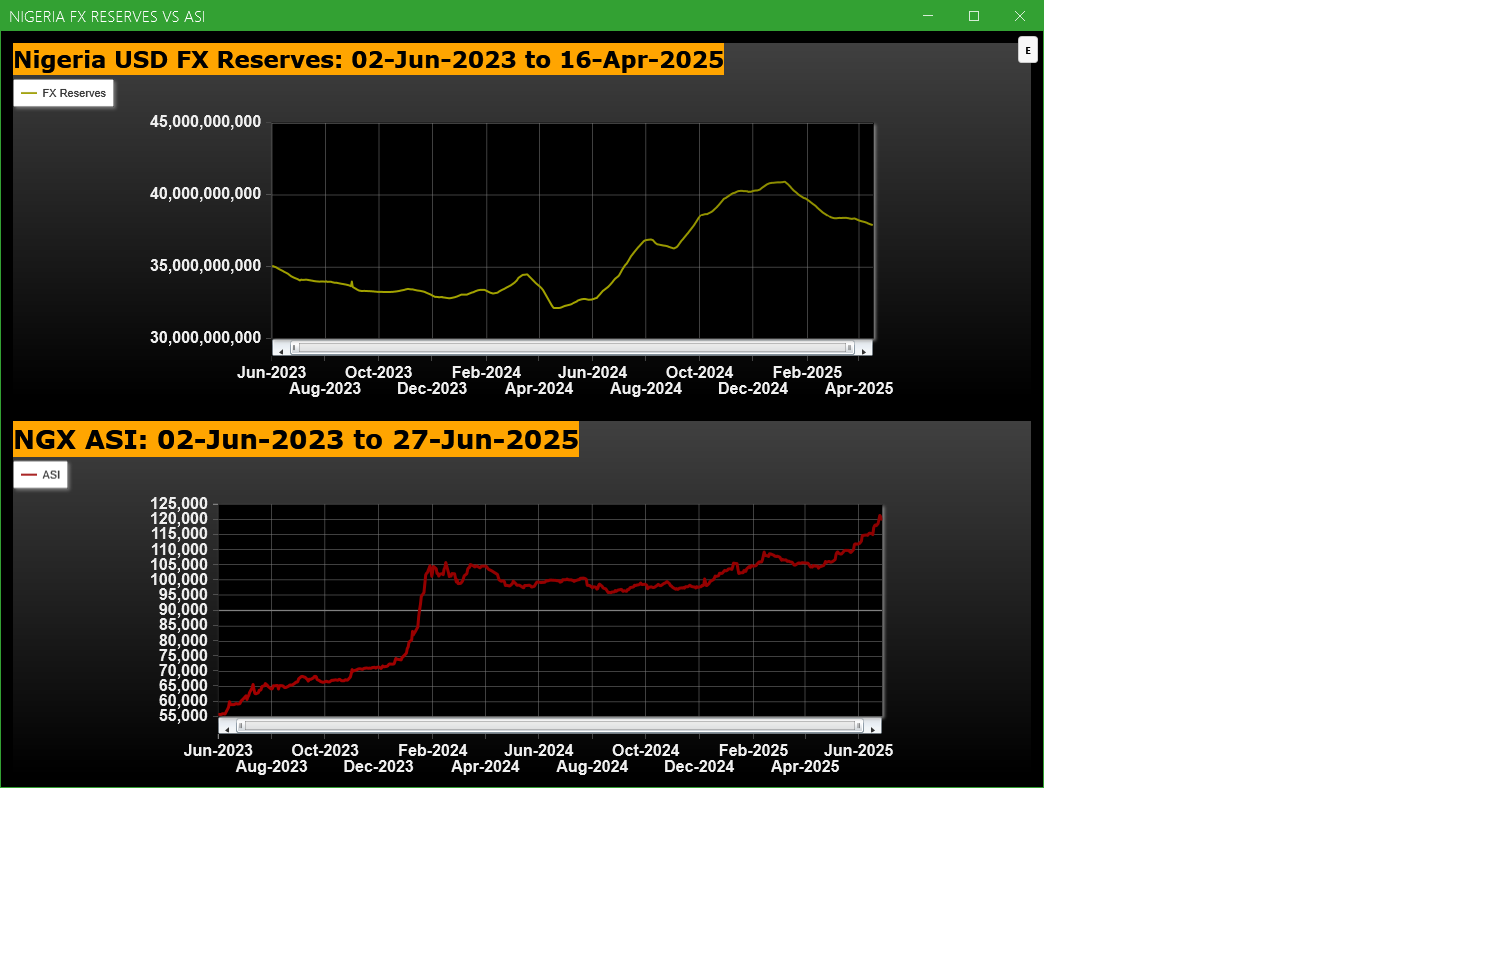
Economic Indicators - Nigeria FX Reserves Vs ASI Chart
Nigeria FX Reserves are assets held on reserve by CBN in foreign currencies. These reserves are used to back liabilities and influence monetary policy. Given the nature of the Nigeria economy, FX Reserves can appear to have an outsize influence on the economy and hence on the capital market. The chart below allows comparison of FX Reserves against the ASI to make investment decisions
For more detailed analysis,
- On InfoWARE Market Data Terminal <CI> <GO>
- On InfoWARE Finance Mobile App ( Android , iPhone & iPad and Windows 10) , "Research"
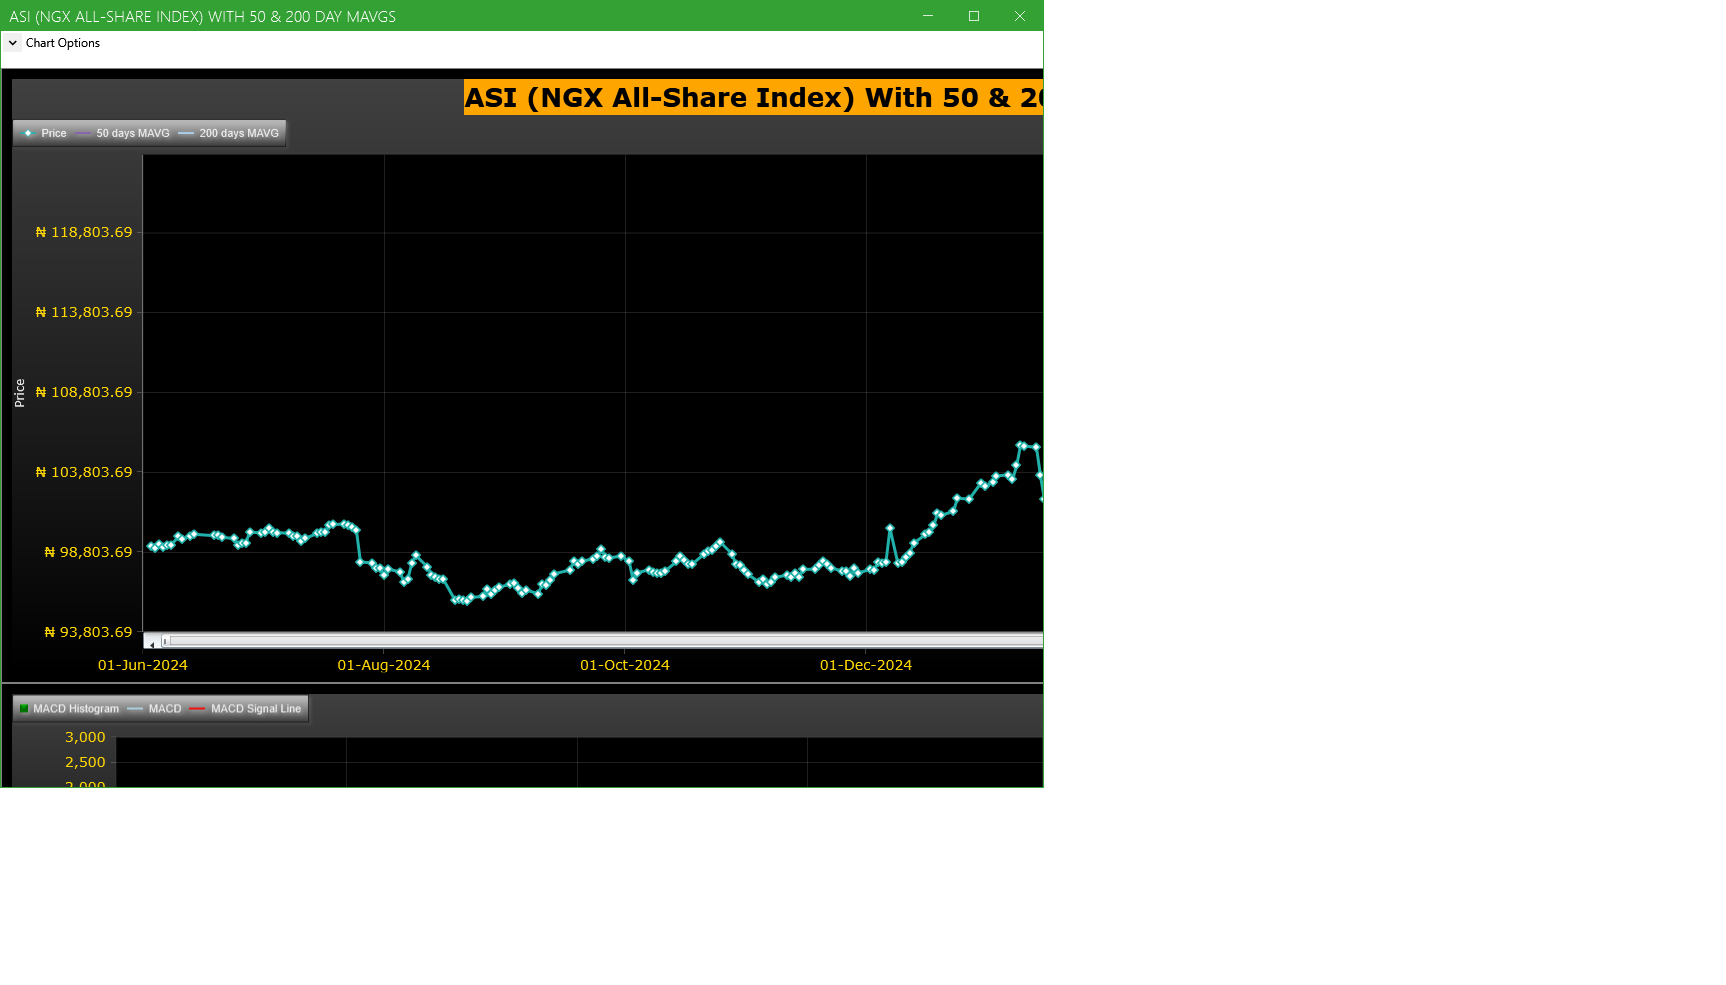
Market Trend - ASI (NGX All-Share-Index) With 50 & 200 Day MAvgs Chart
Technical traders typically use the 50 & 200 day moving averages to aid in choosing
where to enter or exit a position, which then causes these levels to act as strong
support or resistance. As a general guideline, if the price is above a moving average,
the trend is up. If the price is below a moving average, the trend is down.
It is important to note that critics of technical analysis say that moving averages act
as support and resistance because so many traders use these indicators to inform their
trading decisions. Also moving averages tend to work quite well in strong trending conditions
but poorly in choppy or ranging conditions.
Trading Strategies: Crossovers
Crossovers are one of the main moving average strategies. The first type is a price crossover,
which is when the price crosses above or below a moving average to signal a potential change
in trend. Another strategy is to apply two moving averages to a chart: one longer and one
shorter. When the shorter-term MA crosses above the longer-term MA, it is a buy signal, as
it indicates that the trend is shifting up. This is known as a golden cross. Meanwhile, when
the shorter-term MA crosses below the longer-term MA, it is a sell signal, as it indicates that
the trend is shifting down. This is known as a dead/death cross
For more detailed analysis,
- On InfoWARE Market Data Terminal <CI> <GO>
- On InfoWARE Finance Mobile App ( Android , iPhone & iPad and Windows 10) , "Research"
Unusual Volume: Volume traded is more than double the 90 day moving average (All exchanges; ASI & ASem). For more detailed analysis,
- On InfoWARE Market Data Terminal <UV> <GO>
- On InfoWARE Finance Mobile App ( Android , iPhone & iPad and Windows 10)
| Symbol | Name | Volume | 90DAvgVol | %VolChg | Price | LClose | %Chg | Trades | Value |
|---|---|---|---|---|---|---|---|---|---|
| JAPAULGOLD | JAPAUL GOLD & VENTURES PLC | 88.26M | 12.81M | 588.96 | 2.25 | 2.11 | 6.64 | 375 | 192.04M |
| ELLAHLAKES | ELLAH LAKES PLC. | 80.04M | 11.49M | 596.55 | 7.00 | 6.80 | 2.94 | 1,365 | 555.75M |
| CAVERTON | CAVERTON OFFSHORE SUPPORT GRP PLC | 53.98M | 6.36M | 748.31 | 5.22 | 5.00 | 4.40 | 172 | 271.15M |
| OANDO | OANDO PLC | 11.46M | 5.06M | 126.49 | 56.50 | 61.90 | -8.72 | 1,062 | 671.59M |
| NEIMETH | NEIMETH INTERNATIONAL PHARMACEUTICALS PLC | 10.47M | 3.12M | 234.95 | 5.94 | 5.40 | 10.00 | 373 | 56.21M |
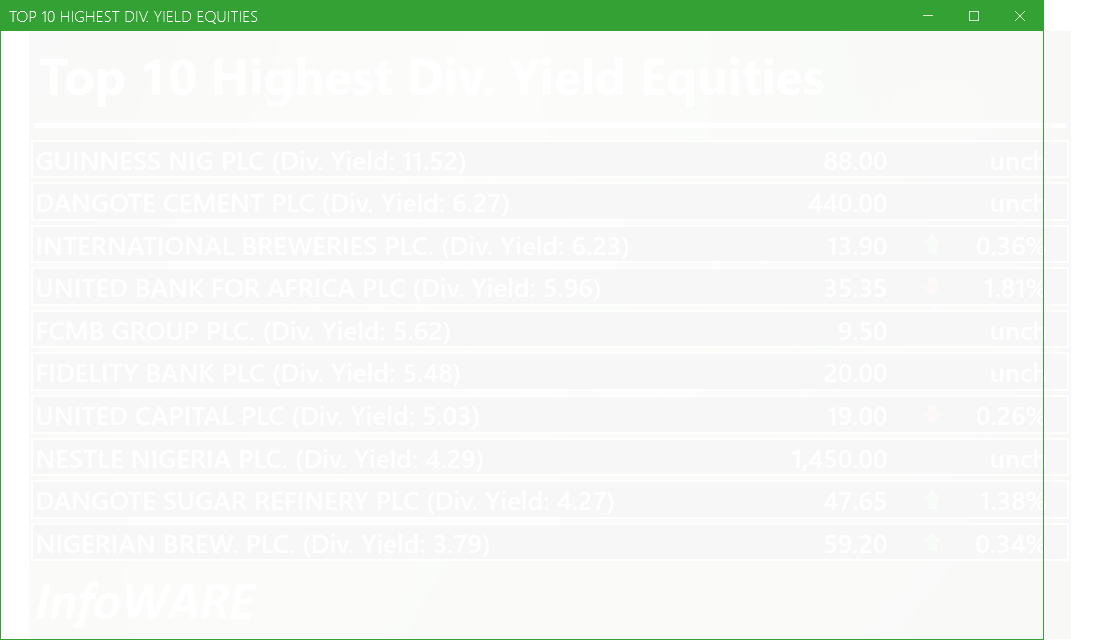
Investment Insights - High Div. Stocks
Dividend stocks distribute a portion of the company earnings to investors on a regular basis and they can a great choice for investors looking for regular income. As an investment or trading strategy, high dividend yield equities provide annual cash payments as against mostly capital gains in the price of a stock. The list in the table below represent the highest dividend paying stocks from the list of the most liquid stocks in the NSE top 30.
For more detailed analysis,
- On InfoWARE Market Data Terminal <HYIELD> <GO>
- On InfoWARE Finance Mobile App ( Android , iPhone & iPad and Windows 10) , "Research"
Investment Insights - Stocks outperforming the ASI but with approximately the same risk
These list of stocks represent equities that are less risky than the ASI but doing better than the ASI (All Shares Index) using the YTD (Year to Date) returns as the measure. The risk is measured by Beta. Beta is an assessment of a stock's tendency to undergo price changes, (its volatility), as well as its potential returns compared to the ASI. It is expressed as a ratio, where a score of 1 represents performance comparable to the ASI, and returns above or below the market may receive scores greater or lower than 1.
For a full list of both positively and negatively corelated stocks visit InfoWARE Market Data Terminal
- On InfoWARE Market Data Terminal <BANL> <GO>
- On InfoWARE Finance Mobile App ( Android , iPhone & iPad and Windows 10)
| Symbol | DivYield | PE | EPS | Beta | %ChgYTD | ASIYTDReturn | BetaDiff |
|---|---|---|---|---|---|---|---|
| HONYFLOUR | 1.40 | 16.28 | 0.31 | 0.99 | 206.36 | 16.30 | 0.01 |
| CAVERTON | 5.52 | 1.15 | 1.57 | 0.98 | 104.71 | 16.30 | 0.02 |
| FIDELITYBK | 5.48 | 13.24 | 1.17 | 0.89 | 17.65 | 16.30 | 0.11 |
| FTNCOCOA | 1.60 | 0.00 | 0.00 | 0.79 | 77.13 | 16.30 | 0.21 |
| NB | 3.79 | 16.95 | 1.60 | 0.79 | 85.00 | 16.30 | 0.21 |
| MAYBAKER | 3.75 | 58.94 | 0.14 | 0.78 | 64.89 | 16.30 | 0.22 |
| UNILEVER | 2.81 | 67.09 | 0.40 | 0.75 | 43.61 | 16.30 | 0.25 |
| VETGOODS | 0.00 | 0.71 | 51.16 | 16.30 | 0.29 | ||
| VETGRIF30 | 0.00 | 0.71 | 17.09 | 16.30 | 0.29 | ||
| CUTIX | 6.52 | 8.81 | 0.26 | 0.70 | 26.88 | 16.30 | 0.30 |
African Markets
| Name | LClose | Change | %Chg |
|---|---|---|---|
| BRVM Stock Exchange | 312.12 | 2.14 | 0.69 |
| Botswana Stock Exchange | 10,383.87 | 8.30 | 0.08 |
| Egyptian Exchange | 33,002.85 | 404.22 | 1.24 |
| Ghana Stock Exchange | 6,245.66 | 0.00 | 0.00 |
| Johannesburg Stock Exchange | 95,968.25 | 657.64 | 0.69 |
| Lusaka Stock Exchange | 20,632.45 | -28.93 | -0.14 |
| Casablanca Stock Exchange | 18,474.97 | 69.94 | 0.38 |
| Malawi Stock Exchange | 319,705.46 | 1,368.85 | 0.43 |
| Nigeria Stock Exchange | 120,772.68 | -485.03 | -0.40 |
| Nairobi Securities Exchange | 149.88 | 1.38 | 0.93 |
| Namibian Stock Exchange | 1,771.02 | 26.52 | 1.52 |
| Rwanda Stock Exchange | 150.43 | 0.00 | 0.00 |
| Uganda Securities Exchange | 1,280.98 | 8.27 | 0.65 |
Nigeria Market Indexes
| Symbol | LClose | %Chg | WTD% | MTD% | QTD% | YTD% | MktCap | Trades |
|---|---|---|---|---|---|---|---|---|
| ASI | 119,995.76 | -0.64 | 1.19 | 7.11 | 13.69 | 16.30 | 20,209 | |
| NGX30 | 4,430.24 | -0.70 | 1.33 | 7.21 | 13.04 | 16.13 | 9,885 | |
| NGXAFRBVI | 2,991.02 | -1.05 | 3.15 | 13.84 | 12.31 | 20.57 | 3,944 | |
| NGXAFRHDYI | 19,662.09 | -0.42 | 2.57 | 6.76 | 18.13 | 15.47 | 4,534 | |
| NGXASEM | 1,595.12 | 0.11 | 0.11 | 0.11 | 0.46 | 0.72 | 20 | |
| NGXBNK | 1,294.48 | -0.77 | 1.96 | 11.31 | 11.51 | 19.04 | 4,210 | |
| NGXCG | 3,457.15 | -0.54 | 1.68 | 10.61 | 14.84 | 22.19 | 9,625 | |
| NGXCNSMRGDS | 2,615.15 | 0.17 | 2.98 | 9.97 | 44.04 | 50.78 | 2,638 | |
| NGXCOMMDTY | 1,047.21 | 0.00 | 0.58 | 5.15 | 4.35 | 4.72 | ||
| NGXGROWTH | 9,109.92 | 4.31 | 5.34 | 16.95 | 23.24 | 17.35 | 245 | |
| NGXINDUSTR | 3,653.43 | -3.64 | 3.73 | 6.06 | 4.68 | 2.29 | 1,824 | |
| NGXINS | 750.31 | -0.60 | 1.74 | 8.65 | 10.29 | -4.56 | 1,034 | |
| NGXLOTUSISLM | 9,233.14 | -0.33 | 2.38 | 10.95 | 22.22 | 32.51 | 3,190 | |
| NGXMAINBOARD | 5,879.75 | -0.82 | 1.02 | 5.90 | 16.17 | 17.50 | 15,543 | |
| NGXMERIGRW | 8,199.49 | -0.19 | 3.20 | 7.16 | 19.53 | 25.70 | 2,840 | |
| NGXMERIVAL | 11,224.13 | -0.77 | 5.26 | 9.33 | 9.04 | 7.61 | 5,081 | |
| NGXOILGAS | 2,444.55 | -1.00 | -2.65 | 4.80 | -0.08 | -9.83 | 354 | |
| NGXPENBRD | 2,179.68 | -0.62 | 0.72 | 7.63 | 15.40 | 19.00 | 15,079 | |
| NGXPENSION | 5,830.11 | -0.33 | 1.86 | 10.99 | 21.80 | 28.59 | 11,145 | |
| NGXPREMIUM | 11,618.88 | -0.31 | 1.53 | 11.81 | 14.30 | 19.38 | 4,421 | |
| NGXSOVBND | 653.01 | 0.15 | 0.15 | -0.50 | 4.17 | 8.56 | 0 |
For more detailed analysis,
- On InfoWARE Market Data Terminal <MKTINS> <GO>
- On InfoWARE Finance Mobile App ( Android, iPhone & iPad and Windows 10) , "Market Indexes"
Find the topic interesting? Will like to comment? Contact Us at solutions@infowarelimited.com
Top News

[XNSA]>> OFF MARKET TRADE
[AIRTELAFRI]>>Corporate Disclosures-<Airtel Africa Plc>
[MERGROWTH]>> DAILY INDICATIVE PRICES
[SIAMLETF40]>> DAILY INDICATIVE PRICES
[XNSA]>> NOTIFICATION OF PRICE ADJUSTMENT
[ETERNA]>>Notice of Meeting -<ETERNA PLC.>
[DANGSUGAR]>>Notice of Meeting -<DANGOTE SUGAR REFINERY PLC>
[PZ]>>Corporate Disclosures-<P Z CUSSONS NIGERIA PLC.>

InfoWARE AI Analyst Weekly Market Report: 27-Jun-2025
Chart Of The Day - ASI Chart Vs ASI Advance Decline Line (YTD) (27-Jun-2025 15:07:30.307)
InfoWARE AI Analyst Daily Market Report: 27-Jun-2025
[AIRTELAFRI]>>Corporate Disclosures-<Airtel Africa Plc>
[XNSA]>> CIS TRAINING ON "RETIREMENT PLANNING AND WEALTH CREATION & MANAGEMENT
[VSPBONDETF]>> DAILY INDICATIVE PRICES
[XNSA]>> NGX FIXED INCOME INDICATIVE PRICE LIST FOR JUN 27, 2025
[ELLAHLAKES]>>Notice of Meeting -<ELLAH LAKES PLC.>
[ETRANZACT]>>Notice of Meeting -<E-TRANZACT INTERNATIONAL PLC>
[XNSA]>> DAILY FUND PRICE SUBMISSION - FCMB ASSET MANAGEMENT LIMITED
[NEWGOLD]>> DAILY INDICATIVE PRICES
Chart Of The Day - ASI Chart Vs ASI Advance Decline Line (YTD) (26-Jun-2025 15:11:15.278)
InfoWARE AI Analyst Daily Market Report: 26-Jun-2025
[XNSA]>> CIS TRAINING ON "RETIREMENT PLANNING AND WEALTH CREATION & MANAGEMENT
[XNSA]>> EMERGING AFRICA DAILY FUND PRICES
[XNSA]>> CORDROS MILESTONE FUNDS' BID & OFFER PRICES
[NEWGOLD]>> DAILY INDICATIVE PRICES
[AIRTELAFRI]>>Corporate Disclosures-<Airtel Africa Plc>
[XNSA]>> NGX FIXED INCOME INDICATIVE PRICE LIST FOR JUN 26
[VETGOODS]>> DAILY INDICATIVE PRICES
[XNSA]>> DAILY FUND PRICE SUBMISSION - FCMB ASSET MANAGEMENT LIMITED
[SIAMLETF40]>> DAILY INDICATIVE PRICES
Get IDIA - the stock trading app for the modern investor
Solutions by Business
Product Suites
Company
Contacts
- 8th Floor,
- South Atlantic Petroleum Towers,
- 1 Adeola Odeku Street,
- Victoria Island,
- Lagos, Nigeria.
- Email: solutions@infowarelimited.com
Follow Us
 |
 |
 |
 |