


InfoWARE AI Analyst Daily Market Report: 24-Jul-2025 | InfoWARE Finance
Get IDIA - the stock trading app for the modern investor


InfoWARE AI Analyst Daily Market Report: 24-Jul-2025
(Source: InfoWARE Terminal, Date: 24-Jul-2025)
Dear Investor,
NGX Daily Market Summary – Thursday, July 24, 2025
Markets finished Thursday on a steady stride, with the NGX All Share Index rising by 0.48% to close at 132,557.43. The YTD return remains robust at 29.09%. Trading activity soared, as turnover climbed by a striking 40.22% to ₦20.97B, with total traded volume at 729.23M shares—marking a clear spike from yesterday’s 625.86M. Market breadth leaned positive (advancers/decliners ratio = 1.21x), with 47 stocks in the green against 39 laggards. Notably, the surge was amplified by outsized trading in select insurance, food, and banking counters. Meanwhile, the Naira eased quietly (-0.05%) against the dollar, pausing at ₦1,530/$1.
Market Breadth & Significant Trends
- Advancers outnumbered decliners (47 to 39), solidifying bullish undertones. Volume gains skewed slightly positive (up for 73 stocks, down for 69).
- Turnover leap (+40.22%) outpaced volume growth—signals high-value trades driving activity, especially among large caps and ETFs.
- Sector rotation is evident: Insurance and select Industrial names stood out via large price swings and volumes (evidenced by unusual volume in REGALINS, CONHALLPLC, and JAPAULGOLD).
Top Gainers and Losers
- Top Gainer: ACADEMY PRESS PLC (ACADEMY) — +10.00% to ₦8.47; solidifying recent momentum (RSI: 63, fresh 15/50DMA crossover).
- SOVEREIGN TRUST INSURANCE PLC (SOVRENINS) — +10.00%, maintaining presence in both daily and YTD gainers, supported by bullish momentum.
- THE INITIATES PLC (TIP): Jumps +9.97% (RSI: 88, overbought zone!) and is also YTD’s best performer (+487%). Potential profit-taking risk is rising.
- Top Loser: FTN COCOA (FTNCOCOA) — -10.00% (but, interestingly, its price crossed above 15DMA—contradictory signal, see Contrarian Section below).
- VETIVA S&P NIGERIA SOVEREIGN BOND ETF (VSPBONDETF): -42.86% — significant ETF weakness, also YTD’s top loser (-14.28%), now in clear bearish territory (price substantially below 15DMA and 50DMA).
Deeper Insights and Trends
- Implication of Turnover Increase: The 40.22% jump in turnover, outstripping volume, reflects institutional repositioning—likely in large caps, ETFs, and high-beta names. This is supported by the institutional trade value now comprising 90.28% of the day’s total value.
- Advancing vs. Declining: Positive breadth (1.21x) cements bullish bias, though the narrowing gap suggests selectivity; midsmall caps and insurance stocks are fueling breadth.
-
Notables in Unusual Volume:
- CONSOLIDATED HALLMARK INSURANCE (CONHALLPLC): +810% vs its 90d avg; watch for spillover into next session.
- REGALINS, JAPAULGOLD, GUINEAINS: Insurance, gold/energy, and micro-cap names attracting speculative flows (likely retail-driven spikes).
- NIGERIAN BREWERIES (NB): Institutional quality and a defensive tilt; persistent high volume with mild price retreat may hint at supply absorption by value-seeking buyers.
-
YTD Gainers & Momentum Stocks: Overlap
- TIP (THE INITIATES PLC): Present both as top gainer today and YTD (+487%), with extremely high RSI (88), a strong MACD, and 15DMA above 50DMA (bullish continuation). However, these overbought signals flag caution—mean reversion possible.
- ACADEMY also features both in daily and YTD gainers list (+168.89% YTD, RSI 63); consolidating a strong uptrend but approaching overbought levels.
- SOVRENINS sits on both short and medium-term top lists, yet with a more moderate RSI (52), suggesting more ‘steady’ momentum; 15DMA > 50DMA.
-
Bullish Momentum Stocks:
- OANDO: Crossover above 15DMA with healthy volume; RSI in mid-range—still room to run before overbought territory is reached.
- MCNICHOLS and LINKASSURE: Bullish price moves x 15DMA surge coupled with high PE multiples and low betas—potential momentum and defensive combo.
-
Bearish Momentum Stocks:
- JOHNHOLT and VSPBONDETF both feature in daily and YTD top losers and in bearish momentum tables—suggests a deeply entrenched downtrend needing fundamental reversal to spark buying interest.
- WAPIC, LIVESTOCK, FIDELITYBK: Price slips below 15DMA signal growing seller dominance (note: FIDELITYBK’s fall below 15DMA is the first in many weeks).
Contrarian Signals
- FTN COCOA (FTNCOCOA): Despite a 10% loss today and appearance among top daily losers, it crossed above its 15DMA and has no negative divergence on MACD. This creates a mixed technical read—watch for reversal attempts as short-term technical buyers meet longer-term sellers.
- SOVRENINS: RSI of 52—staying below overbought levels, yet up 16% YTD and showing 15DMA > 50DMA, signals possible further grind higher.
- TIP: Exceptionally high RSI (88) is screaming "overbought”, but price momentum (MACD positive, large move, and bullish moving average pattern) still strong; active traders should beware of abrupt reversals.
Sector Heatmap
| Sector | Top Performer (Symbol) | Top Laggard (Symbol) | Avg. % Chg | Dominant Flow |
|---|---|---|---|---|
| Insurance | CONHALLPLC (+0.00%), SOVRENINS (+10.00%) | VERITASKAP (-4.42%), WAPIC (-0.84%) | +3.31% | Heavy Retail & Unusual Volume |
| Banking | ZENITHBANK (+2.38%), UBA (-0.32%) | FIDELITYBK (-3.40%) | +0.52% | Institutional |
| ETF/Bonds | LOTUSHAL15 (0.00%) | VSPBONDETF (-42.86%) | -7.85% | Inst. Selling |
| Food Prod. | HONYFLOUR (+1.85%), DANGSUGAR (-0.50%) | LIVESTOCK (-6.67%) | +0.63% | Mixed |
| Industrial/Other | ACADEMY (+10.00%), TIP (+9.97%) | IMG (-9.89%) | +1.52% | Selective |
Dividend-Beta Matrix (Selected)
| Stock | DivY (%) | Beta | Momentum | Implication |
|---|---|---|---|---|
| OANDO | 1.15 | 1.12 | Bullish 15DMA Cross | Momentum + Defensive Div. |
| MCNICHOLS | 5.88 | -0.11 | Bullish 15DMA Cross | High Dividend, Lower Beta: Defensive + Upside |
| UCAP | 5.03 | 0.74 | Bullish 15DMA Cross | Yield + Relative Stability |
| FIDELITYBK | 5.48 | 0.89 | Bearish 15DMA Cross | Yield, but trend watch: possible pullback zone |
| LINKASSURE | 5.56 | 0.41 | Bullish 15DMA Cross | High yield, low beta—steady upside |
- MCNICHOLS, UCAP, FIDELITYBK, LINKASSURE—all pay attractive dividends and appear in momentum rankings; this is rare and provides a blend of income and capital appreciation for risk-averse traders.
- Watch FIDELITYBK specifically: high dividend but recent bearish cross below 15DMA—if the macro backdrop worsens, dividend alone may not support the stock.
Institutional Clustering Alerts
- ZENITHBANK: Institutional trade value share is 20.17% of total institutional trade value today—indicates strong institutional involvement, possibly linked with quarterly portfolio adjustments or flow chasing yield.
- ACCESSCORP and UBA—both saw heavy institutional and retail interest, suggesting broad confidence in leading banks, though retail trade volume remains a fraction of institutional volume.
Market Trades Activity Breakdown
- Split: Institutional investors contributed just 40.43% of total trades but 90.28% of total value (₦20.46BN), highlighting block trades and large orders in sizable blue chips. Retail made up 59.57% of trades, but only 9.72% of value—confirming their focus on lower-priced, higher-velocity stocks.
-
Most traded by institution:
- ACCESSCORP, DANGSUGAR, OKOMUOIL, UBA, ZENITHBANK—all blue-chip, high-liquidity.
-
Most traded by retail:
- ACCESSCORP, DANGSUGAR, UBA, GTCO, ZENITHBANK—again, blue-chip overlap with institutions, suggesting alignment in favoured names for today’s session. Only GTCO (retail trade), not institutional top 5.
-
Correlation/Patterns:
- Institutional orders concentrated in banks and leading industrials coincide with high turnover and limited price gains—volume absorption rather than speculative markup.
- Retail is chasing volatility and speculative names—also seen with high activity spikes in insurance microcaps and unusual volume in previously illiquid names.
Trader Suggestions & Opportunities
- Bullish Play: Traders can monitor SOVRENINS, OANDO, MCNICHOLS, and UCAP for potential trend continuation—especially as they combine momentum with income (dividend).
- Caution Advised: Beware overbought conditions in TIP (RSI 88—likely ripe for profit-taking!) and VSPBONDETF (ETF weakness + price/MO break).
- Contrarian Watch: FTNCOCOA’s technical divergence provides a "fast money” setup if sellers exhaust and price reclaims today’s losses.
- Institutional Alignment: Positioning alongside institutional flows, especially in ZENITHBANK and ACCESSCORP, could offer steadier risk-adjusted returns.
- High-Yield Watch: Diligently track dividend stocks coinciding with bullish momentum (MCNICHOLS, LINKASSURE)—favorable for investors seeking cushion against volatility.
Top 5 YTD Gainers & Losers (For Thursday Reference)
| Top 5 YTD Gainers | |||||
|---|---|---|---|---|---|
| Name | Symbol | YTD % | RSI | Momentum | Notes |
| THE INITIATES PLC | TIP | +486.80 | 88.1 | Very Bullish | Extreme RSI; Overbought caution |
| ACADEMY PRESS PLC. | ACADEMY | +168.89 | 63.0 | Bullish | Strong uptrend, still room to run |
| NIGERIAN EXCHANGE GROUP | NGXGROUP | +192.84 | 85.3 | Bullish | Momentum-driven |
| NAHCO | NAHCO | +143.75 | 85.2 | Bullish | High RSI, but strong trend |
| SOVEREIGN TRUST INSURANCE PLC | SOVRENINS | +16.26 | 52.5 | Steady Momentum | Diversified |
| Top YTD Losers | |||||
|---|---|---|---|---|---|
| Name | Symbol | YTD % | RSI | Momentum | Notes |
| VETIVA S&P NIGERIA SOVEREIGN BOND ETF | VSPBONDETF | -14.28 | 58.5 | Bearish | Large ETF move, risk-off |
| OMATEK VENTURES PLC | OMATEK | +50.00 | 56.2 | Bounce? | Some signs of reversal |
| SECURE ELECTRONIC TECH PLC | NSLTECH | +34.78 | 61.8 | Bearish Today | Short-term weakness |
| THOMAS WYATT NIG. PLC. | THOMASWY | +47.37 | 56.9 | Steady | Volatility |
| JOHN HOLT PLC. | JOHNHOLT | +3.98 | 62.9 | Bearish Today | See Contrarian section |
* Color legend: green = bullish/positive, red = bearish/negative, yellow = neutral/shifting
Summary: Key Hidden Insights
- Stock-overlap Alert: TIP, ACADEMY, and SOVRENINS maintain places on both daily and YTD gainers, combining momentum with trend reliability.
- Volume-Price Divergence: Large unusual volume (e.g., REGALINS, CONHALLPLC) outpaces price appreciation—possible emergence of new buyers or early institutional stake-building.
- Beware of Overbought RSI Flags: TIP, NGXGROUP, and NAHCO; these could be "crowded trades” primed for sharp reversals.
- Dividend + Momentum Pairings: MCNICHOLS, UCAP, LINKASSURE, and FIDELITYBK thread the needle between income and trend—distinct but potentially short-lived, especially if macro stress rises.
- Bullish-Bearish Sector Divergence: ETF and selected industrials show risk-off shift, while insurance and food sectors have retail-driven resilience.
Actionable Takeaways for Traders
- Momentum Seekers: Double down on stocks with rising RSI but not yet overbought (e.g., ACADEMY, MCNICHOLS), using trailing stops.
- Contrarian/Catalyst Traders: Watch for bounce/reversal in FTNCOCOA and potential mean-reversion in TIP and NGXGROUP.
- Defensive/Income Portfolios: Seek high-yield stocks experiencing bullish crossovers, but have a risk plan for sudden sector rotation.
- Institutional Follower Strategy: Lean into stocks like ZENITHBANK and ACCESSCORP aligning with fund flows and block trades’ momentum.
|
Top ASI Gainers Over Last 5 Trading Days
|
Top ASI Losers Over Last 5 Trading Days
|
For more detailed analysis, on InfoWARE Market Data Terminal <NSEPERF> <GO>
On InfoWARE Finance Mobile App (Android, iPhone & iPad, Windows Phone and Windows 8/10), "Top Gainers & Losers"
ACADEMY PRESS PLC. (ACADEMY) topped the advancers list closing at N8.47 with a gain of 10.00% followed by FTN COCOA PROCESSORS PLC (FTNCOCOA) which closed at N6.60 with a gain of 10.00%.
On the flip side VETIVA S & P NIGERIA SOVEREIGN BOND ETF (VSPBONDETF) and ASSOCIATED BUS COMPANY PLC (ABCTRANS) topped the decliners log with a loss of -42.86% at a close of N300.00, and -10.00% to close the day at N4.59 respectively.
| Symbol | LClose | %Chg |
|---|---|---|
| ACADEMY | 8.47 | 10.00 |
| FTNCOCOA | 6.60 | 10.00 |
| SOVRENINS | 1.43 | 10.00 |
| RTBRISCOE | 3.75 | 9.97 |
| TIP | 14.67 | 9.97 |
| Symbol | LClose | %Chg |
|---|---|---|
| VSPBONDETF | 300.00 | -42.86 |
| ABCTRANS | 4.59 | -10.00 |
| JOHNHOLT | 8.10 | -10.00 |
| UNIONDICON | 9.00 | -10.00 |
| IMG | 38.25 | -9.89 |
For more detailed analysis,
- On InfoWARE Market Data Terminal <TOPG> <GO>
- On InfoWARE Finance Mobile App ( Android, iPhone & iPad and Windows 10) , "Top Gainers & Losers"
Currency Market
In the currency market, the Naira fell 0.05%(-0.80) against the Dollar to settle at 1 to 1NSE: Bull Signal - Price crossed above 15 Day MA
This signal implies these stocks are under buying pressure and the price might continue to rise and therefore positions should be monitored closely. Further suggested analysis include looking at the overall market (ASI) to see if the uptrend is market wide, sector wide or specific to the stock. Portfolio managers tend to use this as a signal to do more research to add to their positions or lock in some profits. Typically further analysis should be done using commands like PC and RV on the InfoWARE Market Data Terminal. Another command is ALERTS to set price triggers for possible exit or entry as necessary
For more detailed analysis,
- On InfoWARE Market Data Terminal <NSEPERF> <GO>
- On InfoWARE Finance Mobile App ( Android , iPhone & iPad and Windows 10) , "Top Gainers & Losers"
| Symbol | Price | %Chg | 15DMA | PE | EPS | DivY | MktCap | Vol | Trades | Value | LstTradeTime |
|---|---|---|---|---|---|---|---|---|---|---|---|
| FTNCOCOA | 6.60 | 9.09 | 6.29 | 0.00 | 0.00 | 1.60 | 25.74B | 13.41M | 339.00 | 87.18M | 24-Jul-2025 14:33:20.880 |
| SOVRENINS | 1.43 | 9.09 | 1.33 | 27.95 | 0.03 | 3.75 | 16.25B | 8.20M | 98.00 | 11.66M | 24-Jul-2025 14:30:25.483 |
| RTBRISCOE | 3.75 | 9.07 | 3.70 | 0.00 | 0.00 | 4.35 | 4.41B | 4.83M | 88.00 | 17.89M | 24-Jul-2025 14:30:25.000 |
| OANDO | 57.40 | 9.06 | 53.09 | 24.10 | 2.53 | 1.15 | 713.56B | 7.73M | 624.00 | 439.15M | 24-Jul-2025 14:30:22.953 |
| MCNICHOLS | 3.56 | 8.71 | 3.44 | 26.80 | 0.05 | 5.88 | 2.56B | 4.49M | 105.00 | 14.78M | 24-Jul-2025 14:33:32.627 |
| LINKASSURE | 1.55 | 7.10 | 1.52 | 59.89 | 0.02 | 5.56 | 21.70B | 12.03M | 53.00 | 18.30M | 24-Jul-2025 14:33:20.913 |
| SUNUASSUR | 4.97 | 6.44 | 4.84 | 0.00 | 0.00 | 0.99 | 28.88B | 1.08M | 47.00 | 5.25M | 24-Jul-2025 14:33:21.037 |
| UCAP | 21.00 | 2.14 | 20.66 | 19.15 | 0.93 | 5.03 | 126.00B | 7.33M | 274.00 | 153.54M | 24-Jul-2025 14:30:27.567 |
| HONYFLOUR | 27.00 | 1.85 | 26.85 | 16.28 | 0.31 | 1.40 | 214.12B | 2.57M | 372.00 | 68.05M | 24-Jul-2025 14:30:19.617 |
| ETERNA | 42.25 | 0.00 | 42.23 | 29.51 | 0.75 | 0.68 | 55.10B | 68.28K | 55.00 | 2.74M | 24-Jul-2025 14:30:18.750 |
NSE: BEAR Signal - Price crossed below 15 Day MA
This signal implies these stocks are under selling pressure and the price might continue to slide and therefore positions should be monitored closely. Further suggested analysis include looking at the overall market (ASI) to see if the downtrend is market wide, sector wide or specific to the stock. If the overal market trend is upwards, then since these stocks are heading in the opposite direction, then further analysis should be done using commands like PC and RV on the InfoWARE Market Data Terminal. Another command is ALERTS to set price triggers for possible exit is necessar
For more detailed analysis,
- On InfoWARE Market Data Terminal <BEARM> <GO>
- On InfoWARE Finance Mobile App ( Android , iPhone & iPad and Windows 10)
| Symbol | Price | %Chg | 15DMA | PE | EPS | DivY | MktCap | Vol | Trades | Value | LstTradeTime |
|---|---|---|---|---|---|---|---|---|---|---|---|
| WAPIC | 2.38 | -0.84 | 2.40 | 72.55 | 0.02 | 2.56 | 57.10B | 1.26M | 89.00 | 3.00M | 24-Jul-2025 14:30:39.383 |
| CILEASING | 6.80 | -2.94 | 7.10 | 6.50 | 0.64 | 1.20 | 5.32B | 1.71M | 96.00 | 11.55M | 24-Jul-2025 14:30:18.217 |
| FIDELITYBK | 20.60 | -3.40 | 20.75 | 13.24 | 1.17 | 5.48 | 596.88B | 15.70M | 637.00 | 325.04M | 24-Jul-2025 14:33:20.850 |
| MERVALUE | 180.00 | -3.89 | 188.39 | 0.00 | 0.00 | 32.00 | 2.00 | 6.10K | 24-Jul-2025 14:33:21.637 | ||
| VERITASKAP | 1.13 | -4.42 | 1.17 | 48.77 | 0.02 | 4.17 | 15.67B | 8.52M | 89.00 | 9.60M | 24-Jul-2025 14:30:39.050 |
| LIVESTOCK | 9.00 | -6.67 | 9.20 | 0.00 | 0.00 | 2.94 | 27.00B | 1.69M | 121.00 | 15.30M | 24-Jul-2025 14:30:21.100 |
| HMCALL | 4.30 | -9.30 | 4.63 | 0.00 | 0.00 | 0.00 | 0.00 | 385.77K | 33.00 | 1.73M | 24-Jul-2025 14:30:19.540 |
| NSLTECH | 0.93 | -10.75 | 0.98 | 0.00 | 0.00 | 15.87 | 5.24B | 19.93M | 198.00 | 19.14M | 24-Jul-2025 14:30:22.907 |
| FGS202650 | 90.26 | -10.79 | 91.35 | 0.00 | 0.00 | 1.04K | 2.00 | 938.67K | 24-Jul-2025 14:30:45.700 | ||
| JOHNHOLT | 8.10 | -11.11 | 8.87 | 8.80 | 0.91 | 1.25 | 3.15B | 290.17K | 26.00 | 2.35M | 24-Jul-2025 14:30:20.367 |
| VSPBONDETF | 300.00 | -75.00 | 396.15 | 0.00 | 0.00 | 459.00 | 6.00 | 238.45K | 24-Jul-2025 14:33:21.907 |
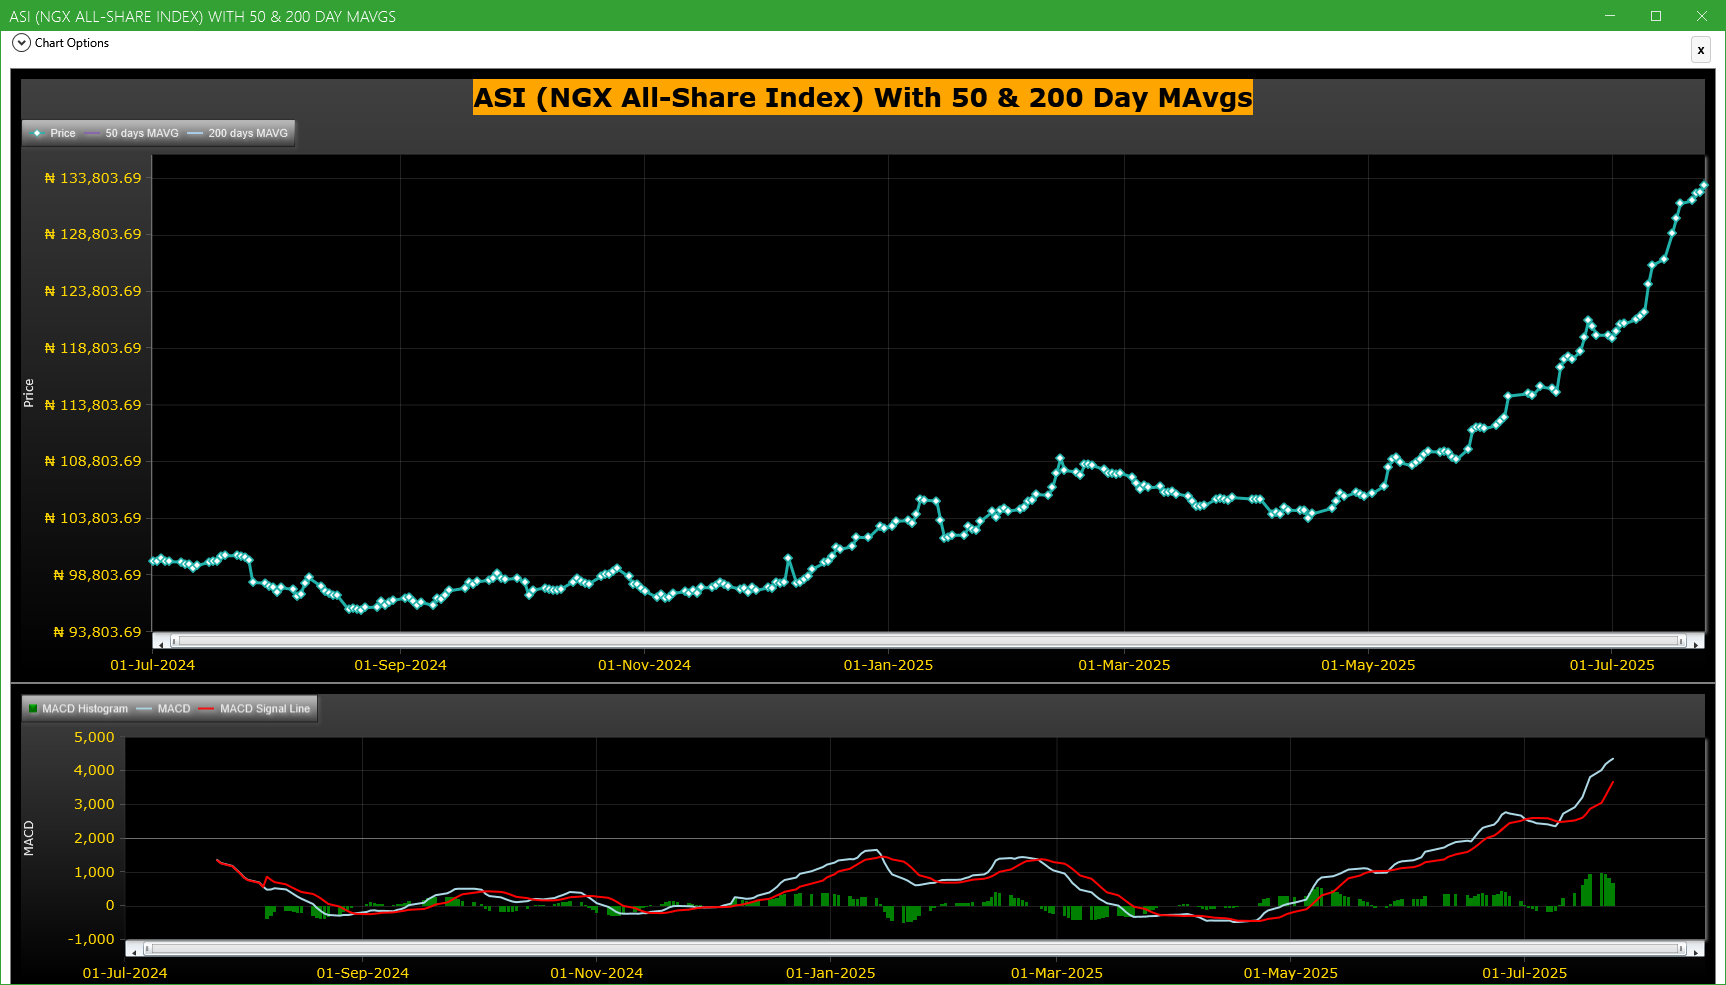
Market Trend - ASI (NGX All-Share-Index) With 50 & 200 Day MAvgs Chart
Technical traders typically use the 50 & 200 day moving averages to aid in choosing
where to enter or exit a position, which then causes these levels to act as strong
support or resistance. As a general guideline, if the price is above a moving average,
the trend is up. If the price is below a moving average, the trend is down.
It is important to note that critics of technical analysis say that moving averages act
as support and resistance because so many traders use these indicators to inform their
trading decisions. Also moving averages tend to work quite well in strong trending conditions
but poorly in choppy or ranging conditions.
Trading Strategies: Crossovers
Crossovers are one of the main moving average strategies. The first type is a price crossover,
which is when the price crosses above or below a moving average to signal a potential change
in trend. Another strategy is to apply two moving averages to a chart: one longer and one
shorter. When the shorter-term MA crosses above the longer-term MA, it is a buy signal, as
it indicates that the trend is shifting up. This is known as a golden cross. Meanwhile, when
the shorter-term MA crosses below the longer-term MA, it is a sell signal, as it indicates that
the trend is shifting down. This is known as a dead/death cross
For more detailed analysis,
- On InfoWARE Market Data Terminal <CI> <GO>
- On InfoWARE Finance Mobile App ( Android , iPhone & iPad and Windows 10) , "Research"
Unusual Volume: Volume traded is more than double the 90 day moving average (All exchanges; ASI & ASem). For more detailed analysis,
- On InfoWARE Market Data Terminal <UV> <GO>
- On InfoWARE Finance Mobile App ( Android , iPhone & iPad and Windows 10)
| Symbol | Name | Volume | 90DAvgVol | %VolChg | Price | LClose | %Chg | Trades | Value |
|---|---|---|---|---|---|---|---|---|---|
| JAPAULGOLD | JAPAUL GOLD & VENTURES PLC | 83.79M | 32.92M | 154.52 | 2.82 | 2.78 | 1.44 | 240 | 231.76M |
| CONHALLPLC | CONSOLIDATED HALLMARK INSURANCE PLC | 55.71M | 6.12M | 810.23 | 3.00 | 3.00 | 0.00 | 209 | 169.05M |
| NB | NIGERIAN BREW. PLC. | 41.11M | 15.77M | 160.74 | 72.25 | 72.50 | -0.34 | 287 | 2.97B |
| REGALINS | REGENCY ALLIANCE INSURANCE COMPANY PLC | 39.40M | 4.68M | 741.62 | 0.73 | 0.76 | -3.95 | 139 | 28.84M |
| GUINEAINS | GUINEA INSURANCE PLC. | 24.04M | 5.01M | 380.17 | 0.86 | 0.90 | -4.44 | 115 | 19.83M |
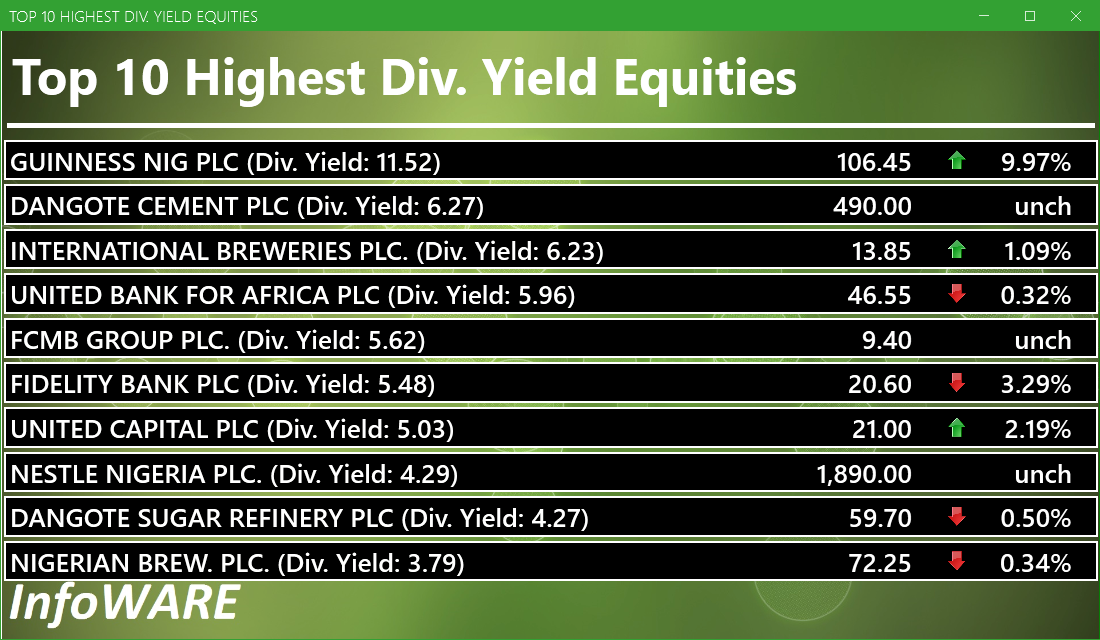
Investment Insights - High Div. Stocks
Dividend stocks distribute a portion of the company earnings to investors on a regular basis and they can a great choice for investors looking for regular income. As an investment or trading strategy, high dividend yield equities provide annual cash payments as against mostly capital gains in the price of a stock. The list in the table below represent the highest dividend paying stocks from the list of the most liquid stocks in the NSE top 30.
For more detailed analysis,
- On InfoWARE Market Data Terminal <HYIELD> <GO>
- On InfoWARE Finance Mobile App ( Android , iPhone & iPad and Windows 10) , "Research"
African Markets
| Name | LClose | Change | %Chg |
|---|---|---|---|
| BRVM Stock Exchange | 309.23 | 0.06 | 0.02 |
| Botswana Stock Exchange | 10,495.71 | 65.71 | 0.63 |
| Egyptian Exchange | 34,125.12 | 321.14 | 0.95 |
| Ghana Stock Exchange | 6,436.54 | 0.00 | 0.00 |
| Johannesburg Stock Exchange | 100,179.88 | 854.20 | 0.86 |
| Lusaka Stock Exchange | 20,945.18 | 6.28 | 0.03 |
| Casablanca Stock Exchange | 19,085.27 | -107.48 | -0.56 |
| Malawi Stock Exchange | 331,800.96 | 4,063.94 | 1.24 |
| Nairobi Securities Exchange | 160.98 | 1.06 | 0.66 |
| Namibian Stock Exchange | 1,810.53 | 1.27 | 0.07 |
| Rwanda Stock Exchange | 150.43 | 0.00 | 0.00 |
| Tunis Stock Exchange | 11,857.13 | 29.57 | 0.25 |
| Uganda Securities Exchange | 1,327.65 | 6.61 | 0.50 |
Nigeria Market Indexes
| Symbol | LClose | %Chg | WTD% | MTD% | QTD% | YTD% | MktCap | Trades |
|---|---|---|---|---|---|---|---|---|
| ASI | 133,199.97 | 0.48 | 1.04 | 11.24 | 11.24 | 29.09 | 21,030 | |
| NGX30 | 4,888.34 | 0.43 | 0.97 | 3.49 | 3.49 | 28.14 | 10,914 | |
| NGXAFRBVI | 3,671.99 | 0.66 | 2.20 | 3.63 | 3.63 | 48.02 | 4,193 | |
| NGXAFRHDYI | 22,758.57 | 0.72 | 2.01 | 8.82 | 8.82 | 33.66 | 4,733 | |
| NGXASEM | 1,446.38 | 0.00 | 0.00 | -9.32 | -9.32 | -8.67 | 8 | |
| NGXBNK | 1,555.10 | 1.05 | 1.62 | 2.93 | 2.93 | 43.01 | 4,790 | |
| NGXCG | 4,083.08 | 0.74 | 1.52 | 18.74 | 18.74 | 44.32 | 10,325 | |
| NGXCNSMRGDS | 2,851.26 | 0.30 | 1.10 | -17.80 | -17.80 | 64.40 | 3,031 | |
| NGXCOMMDTY | 1,074.15 | 1.17 | 0.52 | 2.57 | 2.57 | 7.41 | ||
| NGXGROWTH | 9,738.95 | 1.47 | 1.65 | 2.41 | 2.41 | 25.46 | 380 | |
| NGXINDUSTR | 4,563.59 | 0.25 | 2.49 | 29.54 | 29.54 | 27.77 | 1,751 | |
| NGXINS | 886.18 | 2.72 | 3.12 | 19.98 | 19.98 | 12.72 | 1,433 | |
| NGXLOTUSISLM | 10,608.59 | 0.71 | 1.95 | 10.80 | 10.80 | 52.25 | 3,371 | |
| NGXMAINBOARD | 6,394.85 | 0.52 | 1.02 | 8.41 | 8.41 | 27.80 | 15,820 | |
| NGXMERIGRW | 9,382.81 | 1.31 | 1.28 | -2.79 | -2.79 | 43.84 | 2,951 | |
| NGXMERIVAL | 13,783.48 | 0.75 | 3.30 | 15.36 | 15.36 | 32.15 | 6,280 | |
| NGXOILGAS | 2,436.32 | 1.32 | 0.47 | 1.85 | 1.85 | -10.14 | 361 | |
| NGXPENBRD | 2,442.70 | 0.40 | 1.00 | 6.24 | 6.24 | 33.36 | 16,349 | |
| NGXPENSION | 6,578.40 | 0.68 | 0.94 | 3.52 | 3.52 | 45.09 | 12,167 | |
| NGXPREMIUM | 13,407.84 | 0.41 | 1.08 | 16.90 | 16.90 | 37.76 | 4,830 | |
| NGXSOVBND | 668.16 | 0.00 | 0.44 | 2.24 | 2.24 | 11.07 | 0 |
For more detailed analysis,
- On InfoWARE Market Data Terminal <MKTINS> <GO>
- On InfoWARE Finance Mobile App ( Android, iPhone & iPad and Windows 10) , "Market Indexes"
Find the topic interesting? Will like to comment? Contact Us at solutions@infowarelimited.com
Top News

InfoWARE AI Analyst Weekly Market Report: 25-Jul-2025
Chart Of The Day - ASI Chart Vs ASI Advance Decline Line (YTD) (25-Jul-2025 15:07:35.407)
InfoWARE AI Analyst Daily Market Report: 25-Jul-2025

[CUTIX]>>Corporate Disclosures-<CUTIX PLC.>
[VFDGROUP]>>Notice of Meeting -<VFD Group Plc>
[TRANSCOHOT]>>Corporate Disclosures-<TRANSCORP HOTELS PLC>
[TRANSCOHOT]>>Corporate Disclosures-<TRANSCORP HOTELS PLC>
[TRANSCOHOT]>>Corporate Disclosures-<TRANSCORP HOTELS PLC>
[CHAMPION]>>Corporate Disclosures-<CHAMPION BREW. PLC.>
[MERGROWTH]>> DAILY INDICATIVE PRICES
[LOTUSHAL15]>> DAILY INDICATIVE PRICES
[VSPBONDETF]>> DAILY INDICATIVE PRICES
[XNSA]>> NGX FIXED INCOME INDICATIVE PRICE LIST FOR JUL 25, 2025
[ETERNA]>>Corporate Disclosures-<ETERNA PLC.>
[ETRANZACT]>>Corporate Disclosures-<E-TRANZACT INTERNATIONAL PLC>
[XNSA]>> CORDROS MILESTONE FUNDS' BID & OFFER PRICES
[XNSA]>> FULL SUSPENSION IN TRADING AND DELISTING OF THE SHARES
[SIAMLETF40]>> DAILY INDICATIVE PRICES
[XNSA]>> NOTIFICATION OF PRICE ADJUSTMENT
Chart Of The Day - ASI Chart Vs ASI Advance Decline Line (YTD) (24-Jul-2025 15:07:22.343)
InfoWARE AI Analyst Daily Market Report: 24-Jul-2025
[XNSA]>> DAILY FUND PRICE SUBMISSION - FCMB ASSET MANAGEMENT LIMITED
[XNSA]>> CORDROS MILESTONE FUNDS' BID & OFFER PRICES
[NCR]>>Corporate Disclosures-<NCR (NIGERIA) PLC.>
[AIRTELAFRI]>>Corporate Disclosures-<Airtel Africa Plc>
[MERGROWTH]>> DAILY INDICATIVE PRICES
[XNSA]>> NGX FIXED INCOME INDICATIVE PRICE LIST FOR JUL 24, 2025
[VSPBONDETF]>> DAILY INTICATIVE PRICES
[AIRTELAFRI]>>Corporate Disclosures-<Airtel Africa Plc>
[STANBICETF30]>> DAILY INDICATIVE PRICES
Get IDIA - the stock trading app for the modern investor
Solutions by Business
Product Suites
Company
Contacts
- 8th Floor,
- South Atlantic Petroleum Towers,
- 1 Adeola Odeku Street,
- Victoria Island,
- Lagos, Nigeria.
- Email: solutions@infowarelimited.com
Follow Us
 |
 |
 |
 |