


InfoWARE AI Analyst Daily Market Report: 25-Jul-2025 | InfoWARE Finance
Get IDIA - the stock trading app for the modern investor


InfoWARE AI Analyst Daily Market Report: 25-Jul-2025
(Source: InfoWARE Terminal, Date: 25-Jul-2025)
Dear Investor,
NGX Market Wrap – Friday, July 25, 2025
The Nigerian equities market capped off the week with a robust +0.94% gain on the NGX All-Share Index (ASI), closing at 133,200.00 – notching a year-to-date (YTD) performance of +30.31%. Market breadth was strong at 2.35x, with 54 advancers streaking past 23 decliners. Turnover also edged higher by +4.27% to ₦21.87 billion, even as volume moderated compared to Thursday (637.54M vs. 729.23M shares). Market momentum remains broad, but beneath the surface, rotations, high-volume breakouts, and institutional clustering served up nuanced opportunities – and pitfalls – for discerning traders.
Market Breadth & Trend Insights
- Broad-based rally: Advancers outnumbered decliners (54 vs 23)—a strong sign of widespread bullish sentiment.
- Advancing volumes: Volume was up for 77 companies, down for 64; turnover rose +4.27% even as overall volume slipped, indicating money is chasing higher-priced stocks.
- Sector performance: Financials and Consumer Goods led price and volume action; Oil & Gas, Insurance showed mixed trends with notable bearish reversals.
Top Gainers & Losers – Key Callouts
| Symbol | Stock Name | % Change | RSI | MACD | 15DMA vs 50DMA |
|---|---|---|---|---|---|
| CHAMPION | CHAMPION BREW. PLC. | +10.00% | 48.4 | 0.80 | 13.10 vs 9.59 ↑ |
| IKEJA HOTEL | IKEJA HOTEL PLC | +10.00% | 68.6 | 1.38 | 19.76 vs 16.47 ↑ |
| UNILEVER | UNILEVER NIGERIA PLC. | +10.00% | 96.7 | 3.43 | 59.36 vs 50.82 ↑ |
| TRIPPLEG | TRIPPLE GEE AND COMPANY PLC. | -10.00% | 72.4 | 0.52 | 3.70 vs 2.59 ↓ |
| STANBICETF30 | STANBIC IBTC ETF 30 | -9.99% | 71.2 | 37.23 | 490.46 vs 375.49 ↓ |
| SUNUASSUR | SUNU ASSURANCES NIGERIA PLC. | -6.64% | 51.0 | -0.03 | 4.82 vs 5.01 ↓ |
- Big winners: CHAMPION, IKEJA HOTEL, and UNILEVER all hit +10% gains with robust volume. UNILEVER's RSI 96.7 and bullish MACD flag an "overbought" alert – watch for profit-taking soon!
- Steepest falls: TRIPPLEG (-10%) and STANBICETF30 (-10%) both had high RSI (>70) combined with negative price momentum – potential for oversold snapbacks or deeper unwinding.
- Unusual volume: SUNUASSUR and LEGENDINT posted trades 7x and 2x their 90-day average, respectively—red-hot attention from both speculators and institutions.
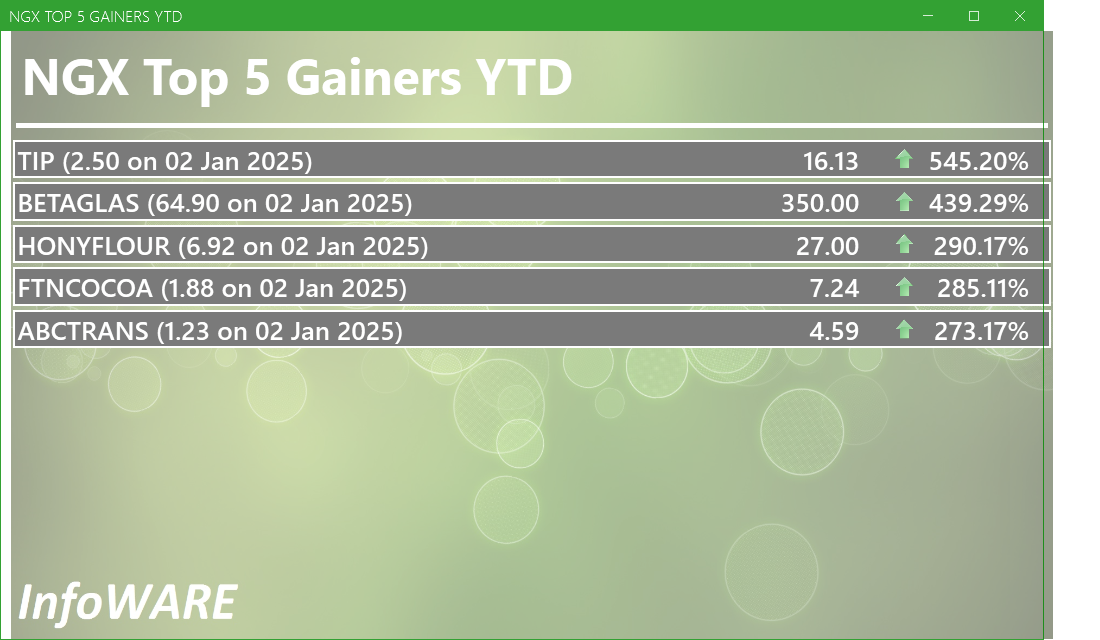
YTD Top Gainers (Momentum Check)
| Stock | YTD % | 5D % | RSI | MACD |
|---|---|---|---|---|
| TIP | +545.2% | +46.2% | 90.5 | 1.47 |
| ACADEMY | +195.6% | +33.0% | 68.5 | 0.77 |
| NAHCO | +143.8% | +17.1% | 85.2 | 6.29 |
| PRESCO | +226.3% | +16.5% | 92.4 | 68.7 |
| WEMABANK | +118.7% | +16.4% | 81.7 | 0.89 |
YTD Top Losers
| Stock | YTD % | 5D % | RSI | MACD |
|---|---|---|---|---|
| VSPBONDETF | -8.6% | -54.3% | 46.0 | 35.5 |
| TRIPPLEG | +56.0% | -18.8% | 72.4 | 0.52 |
| TANTALIZER | +9.3% | -15.7% | 51.7 | 0.09 |
| ABCTRANS | +273.2% | -16.5% | 60.8 | 0.67 |
| MEYER | +95.7% | -12.7% | 52.9 | 2.07 |
Bullish & Bearish Momentum (With RSI, MACD, 15/50MA)
| Type | Symbol | Price | %Chg | RSI | 15DMA | 50DMA | Bullish? |
|---|---|---|---|---|---|---|---|
| Bullish | MERVALUE | 198.00 | +9.09% | 60.4 | 191.22 | - | Yes |
| Bullish | INTBREW | 15.20 | +8.88% | - | 14.42 | - | Yes |
| Bearish | CAVERTON | 7.00 | -2.14% | - | 7.12 | - | No |
| Bearish | TRIPPLEG | 3.51 | -11.11% | 72.4 | 3.70 | - | No |
| Bearish | SUNUASSUR | 4.64 | -7.11% | 51.0 | 4.82 | - | No |
- Bullish crossovers: MERVALUE, INTBREW, CILEASING, FCMB and FIDELITYBK all broke above their 15DMA—considered a short-term accumulation signal.
- Bearish breakdowns: CAVERTON, SUNUASSUR, TRIPPLEG, STANBICETF30—all fell below 15DMA, signaling building selling pressure.
- Overbought Red Flags: RSI for UNILEVER (96.7), TIP (90.5), PRESCO (92.4) are all in extreme "overbought" territory—likely to see profit-taking or mean reversion soon.
Contrarian Signals
- CHAMPION BREW. PLC. (CHAMPION): RSI at 48.4, MACD positive (0.80) and short-term momentum up (+10% today); but YTD only -9.8%. Market might be anticipating a reversal or "catch-up” play – watch for confirmation on institutional flows.
- TRIPPLEG: RSI at 72.4 (overbought); price -10% today & breakdown below 15DMA; large YTD gain still intact (+56%). "Hot potato" risk—new buyers face immediate whiplash risk.
- SUNUASSUR: Unusual volume (>7x avg) combined with -6.64% price drop and bearish moving average signal: mass exit or shuffling hands, possible negative news flow.
Sector Heatmap
| Sector | Direction | Volume | Notable Names | Technical (RSI/MACD Trend) |
|---|---|---|---|---|
| Banking | Up | High | FIDELITYBK, ZENITHBANK, ACCESSCORP, UBA, STERLINGNG | Positive, Multiple Bullish Crossovers |
| Oil & Gas | Mixed | Moderate | OANDO, AR ADEL | OANDO bullish; AR ADEL slight pullback |
| Insurance | Mixed/Down | Very High (Unusual Vol) | SUNUASSUR, UNIVERSAL INSURE | Bullish-to-bearish swings, profit taking evident |
| ETFs | Up | High | MERVALUE, MERGROWTH | Breakout, Cross above 15DMA |
Dividend-Beta Matrix (Defensive Screen)
| Stock | Dividend Yield | Beta | Implication |
|---|---|---|---|
| FIDELITYBK | 5.48% | 0.89 | Stable, Decent Yield, Low Beta - Defensive |
| CAVERTON | 5.52% | 0.98 | High Yield, Mid Beta - Yield Play |
| LINKASSURE | 5.56% | 0.41 | High Yield, Very Low Beta - Good for risk-averse |
- High-yield with Bullish Momentum: Neither FIDELITYBK nor LINKASSURE are in the bearish table today, mitigating yield-trap risks.
- CAVERTON (bearish momentum) is cautious; high yields in a downtrend can be a warning signal for "value traps.”
Institutional Clustering Alerts
- ZENITHBANK: Institutional trades accounted for 20.17% of all institutional trade value – large players are active. Strong support for continued accumulation, especially as technicals remain positive.
- OKOMUOIL: Commanded a massive value share (₦2.41B/₦21.87B, ~11%)—institutions driving price and volume. High RSI (99.6) is a note of caution on chasing at these levels.
Market Activity Deep Dive: Retail vs. Institutional Flows
- Institutional trading: Drove 67.78% of volume and 89.61% of value today, with larger trade sizes and heavy focus on large-cap stocks (ZENITHBANK, OKOMUOIL). Positive in uptrends—signals strong "smart money” confidence.
- Retail activity: Accounted for a much higher 60.25% of trade counts but only 10.39% of value—a classic sign of fragmented, smaller trades. Top retail favorites overlap with institutions only on ACCESSCORP and OKOMUOIL, showing divergence in focus.
-
Top Traded Symbols:
- Institutional: OKOMUOIL, ACCESSCORP, OANDO, ZENITHBANK, ARADEL
- Retail: ACCESSCORP, OKOMUOIL, GTCO, OANDO, UBA
- Volume anomalies: Institutional dominance in OKOMUOIL and ZENITHBANK paired with high RSI and price momentum—a potential "overbought” warning for patient buyers.
Other Noteworthy Patterns & Opportunities
- Unusual Volumes: SUNUASSUR (Insurance) saw 753% surge—a possible short-term capitulation or news-driven exodus. LEGENDINT and VFDGROUP also had 2-3× normal turnover – candidates for tactical traders.
- Currency note: The Naira slipped slightly -0.03% to 1,531/$ – no major headwind for equities, but FX stability remains a critical watch.
- ETF Momentum: MERGROWTH and MERVALUE both posted high single-session gains and crossed above short-term averages, signaling possible renewed appetite for thematic/ETF play.
- Bullish breadth, but: Overbought clusters (RSI > 85) among recent gainers mean near-term pullbacks likely; set stop losses and trail profits.
Actionable Suggestions for Traders
- Momentum chasers: Ride strong uptrends, but monitor RSI – the likes of TIP, UNILEVER and PRESCO are ripe for short-term corrections.
- Defensive portfolios: Look to high dividend/low beta names like FIDELITYBK and LINKASSURE for relative safety.
- Bearish signals: Avoid adding to positions with fresh 15DMA cross below plus high RSI (e.g. TRIPPLEG, SUNUASSUR).
- Liquidity watch: Trade where there’s overlap in institutional and retail interest (OKOMUOIL, ACCESSCORP) for easier entry/exit and momentum confirmation.
- Reversal setups: Contrarian traders should start preparing for profit-taking in extreme overbought names.
Hidden Edge: Pattern Crossroads
- Unusual volumes combined with bearish breakdowns often precede sharp reversals. SUNUASSUR may stage a dead-cat bounce if selling exhausts, but the prudent stance is risk-off until clarity returns.
- Institutional clustering (ZENITHBANK, OKOMUOIL) enhances conviction—but beware RSI > 85 signals; momentum can abruptly flip.
- High dividend, bearish trend (e.g. CAVERTON, LINKASSURE, SUNUASSUR): Don’t be lured by high yields if price pressure and negative technicals persist.
Summing Up
Today’s strong close continues 2025’s bullish tide, but "overbought” readings and sporadic volume shocks urge both momentum traders and defensive investors to proceed with a plan — tighten stops, chase only confirmed breakouts, and watch for capitulation-reversal setups in the most beaten-down stocks. Be nimble, read the flow, and treat institutional participation as both a guide and a potential exit warning.
|
Top ASI Gainers Over Last 5 Trading Days
|
Top ASI Losers Over Last 5 Trading Days
|
For more detailed analysis, on InfoWARE Market Data Terminal <NSEPERF> <GO>
On InfoWARE Finance Mobile App (Android, iPhone & iPad, Windows Phone and Windows 8/10), "Top Gainers & Losers"
CHAMPION BREW. PLC. (CHAMPION) topped the advancers list closing at N12.32 with a gain of 10.00% followed by IKEJA HOTEL PLC (Ikejahotel) which closed at N23.10 with a gain of 10.00%.
On the flip side TRIPPLE GEE AND COMPANY PLC. (TRIPPLEG) and STANBIC IBTC ETF 30 (STANBICETF30) topped the decliners log with a loss of -10.00% at a close of N3.51, and -10.00% to close the day at N450.00 respectively.
| Symbol | LClose | %Chg |
|---|---|---|
| CHAMPION | 12.32 | 10.00 |
| Ikejahotel | 23.10 | 10.00 |
| MERGROWTH | 550.00 | 10.00 |
| MERVALUE | 198.00 | 10.00 |
| UNILEVER | 68.20 | 10.00 |
| Symbol | LClose | %Chg |
|---|---|---|
| TRIPPLEG | 3.51 | -10.00 |
| STANBICETF30 | 450.00 | -10.00 |
| TANTALIZER | 2.46 | -8.55 |
| SUNUASSUR | 4.64 | -6.64 |
| ETI | 32.00 | -5.88 |
For more detailed analysis,
- On InfoWARE Market Data Terminal <TOPG> <GO>
- On InfoWARE Finance Mobile App ( Android, iPhone & iPad and Windows 10) , "Top Gainers & Losers"
Currency Market
In the currency market, the Naira fell 0.03%(-0.45) against the Dollar to settle at 1 to 1Investment Insights - Top 5 Gainers YTD
These stocks are the best performers whose price has risen faster than the market as a whole with the best returns year to date. Momentum investors believe that stocks that have outperformed the market will often continue to do so because the factors that caused them to outperform will not suddenly disappear. In addition, other investors seeking to benefit from the stock’s outperformance will often purchase the stock, further bidding its price higher and pushing the stock higher still
For more detailed analysis,
- On InfoWARE Market Data Terminal <T5YTD2> <GO>
- On InfoWARE Finance Mobile App ( Android , iPhone & iPad and Windows 10) , "Research"
NSE: Bull Signal - Price crossed above 15 Day MA
This signal implies these stocks are under buying pressure and the price might continue to rise and therefore positions should be monitored closely. Further suggested analysis include looking at the overall market (ASI) to see if the uptrend is market wide, sector wide or specific to the stock. Portfolio managers tend to use this as a signal to do more research to add to their positions or lock in some profits. Typically further analysis should be done using commands like PC and RV on the InfoWARE Market Data Terminal. Another command is ALERTS to set price triggers for possible exit or entry as necessary
For more detailed analysis,
- On InfoWARE Market Data Terminal <NSEPERF> <GO>
- On InfoWARE Finance Mobile App ( Android , iPhone & iPad and Windows 10) , "Top Gainers & Losers"
| Symbol | Price | %Chg | 15DMA | PE | EPS | DivY | MktCap | Vol | Trades | Value | LstTradeTime |
|---|---|---|---|---|---|---|---|---|---|---|---|
| MERVALUE | 198.00 | 9.09 | 191.22 | 0.00 | 0.00 | 2.31K | 5.00 | 450.10K | 25-Jul-2025 14:31:23.717 | ||
| INTBREW | 15.20 | 8.88 | 14.42 | 0.00 | 0.00 | 6.23 | 408.30B | 16.89M | 268.00 | 246.59M | 25-Jul-2025 14:30:27.597 |
| CILEASING | 7.45 | 8.72 | 7.23 | 6.50 | 0.64 | 1.20 | 5.82B | 6.61M | 124.00 | 47.78M | 25-Jul-2025 14:30:18.997 |
| CONHALLPLC | 3.22 | 6.83 | 3.16 | 69.63 | 0.03 | 2.08 | 34.47B | 11.44M | 103.00 | 35.10M | 25-Jul-2025 14:30:19.100 |
| FCMB | 9.80 | 4.08 | 9.56 | 104.31 | 0.09 | 5.62 | 194.07B | 22.09M | 426.00 | 211.48M | 25-Jul-2025 14:31:22.703 |
| FIDELITYBK | 21.20 | 2.83 | 20.83 | 13.24 | 1.17 | 5.48 | 614.27B | 17.72M | 631.00 | 370.37M | 25-Jul-2025 14:30:26.693 |
| NGXGROWTH | 9,858.63 | 1.21 | 9,800.58 | 18.83 | 0.18 | 0.00 | 0.00 | 4.66M | 410.00 | 60.34M | 25-Jul-2025 14:30:41.060 |
| NGXOILGAS | 2,448.42 | 0.49 | 2,440.20 | 8.74 | 228.15 | 0.00 | 0.00 | 566.01K | 331.00 | 1.83B | 25-Jul-2025 14:30:41.410 |
| MAYBAKER | 17.10 | 0.00 | 17.06 | 58.94 | 0.14 | 3.75 | 29.50B | 621.00K | 87.00 | 10.91M | 25-Jul-2025 14:30:28.463 |
NSE: BEAR Signal - Price crossed below 15 Day MA
This signal implies these stocks are under selling pressure and the price might continue to slide and therefore positions should be monitored closely. Further suggested analysis include looking at the overall market (ASI) to see if the downtrend is market wide, sector wide or specific to the stock. If the overal market trend is upwards, then since these stocks are heading in the opposite direction, then further analysis should be done using commands like PC and RV on the InfoWARE Market Data Terminal. Another command is ALERTS to set price triggers for possible exit is necessar
For more detailed analysis,
- On InfoWARE Market Data Terminal <BEARM> <GO>
- On InfoWARE Finance Mobile App ( Android , iPhone & iPad and Windows 10)
| Symbol | Price | %Chg | 15DMA | PE | EPS | DivY | MktCap | Vol | Trades | Value | LstTradeTime |
|---|---|---|---|---|---|---|---|---|---|---|---|
| CAVERTON | 7.00 | -2.14 | 7.12 | 1.15 | 1.57 | 5.52 | 23.45B | 3.42M | 127.00 | 24.22M | 25-Jul-2025 14:30:18.800 |
| FGSUK2033S6 | 95.50 | -2.62 | 96.43 | 0.00 | 0.00 | 3.00 | 1.00 | 2.87K | 25-Jul-2025 14:30:39.917 | ||
| LINKASSURE | 1.50 | -3.33 | 1.52 | 59.89 | 0.02 | 5.56 | 21.00B | 894.80K | 46.00 | 1.32M | 25-Jul-2025 14:30:28.293 |
| RTBRISCOE | 3.58 | -4.75 | 3.71 | 0.00 | 0.00 | 4.35 | 4.21B | 5.90M | 119.00 | 22.08M | 25-Jul-2025 14:30:30.620 |
| ETI | 32.00 | -6.25 | 33.28 | 5.00 | 5.10 | 2.00 | 587.19B | 4.55M | 159.00 | 145.46M | 25-Jul-2025 14:30:26.387 |
| SUNUASSUR | 4.64 | -7.11 | 4.82 | 0.00 | 0.00 | 0.99 | 26.96B | 18.84M | 153.00 | 85.09M | 25-Jul-2025 14:31:23.003 |
| STANBICETF30 | 450.00 | -11.11 | 490.46 | 0.00 | 0.00 | 1.50K | 19.00 | 687.99K | 25-Jul-2025 14:31:23.977 | ||
| TRIPPLEG | 3.51 | -11.11 | 3.70 | 215.00 | 0.01 | 5.32 | 1.74B | 469.29K | 37.00 | 1.70M | 25-Jul-2025 14:30:31.640 |
| FGSUK2027S3 | 75.01 | -27.32 | 85.44 | 0.00 | 0.00 | 5.00K | 1.00 | 3.75M | 25-Jul-2025 14:30:39.817 |
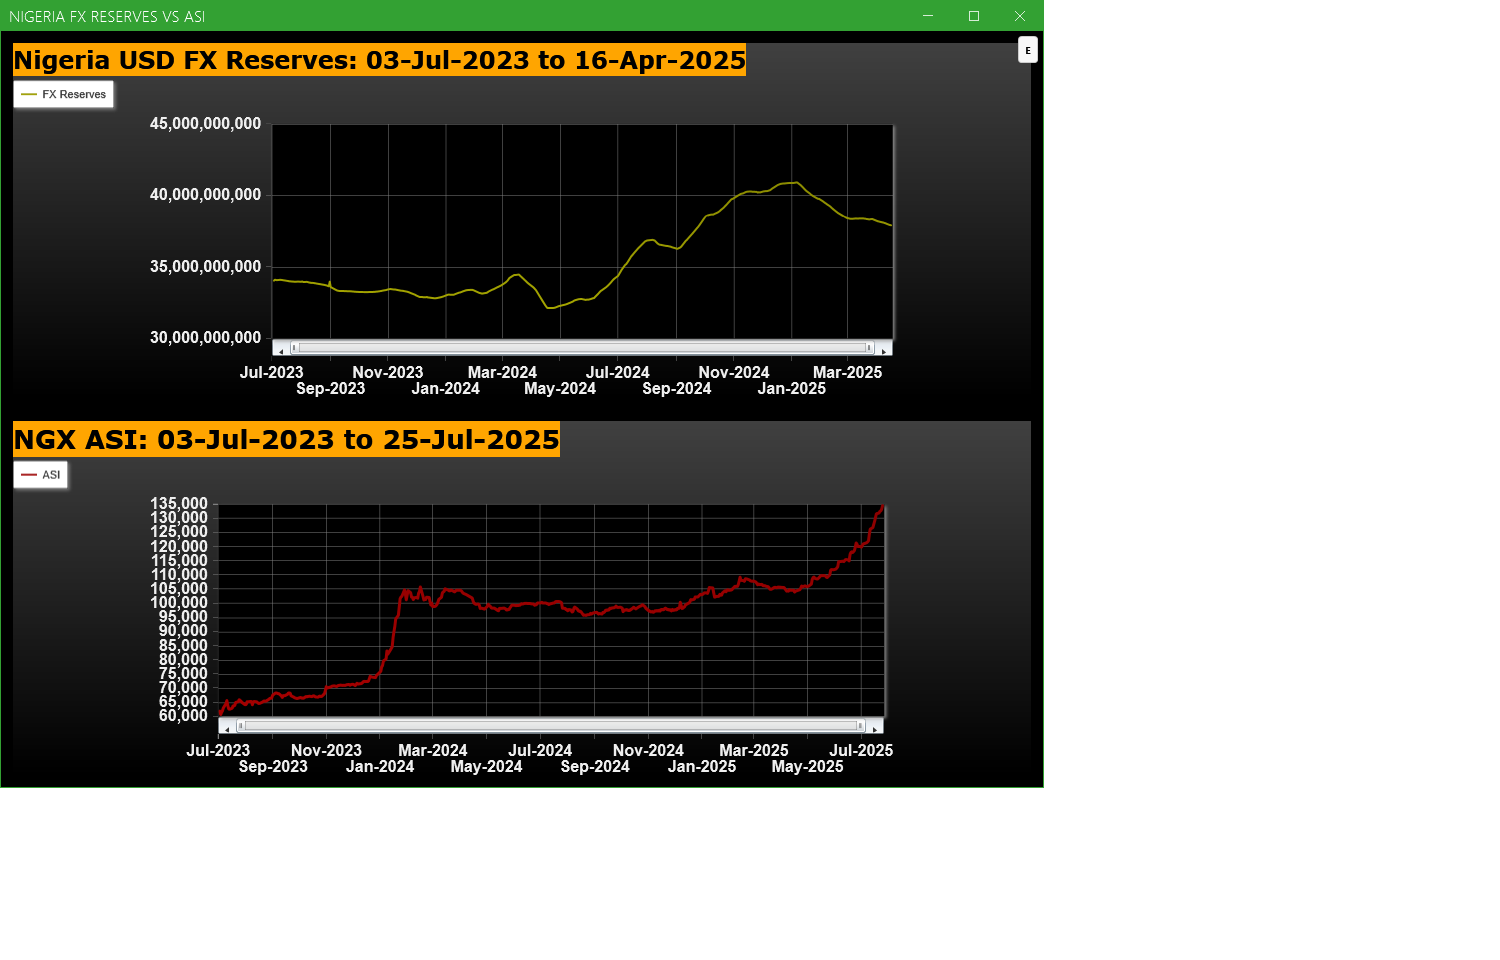
Economic Indicators - Nigeria FX Reserves Vs ASI Chart
Nigeria FX Reserves are assets held on reserve by CBN in foreign currencies. These reserves are used to back liabilities and influence monetary policy. Given the nature of the Nigeria economy, FX Reserves can appear to have an outsize influence on the economy and hence on the capital market. The chart below allows comparison of FX Reserves against the ASI to make investment decisions
For more detailed analysis,
- On InfoWARE Market Data Terminal <CI> <GO>
- On InfoWARE Finance Mobile App ( Android , iPhone & iPad and Windows 10) , "Research"
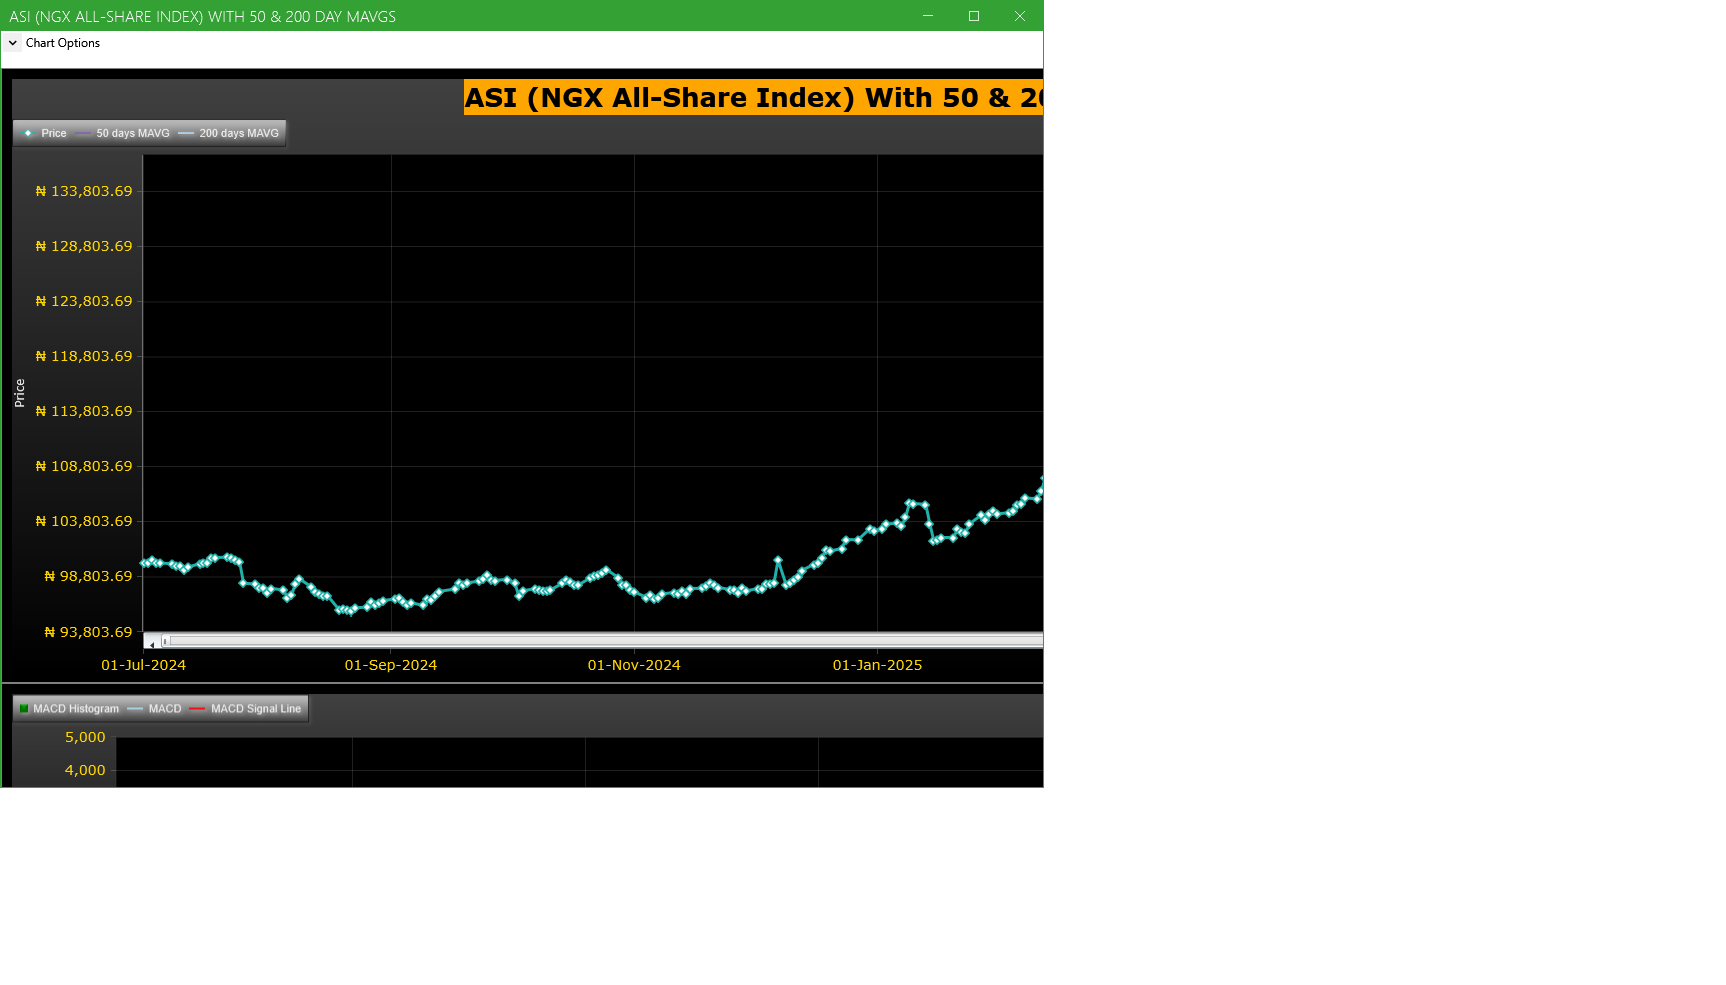
Market Trend - ASI (NGX All-Share-Index) With 50 & 200 Day MAvgs Chart
Technical traders typically use the 50 & 200 day moving averages to aid in choosing
where to enter or exit a position, which then causes these levels to act as strong
support or resistance. As a general guideline, if the price is above a moving average,
the trend is up. If the price is below a moving average, the trend is down.
It is important to note that critics of technical analysis say that moving averages act
as support and resistance because so many traders use these indicators to inform their
trading decisions. Also moving averages tend to work quite well in strong trending conditions
but poorly in choppy or ranging conditions.
Trading Strategies: Crossovers
Crossovers are one of the main moving average strategies. The first type is a price crossover,
which is when the price crosses above or below a moving average to signal a potential change
in trend. Another strategy is to apply two moving averages to a chart: one longer and one
shorter. When the shorter-term MA crosses above the longer-term MA, it is a buy signal, as
it indicates that the trend is shifting up. This is known as a golden cross. Meanwhile, when
the shorter-term MA crosses below the longer-term MA, it is a sell signal, as it indicates that
the trend is shifting down. This is known as a dead/death cross
For more detailed analysis,
- On InfoWARE Market Data Terminal <CI> <GO>
- On InfoWARE Finance Mobile App ( Android , iPhone & iPad and Windows 10) , "Research"
Unusual Volume: Volume traded is more than double the 90 day moving average (All exchanges; ASI & ASem). For more detailed analysis,
- On InfoWARE Market Data Terminal <UV> <GO>
- On InfoWARE Finance Mobile App ( Android , iPhone & iPad and Windows 10)
| Symbol | Name | Volume | 90DAvgVol | %VolChg | Price | LClose | %Chg | Trades | Value |
|---|---|---|---|---|---|---|---|---|---|
| UNIVINSURE | UNIVERSAL INSURANCE COMPANY PLC | 40.69M | 19.35M | 110.31 | 0.72 | 0.73 | -1.37 | 158 | 29.72M |
| VFDGROUP | VFD GROUP PLC | 22.33M | 6.43M | 247.37 | 13.00 | 13.20 | -1.52 | 765 | 292.66M |
| STERLINGNG | STERLING FINANCIAL HOLDINGS COMPANY PLC | 20.38M | 9.07M | 124.73 | 6.60 | 6.40 | 3.13 | 332 | 131.70M |
| LEGENDINT | LEGEND INTERNET PLC | 18.89M | 5.59M | 237.93 | 6.44 | 5.86 | 9.90 | 199 | 121.35M |
| SUNUASSUR | SUNU ASSURANCES NIGERIA PLC. | 18.84M | 2.21M | 753.34 | 4.64 | 4.97 | -6.64 | 153 | 85.09M |
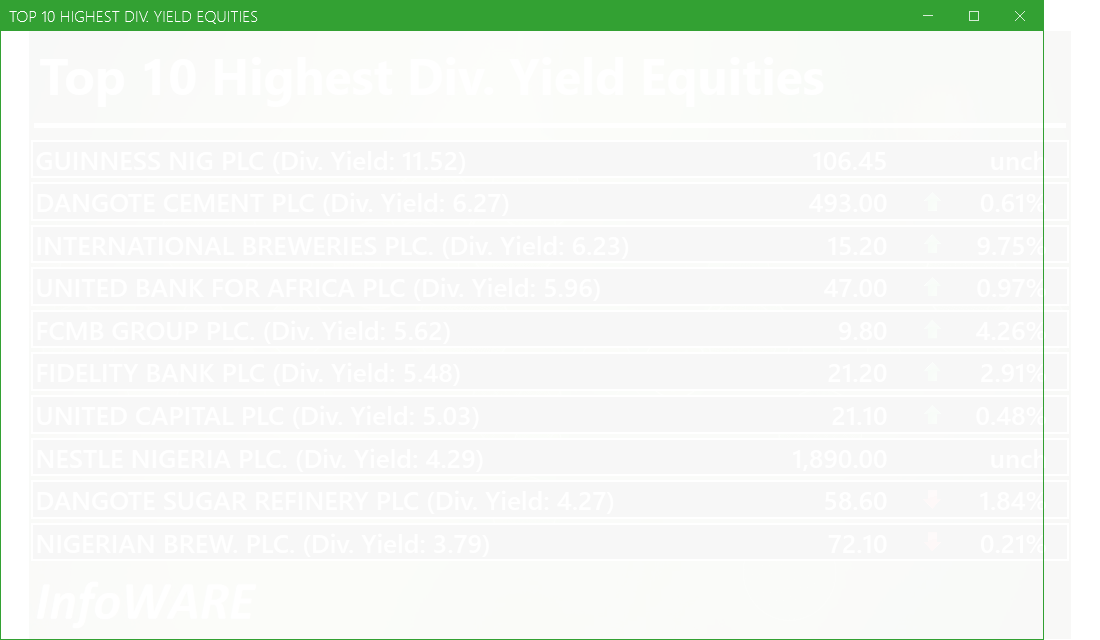
Investment Insights - High Div. Stocks
Dividend stocks distribute a portion of the company earnings to investors on a regular basis and they can a great choice for investors looking for regular income. As an investment or trading strategy, high dividend yield equities provide annual cash payments as against mostly capital gains in the price of a stock. The list in the table below represent the highest dividend paying stocks from the list of the most liquid stocks in the NSE top 30.
For more detailed analysis,
- On InfoWARE Market Data Terminal <HYIELD> <GO>
- On InfoWARE Finance Mobile App ( Android , iPhone & iPad and Windows 10) , "Research"
Investment Insights - Stocks outperforming the ASI but with approximately the same risk
These list of stocks represent equities that are less risky than the ASI but doing better than the ASI (All Shares Index) using the YTD (Year to Date) returns as the measure. The risk is measured by Beta. Beta is an assessment of a stock's tendency to undergo price changes, (its volatility), as well as its potential returns compared to the ASI. It is expressed as a ratio, where a score of 1 represents performance comparable to the ASI, and returns above or below the market may receive scores greater or lower than 1.
For a full list of both positively and negatively corelated stocks visit InfoWARE Market Data Terminal
- On InfoWARE Market Data Terminal <BANL> <GO>
- On InfoWARE Finance Mobile App ( Android , iPhone & iPad and Windows 10)
| Symbol | DivYield | PE | EPS | Beta | %ChgYTD | ASIYTDReturn | BetaDiff |
|---|---|---|---|---|---|---|---|
| HONYFLOUR | 1.40 | 16.28 | 0.31 | 0.99 | 290.17 | 30.31 | 0.01 |
| CAVERTON | 5.52 | 1.15 | 1.57 | 0.98 | 174.51 | 30.31 | 0.02 |
| FTNCOCOA | 1.60 | 0.00 | 0.00 | 0.79 | 285.11 | 30.31 | 0.21 |
| NB | 3.79 | 16.95 | 1.60 | 0.79 | 125.31 | 30.31 | 0.21 |
| MAYBAKER | 3.75 | 58.94 | 0.14 | 0.78 | 81.91 | 30.31 | 0.22 |
| UNILEVER | 2.81 | 67.09 | 0.40 | 0.75 | 89.44 | 30.31 | 0.25 |
| VETGOODS | 0.00 | 0.71 | 75.00 | 30.31 | 0.29 | ||
| CUTIX | 6.52 | 8.81 | 0.26 | 0.70 | 62.06 | 30.31 | 0.30 |
| Ikejahotel | 0.94 | 51.55 | 0.16 | 0.70 | 87.04 | 30.31 | 0.30 |
| ABBEYBDS | 1.43 | 0.00 | 0.00 | 0.70 | 166.67 | 30.31 | 0.30 |
African Markets
| Name | LClose | Change | %Chg |
|---|---|---|---|
| BRVM Stock Exchange | 310.10 | 0.87 | 0.28 |
| Botswana Stock Exchange | 10,495.71 | 0.00 | 0.00 |
| Egyptian Exchange | 34,125.12 | 321.14 | 0.95 |
| Lusaka Stock Exchange | 20,946.81 | 2.09 | 0.01 |
| Casablanca Stock Exchange | 19,266.33 | 181.31 | 0.95 |
| Malawi Stock Exchange | 331,801.09 | 0.00 | 0.00 |
| Nigeria Stock Exchange | 133,199.99 | 741.77 | 0.56 |
| Nairobi Securities Exchange | 160.23 | -0.76 | -0.47 |
| Rwanda Stock Exchange | 150.43 | 0.00 | 0.00 |
| Uganda Securities Exchange | 1,328.39 | 0.80 | 0.06 |
Nigeria Market Indexes
| Symbol | LClose | %Chg | WTD% | MTD% | QTD% | YTD% | MktCap | Trades |
|---|---|---|---|---|---|---|---|---|
| ASI | 134,452.93 | 0.94 | 1.99 | 12.29 | 12.29 | 30.31 | 22,444 | |
| NGX30 | 4,932.39 | 0.90 | 1.88 | 4.42 | 4.42 | 29.30 | 11,720 | |
| NGXAFRBVI | 3,672.56 | 0.02 | 2.22 | 3.64 | 3.64 | 48.04 | 4,154 | |
| NGXAFRHDYI | 22,818.55 | 0.26 | 2.28 | 9.11 | 9.11 | 34.01 | 4,408 | |
| NGXASEM | 1,446.38 | 0.00 | 0.00 | -9.32 | -9.32 | -8.67 | 6 | |
| NGXBNK | 1,564.26 | 0.59 | 2.22 | 3.54 | 3.54 | 43.85 | 4,856 | |
| NGXCG | 4,109.04 | 0.64 | 2.16 | 19.49 | 19.49 | 45.24 | 10,296 | |
| NGXCNSMRGDS | 2,897.68 | 1.63 | 2.75 | -16.46 | -16.46 | 67.07 | 2,745 | |
| NGXCOMMDTY | 1,087.05 | 1.20 | 1.73 | 3.80 | 3.80 | 8.70 | ||
| NGXGROWTH | 9,858.63 | 1.23 | 2.90 | 3.67 | 3.67 | 27.00 | 410 | |
| NGXINDUSTR | 4,591.02 | 0.60 | 3.11 | 30.32 | 30.32 | 28.54 | 1,705 | |
| NGXINS | 897.88 | 1.32 | 4.48 | 21.57 | 21.57 | 14.21 | 1,486 | |
| NGXLOTUSISLM | 10,746.58 | 1.30 | 3.28 | 12.24 | 12.24 | 54.23 | 4,003 | |
| NGXMAINBOARD | 6,458.44 | 0.99 | 2.03 | 9.48 | 9.48 | 29.07 | 17,205 | |
| NGXMERIGRW | 9,630.01 | 2.63 | 3.95 | -0.23 | -0.23 | 47.63 | 3,852 | |
| NGXMERIVAL | 13,829.05 | 0.33 | 3.64 | 15.75 | 15.75 | 32.58 | 5,791 | |
| NGXOILGAS | 2,448.42 | 0.50 | 0.97 | 2.35 | 2.35 | -9.69 | 331 | |
| NGXPENBRD | 2,459.03 | 0.67 | 1.68 | 6.95 | 6.95 | 34.25 | 17,467 | |
| NGXPENSION | 6,625.03 | 0.71 | 1.65 | 4.26 | 4.26 | 46.12 | 12,990 | |
| NGXPREMIUM | 13,520.58 | 0.84 | 1.93 | 17.88 | 17.88 | 38.92 | 4,829 | |
| NGXSOVBND | 668.16 | 0.00 | 0.44 | 2.24 | 2.24 | 11.07 | 0 |
For more detailed analysis,
- On InfoWARE Market Data Terminal <MKTINS> <GO>
- On InfoWARE Finance Mobile App ( Android, iPhone & iPad and Windows 10) , "Market Indexes"
Find the topic interesting? Will like to comment? Contact Us at solutions@infowarelimited.com
Top News

InfoWARE AI Analyst Weekly Market Report: 25-Jul-2025
Chart Of The Day - ASI Chart Vs ASI Advance Decline Line (YTD) (25-Jul-2025 15:07:35.407)
InfoWARE AI Analyst Daily Market Report: 25-Jul-2025

[CUTIX]>>Corporate Disclosures-<CUTIX PLC.>
[VFDGROUP]>>Notice of Meeting -<VFD Group Plc>
[TRANSCOHOT]>>Corporate Disclosures-<TRANSCORP HOTELS PLC>
[TRANSCOHOT]>>Corporate Disclosures-<TRANSCORP HOTELS PLC>
[TRANSCOHOT]>>Corporate Disclosures-<TRANSCORP HOTELS PLC>
[CHAMPION]>>Corporate Disclosures-<CHAMPION BREW. PLC.>
[MERGROWTH]>> DAILY INDICATIVE PRICES
[LOTUSHAL15]>> DAILY INDICATIVE PRICES
[VSPBONDETF]>> DAILY INDICATIVE PRICES
[XNSA]>> NGX FIXED INCOME INDICATIVE PRICE LIST FOR JUL 25, 2025
[ETERNA]>>Corporate Disclosures-<ETERNA PLC.>
[ETRANZACT]>>Corporate Disclosures-<E-TRANZACT INTERNATIONAL PLC>
[XNSA]>> CORDROS MILESTONE FUNDS' BID & OFFER PRICES
[XNSA]>> FULL SUSPENSION IN TRADING AND DELISTING OF THE SHARES
[SIAMLETF40]>> DAILY INDICATIVE PRICES
[XNSA]>> NOTIFICATION OF PRICE ADJUSTMENT
Chart Of The Day - ASI Chart Vs ASI Advance Decline Line (YTD) (24-Jul-2025 15:07:22.343)
InfoWARE AI Analyst Daily Market Report: 24-Jul-2025
[XNSA]>> DAILY FUND PRICE SUBMISSION - FCMB ASSET MANAGEMENT LIMITED
[XNSA]>> CORDROS MILESTONE FUNDS' BID & OFFER PRICES
[NCR]>>Corporate Disclosures-<NCR (NIGERIA) PLC.>
[AIRTELAFRI]>>Corporate Disclosures-<Airtel Africa Plc>
[MERGROWTH]>> DAILY INDICATIVE PRICES
[XNSA]>> NGX FIXED INCOME INDICATIVE PRICE LIST FOR JUL 24, 2025
[VSPBONDETF]>> DAILY INTICATIVE PRICES
[AIRTELAFRI]>>Corporate Disclosures-<Airtel Africa Plc>
[STANBICETF30]>> DAILY INDICATIVE PRICES
Get IDIA - the stock trading app for the modern investor
Solutions by Business
Product Suites
Company
Contacts
- 8th Floor,
- South Atlantic Petroleum Towers,
- 1 Adeola Odeku Street,
- Victoria Island,
- Lagos, Nigeria.
- Email: solutions@infowarelimited.com
Follow Us
 |
 |
 |
 |