


InfoWARE AI Analyst Daily Market Report: 11-Aug-2025 | InfoWARE Finance
Get IDIA - the stock trading app for the modern investor


InfoWARE AI Analyst Daily Market Report: 11-Aug-2025
(Source: InfoWARE Terminal, Date: 11-Aug-2025)
Dear Investor,
🌅 NGX Market Close Summary – Monday, August 11, 2025
The Nigerian equities market began the week on a cautiously upbeat note. The NGX All Share Index (ASI) edged up +0.13% to finish at 145,754.91 points. Year-to-date, the index boasts a solid +41.45% gain. Investor activity surged as trading volume jumped to 2.04 billion shares and market turnover rocketed by 475.98% to ₦18.41 billion, driven largely by outsized trades in select counters, notably within the insurance sector. The breadth was nearly flat (advancers/decliners ratio of 0.98x), with 44 stocks up and 45 stocks down—hinting at underlying indecision even amid high headline numbers. AIICO Insurance (+10%) led gainers, while LOTUSHAL15 ETF (-10%) topped the laggards. The surge in volumes and concentrated sectoral moves raise important signals about possible short-term topping in overheated names—especially amidst stretched technicals.
📈 Noteworthy Market Trends
- Market Breadth: Almost evenly split with a 0.98x advancers/decliners ratio (44 up, 45 down). Market sentiment tepid despite uptick in headline ASI.
- Turnover Surge: Trade value spiked to ₦18.41B [+475.98% day-on-day]; reflects block trades & possible institutional repositioning.
-
Unusual Volumes:
- Insurance stocks dominated, e.g. LINKASSURE (703.59M vs 28.82M avg, +2341%), UNIVINSURE (230.54M, +699%), AIICO (154.73M, +494%), and VERITASKAP (74.56M, +343%)
- Bullish Momentum: Multiple gainers and momentum names are flashing overbought (RSI > 70), showing signs of euphoria.
- Bearish Momentum: Select blue chips (e.g. ZENITHBANK, NB, WAPCO, OANDO) fell below 15-day averages—potential warning for sectoral rotation.
🚀 Top 5 Gainers (Day) | Top 5 Losers (Day)
| Symbol | Stock | Price | % Change | RSI | MACD | 15D/50D MA |
|---|---|---|---|---|---|---|
| AIICO | AIICO INSURANCE PLC. | 3.85 | +10.00% | 86.2 | 0.31 | 2.55 / 1.99 |
| UNIVINSURE | UNIVERSAL INSURANCE | 1.21 | +10.00% | 78.2 | 0.08 | 0.84 / 0.68 |
| STANBIC | STANBIC IBTC HOLDINGS | 111.10 | +10.00% | 91.95 | 4.04 | 101.22 / 88.59 |
| VERITASKAP | VERITAS KAPITAL | 2.31 | +10.00% | 90.74 | 0.20 | 1.48 / 1.19 |
| TIP | THE INITIATES PLC | 13.20 | +10.00% | 50.1 | 1.07 | 13.82 / 9.75 |
| ABCTRANS | ASSOCIATED BUS COMPANY | 4.50 | -10.00% | 65.7 | 0.36 | 4.88 / 3.73 |
| ABBEYBDS | ABBEY BUILDING SOCIETY | 5.67 | -10.00% | 45.7 | -0.14 | 6.74 / 6.36 |
| GREENWETF | GREENWICH ASSET ETF | 419.2 | -9.99% | 84.2 | 34.32 | 311.52 / 298.92 |
| UACN | UACN PLC | 75.25 | -9.99% | 68.9 | 12.69 | 73.42 / 49.00 |
| HMCALL | HALDANE MCCALL PLC | 4.36 | -9.92% | 57.0 | 0.07 | 4.54 / 4.39 |
- Insurance names dominate gainers’ table: AIICO, UNIVINSURE, VERITASKAP all hit limit-ups on massive volumes and extreme RSI—likely entering short-term overbought zone.
- Greenwich ETF notable for steep loss despite high RSI—possibly due to profit-taking on an extended rally.
- UACN a rare large-cap loser with -9.99%, pulling up in both daily and YTD losers tables: signals further caution.
📊 Momentum Tables – Key Insights
- Bullish crossovers: AFRIPRUD, FIDELITYBK closed above their 15D MA, confirming upward momentum. AFRIPRUD offers an attractive 1.27% dividend yield and low beta (0.64), making it a defensive growth name.
- Bearish crossovers: ZENITHBANK, OANDO, WAPCO, NB sank below their 15D MAs—some with high institutional activity—hinting at heavy exits or sectoral profit-taking.
- Overheated signals: Several gainers show RSI well above 80 (AIICO: 86.2; STANBIC: 91.9; VERITASKAP: 90.7). Bullish but likely primed for a consolidation or pullback.
- Sector skew: Insurance sector massively outperforming, but also the most stretched. Banks are mixed: FIDELITYBK strong, ZENITHBANK soft, possibly switching leadership.
🔎 Contrarian Signals (Conflicting Indicators)
- GREENWETF: Loser with a very high RSI (84.2). Despite today's -10% selloff, may be a healthy correction in an overheated ETF—watch for technical bounce.
- UACN: Sits on both daily and YTD losers, despite above neutral RSI and double-digit recent momentum. Sector rotation away or potential oversold bounce opportunity if selling abates.
- ZENITHBANK: Strong institutional trades (20.17% trade value share) but hitting bearish technicals (below 15DMA, falling RSI). Institutional exit or temporary digestion?
- AIICO: Extreme volume and RSI near 90, but still seeing robust institutional demand—a possible blow-off top warning or beginning of a longer-term re-rating.
- ABCTRANS: RSI in the middle (65.7), recent cross below 15DMA—neutral momentum but sharp price drop. Conflicting signs: Possible value candidate if trend reverses.
🔥 Sector Heatmap
| Sector | Top Performer | Lagging Name | Net Sector Tone | Institutional Participation | Technical Trend |
|---|---|---|---|---|---|
| Insurance | AIICO, UNIVINSURE, VERITASKAP (All +10%) | — | +++ | Medium (AIICO: high trades) | Bullish (All above 15DMA, high RSI) |
| Banking | FIDELITYBK (+0.47%) | ZENITHBANK (-0.88%) | Mixed | Strong (ZENITHBANK, UBA, ACCESSCORP top 5 inst. trades) | Mixed-to-bearish (Zenith breakdown, Fidelity positive) |
| Building Materials | - | WAPCO (-10.23%), BERGER (-9.97%) | -- | Scattered | Bearish (WAPCO, BERGER both below 15DMA) |
| Real Estate | - | HMCALL (-11.0%) | -- | Low | Bearish (Cross below 15DMA) |
| Telecoms | MTNN (unchang.) | - | Flat | Retail-driven | Stable |
📦 Dividend–Beta Matrix: Defensive Picks
| Symbol | Name | Div. Yield (%) | Beta | Momentum | Comment |
|---|---|---|---|---|---|
| AFRIPRUD | Africa Prudential Plc | 1.27 | 0.64 | Bullish (Above 15DMA) | Low volatility, income + upward trend |
| FIDELITYBK | Fidelity Bank Plc | 5.48 | 0.89 | Bullish (Above 15DMA) | Both yield and price momentum positive |
| NB | Nigerian Breweries | 3.79 | 0.78 | Bearish (Below 15DMA) | Payout with technical caution |
| OANDO | Oando Plc | 1.15 | 1.12 | Bearish (Below 15DMA) | Yield, but high beta – avoid while momentum negative |
| ABCTRANS | ABC Transport | 2.19 | 0.01 | Bearish (Below 15DMA) | Yield, but negative technicals |
🏦 Institutional Clustering Alerts
- ZENITHBANK: Cornered 20.17% of institutional trade value (₦1.19B turnover), with large-volume blocks. However, price and technicals are weakening—potential for further institutional profit-taking or a near-term reversal if flows stabilize.
- UBA & ACCESSCORP: Also feature prominently in institutional (and retail) activity, suggesting ongoing sector rotation in Tier-1 banks ahead of earnings/reporting or regulatory catalysts.
- AIICO: Both retail and institutional strong—confirming rally legitimacy, but signals potential for near-term exhaustion.
🧩 Traders’ Suggestions & Cautions
- Short-term traders: Exercise extra caution in overheated insurance stocks (AIICO, UNIVINSURE, VERITASKAP, MBENEFIT)—RSIs deep in overbought zone and abnormal volumes. Expect volatility!
- Bounce plays: Watch for technical rebounds in sector laggards with stable or improving RSI (e.g. NB, WAPCO, ZENITHBANK).
- Defensive/income portfolios: AFRIPRUD and FIDELITYBK offer rare combination of dividend, low beta, and upward momentum.
- Rotate with volume: Track volume anomalies—stocks with 3x–20x normal volume frequently presage sentiment shift or ongoing re-rating (e.g. LINKASSURE, STERLINGNG). If buying in, use tight stops.
- Avoid chasing: Many bullish momentum names are overextended. Wait for consolidation or retracement before new entries.
🕵️♂️ YTD Gainers & Losers – Hidden Trends
Year-To-Date Top 5 Gainers| Name | Symbol | Price | YTD % | RSI | DivYield | Beta |
|---|---|---|---|---|---|---|
| MBENEFIT | MBENEFIT | 2.92 | +426.2% | 93.8 | 3.28 | 1.27 |
| UPDC | UPDC | 7.90 | +402.3% | 86.8 | 34.25 | 1.10 |
| ELLAHLAKES | ELLAHLAKES | 13.28 | +385.05% | 70.7 | — | 0.31 |
| SOVRENINS | SOVRENINS | 2.72 | +143.1% | 78.9 | 3.75 | 1.12 |
| AIICO | AIICO | 3.50 | +145.2% | 86.2 | 4.13 | 1.33 |
| Name | Symbol | Price | YTD % | RSI | DivYield | Beta |
|---|---|---|---|---|---|---|
| JOHNHOLT | JOHNHOLT | 7.20 | -10.1% | 42.2 | 1.25 | -0.20 |
| LIVINGTRUST | LIVINGTRUST | 5.00 | +5.0% | 10.0 | 1.67 | 0.0 |
| HONYFLOUR | HONYFLOUR | 24.80 | +236.0% | 47.2 | 1.40 | 0.98 |
| CHAMS | CHAMS | 2.76 | +24.3% | 48.7 | 1.56 | 1.16 |
| ABBEYBDS | ABBEYBDS | 6.30 | +89.0% | 45.7 | 1.43 | 0.70 |
- Insurance stocks completely dominate YTD gainers’ list, supported by momentum, volume and index-leading performance. However, risk of correction is elevated—see massive RSI readings.
- Some YTD gainers also top volume/momentum charts (e.g. AIICO, UNIVINSURE). Risk of exhaustion spike.
- YTD losers’ table includes some positive YTD performers (e.g. ABBEYBDS +89%, CHAMS, HONYFLOUR +236%) due to negative recent momentum: signals that winners’ list is being reshuffled—potential contrarian value hunting possible.
📊 Market Activity Insights: Retail vs Institutional Trade Patterns
| Type | Trade Count | Total Volume | % by Volume | % by Value |
|---|---|---|---|---|
| Institutional | 3,107 | 1.71B | 80.7% | 82.6% |
| Retail | 37,391 | 409.1M | 19.3% | 17.4% |
- Institutionals controlled the trading day, accounting for the bulk of gross value and volume (high-conviction block moves). However, retail activity was broad—a sign that while institutions set tone, smaller investors are actively speculating in secondary names.
- Top 5 Institutional Picks: ZENITHBANK, UBA, ACCESSCORP, AIICO, ELLAHLAKES.
Observations:- ZENITHBANK and UBA: Big bank trades, but both faced price/log technical headwinds; watch for either reversal or further sector outflows.
- AIICO and ELLAHLAKES: Feature among highest gainers and high momentum, with strong institutional support—a positive for trend-followers, but extended RSI is a warning.
- Top 5 Retail Stocks: MTNN, UBA, ACCESSCORP, GTCO, AIICO.
Observations:- Heavy retail interest in large-cap banks and telecoms, but less technical momentum—possible "buy the dip” action, but tread carefully in sideway environments.
- AIICO: Unusually high activity in both retail and institutional, confirming true leadership in today’s rally.
- Hidden Insight: When both institutional and retail flow cluster on same names (AIICO, UBA), trend moves can be powerful—but latecomers risk entering at a climax.
⏪ Previous Week Trend Recap (if available)
Last week ended with the ASI largely range-bound, seeing alternating days of minor upticks and dips. Insurance and select banking names provided most of the volatility. The majority of top gainers this week were already showing signs of strong volume pickup and intraday volatility last week, foreshadowing today’s surge and sector rotation. The persistence of extremely high RSI and volume signals brewing exhaustion or a speculative blowoff in certain pockets (insurance in particular).
💡 Final Thoughts/Actionable Insights
- Short covering rally?: The dramatic increase in turnover and volume—especially concentrated in a handful of insurance names—may signal final phases of speculative repositioning. Tighten stops in all overheated gainers; expect profit-taking volatility ahead.
- Diversify for safety: High dividend, low beta, and price momentum (AFRIPRUD, FIDELITYBK) "check all boxes” for tactical positioning.
- Be wary of mean reversion: Extended RSI and far-above-mean trading volumes signal that short-term pullbacks or sector rotation could be sharp and sudden, especially if overall market fails to lift breadth.
- Rotation from champs: Some prior leaders and blue-chips (ZENITHBANK, WAPCO, OANDO) are triggering bearish momentum, possibly due to institutional shifts to more speculative sectors.
All percentages green if positive, red if negative.
Summary prepared by InfoWARE Analytics, Aug. 11, 2025.
|
Top ASI Gainers Over Last 5 Trading Days
|
Top ASI Losers Over Last 5 Trading Days
|
For more detailed analysis, on InfoWARE Market Data Terminal <NSEPERF> <GO>
On InfoWARE Finance Mobile App (Android, iPhone & iPad, Windows Phone and Windows 8/10), "Top Gainers & Losers"
AIICO INSURANCE PLC. (AIICO) topped the advancers list closing at N3.85 with a gain of 10.00% followed by LOTUS HALAL EQUITY ETF (LOTUSHAL15) which closed at N66.00 with a gain of 10.00%.
On the flip side ABBEY BUILDING SOCIETY PLC (ABBEYBDS) and ASSOCIATED BUS COMPANY PLC (ABCTRANS) topped the decliners log with a loss of -10.00% at a close of N5.67, and -10.00% to close the day at N4.50 respectively.
| Symbol | LClose | %Chg |
|---|---|---|
| AIICO | 3.85 | 10.00 |
| LOTUSHAL15 | 66.00 | 10.00 |
| SIAMLETF40 | 539.00 | 10.00 |
| STANBIC | 111.10 | 10.00 |
| SUNUASSUR | 5.50 | 10.00 |
For more detailed analysis,
- On InfoWARE Market Data Terminal <TOPG> <GO>
- On InfoWARE Finance Mobile App ( Android, iPhone & iPad and Windows 10) , "Top Gainers & Losers"
Currency Market
In the currency market, the Naira appreciated 0.05%(0.70) against the Dollar to settle at 1 to 1Investment Insights - Top 5 Gainers YTD
These stocks are the best performers whose price has risen faster than the market as a whole with the best returns year to date. Momentum investors believe that stocks that have outperformed the market will often continue to do so because the factors that caused them to outperform will not suddenly disappear. In addition, other investors seeking to benefit from the stock’s outperformance will often purchase the stock, further bidding its price higher and pushing the stock higher still
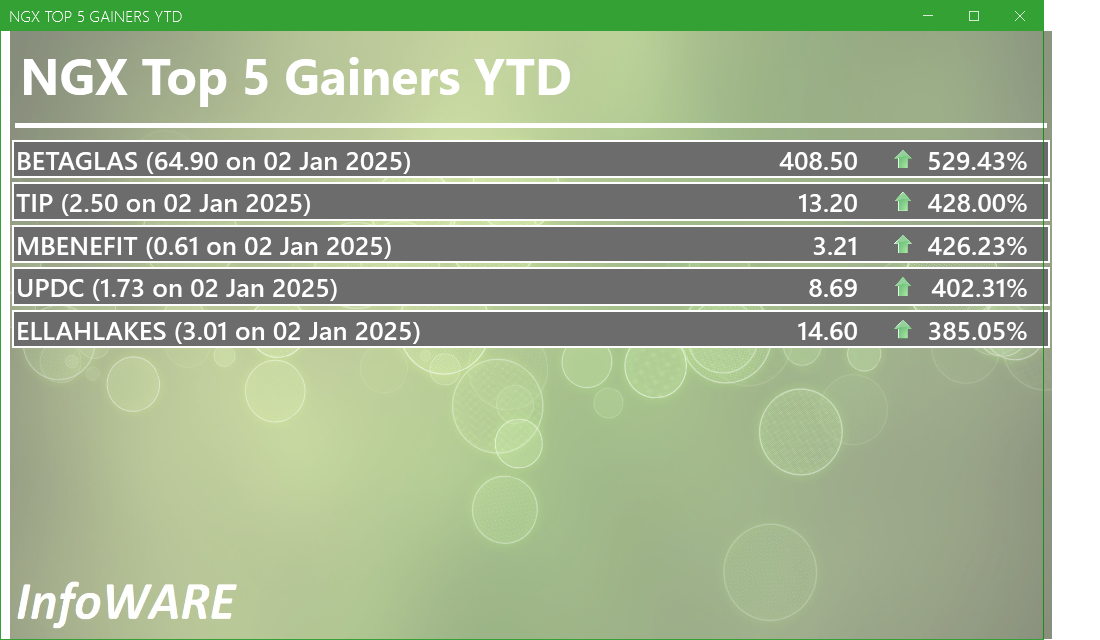
For more detailed analysis,
- On InfoWARE Market Data Terminal <T5YTD2> <GO>
- On InfoWARE Finance Mobile App ( Android , iPhone & iPad and Windows 10) , "Research"
NSE: Bull Signal - Price crossed above 15 Day MA
This signal implies these stocks are under buying pressure and the price might continue to rise and therefore positions should be monitored closely. Further suggested analysis include looking at the overall market (ASI) to see if the uptrend is market wide, sector wide or specific to the stock. Portfolio managers tend to use this as a signal to do more research to add to their positions or lock in some profits. Typically further analysis should be done using commands like PC and RV on the InfoWARE Market Data Terminal. Another command is ALERTS to set price triggers for possible exit or entry as necessary
For more detailed analysis,
- On InfoWARE Market Data Terminal <NSEPERF> <GO>
- On InfoWARE Finance Mobile App ( Android , iPhone & iPad and Windows 10) , "Top Gainers & Losers"
| Symbol | Price | %Chg | 15DMA | PE | EPS | DivY | MktCap | Vol | Trades | Value | LstTradeTime |
|---|---|---|---|---|---|---|---|---|---|---|---|
| FGSUK2031S4 | 96.94 | 12.32 | 89.83 | 0.00 | 0.00 | 1.75K | 2.00 | 1.70M | 11-Aug-2025 14:31:02.360 | ||
| AFRIPRUD | 16.70 | 6.29 | 15.97 | 19.57 | 0.61 | 1.27 | 33.40B | 3.54M | 281.00 | 58.61M | 11-Aug-2025 14:30:10.990 |
| FIDELITYBK | 21.20 | 0.47 | 21.14 | 13.24 | 1.17 | 5.48 | 614.27B | 9.42M | 884.00 | 199.06M | 11-Aug-2025 14:30:14.070 |
NSE: BEAR Signal - Price crossed below 15 Day MA
This signal implies these stocks are under selling pressure and the price might continue to slide and therefore positions should be monitored closely. Further suggested analysis include looking at the overall market (ASI) to see if the downtrend is market wide, sector wide or specific to the stock. If the overal market trend is upwards, then since these stocks are heading in the opposite direction, then further analysis should be done using commands like PC and RV on the InfoWARE Market Data Terminal. Another command is ALERTS to set price triggers for possible exit is necessar
For more detailed analysis,
- On InfoWARE Market Data Terminal <BEARM> <GO>
- On InfoWARE Finance Mobile App ( Android , iPhone & iPad and Windows 10)
| Symbol | Price | %Chg | 15DMA | PE | EPS | DivY | MktCap | Vol | Trades | Value | LstTradeTime |
|---|---|---|---|---|---|---|---|---|---|---|---|
| NB | 74.40 | -0.13 | 74.46 | 16.95 | 1.60 | 3.79 | 764.54B | 2.32M | 386.00 | 172.62M | 11-Aug-2025 14:30:15.103 |
| NGXOILGAS | 2,427.15 | -0.56 | 2,437.89 | 8.74 | 228.15 | 0.00 | 0.00 | 1.04M | 580.00 | 330.34M | 11-Aug-2025 14:30:21.360 |
| ZENITHBANK | 74.00 | -0.88 | 74.25 | 3.33 | 13.30 | 2.25 | 2,323.34B | 16.05M | 1,286.00 | 1.19B | 11-Aug-2025 14:30:58.930 |
| OMATEK | 1.28 | -5.47 | 1.29 | 6.82 | 0.10 | 0.00 | 3.77B | 11.23M | 135.00 | 14.56M | 11-Aug-2025 14:30:15.440 |
| OANDO | 53.00 | -5.66 | 56.07 | 24.10 | 2.53 | 1.15 | 658.86B | 5.38M | 987.00 | 284.08M | 11-Aug-2025 14:30:52.880 |
| BERGER | 34.10 | -9.97 | 34.34 | 14.18 | 1.22 | 1.15 | 9.88B | 1.54M | 159.00 | 53.40M | 11-Aug-2025 14:30:11.290 |
| WAPCO | 132.00 | -10.23 | 138.56 | 24.60 | 2.87 | 2.70 | 2,126.23B | 2.66M | 538.00 | 365.85M | 11-Aug-2025 14:30:53.913 |
| HMCALL | 4.36 | -11.01 | 4.54 | 0.00 | 0.00 | 0.00 | 0.00 | 2.77M | 77.00 | 12.15M | 11-Aug-2025 14:30:52.623 |
| ABCTRANS | 4.50 | -11.11 | 4.88 | 6.68 | 0.17 | 2.19 | 10.77B | 1.37M | 162.00 | 6.29M | 11-Aug-2025 14:30:10.873 |
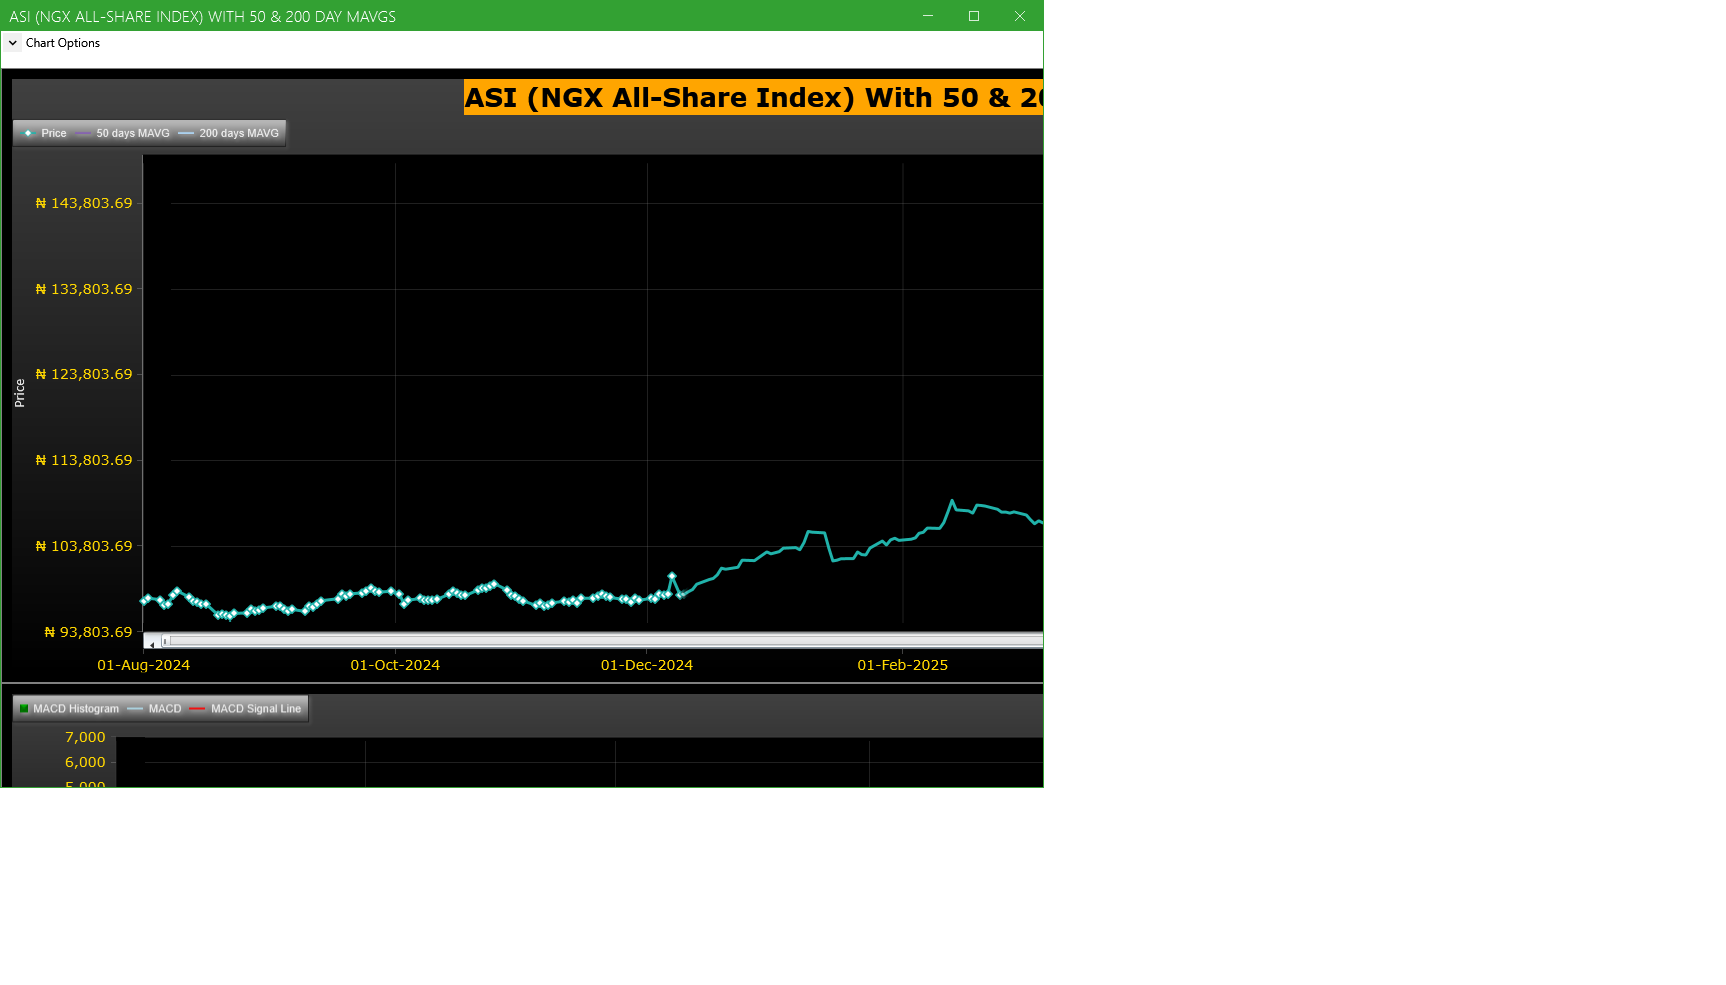
Market Trend - ASI (NGX All-Share-Index) With 50 & 200 Day MAvgs Chart
Technical traders typically use the 50 & 200 day moving averages to aid in choosing
where to enter or exit a position, which then causes these levels to act as strong
support or resistance. As a general guideline, if the price is above a moving average,
the trend is up. If the price is below a moving average, the trend is down.
It is important to note that critics of technical analysis say that moving averages act
as support and resistance because so many traders use these indicators to inform their
trading decisions. Also moving averages tend to work quite well in strong trending conditions
but poorly in choppy or ranging conditions.
Trading Strategies: Crossovers
Crossovers are one of the main moving average strategies. The first type is a price crossover,
which is when the price crosses above or below a moving average to signal a potential change
in trend. Another strategy is to apply two moving averages to a chart: one longer and one
shorter. When the shorter-term MA crosses above the longer-term MA, it is a buy signal, as
it indicates that the trend is shifting up. This is known as a golden cross. Meanwhile, when
the shorter-term MA crosses below the longer-term MA, it is a sell signal, as it indicates that
the trend is shifting down. This is known as a dead/death cross
For more detailed analysis,
- On InfoWARE Market Data Terminal <CI> <GO>
- On InfoWARE Finance Mobile App ( Android , iPhone & iPad and Windows 10) , "Research"
Unusual Volume: Volume traded is more than double the 90 day moving average (All exchanges; ASI & ASem). For more detailed analysis,
- On InfoWARE Market Data Terminal <UV> <GO>
- On InfoWARE Finance Mobile App ( Android , iPhone & iPad and Windows 10)
| Symbol | Name | Volume | 90DAvgVol | %VolChg | Price | LClose | %Chg | Trades | Value |
|---|---|---|---|---|---|---|---|---|---|
| LINKASSURE | LINKAGE ASSURANCE PLC | 703.59M | 28.82M | 2,341.50 | 2.26 | 2.06 | 9.71 | 451 | 1.59B |
| UNIVINSURE | UNIVERSAL INSURANCE COMPANY PLC | 230.54M | 28.85M | 699.21 | 1.21 | 1.10 | 10.00 | 424 | 278.91M |
| AIICO | AIICO INSURANCE PLC. | 154.73M | 26.03M | 494.33 | 3.85 | 3.50 | 10.00 | 1,291 | 595.34M |
| STERLINGNG | STERLING FINANCIAL HOLDINGS COMPANY PLC | 120.20M | 17.02M | 606.22 | 8.25 | 8.35 | -1.20 | 1,010 | 987.86M |
| VERITASKAP | VERITAS KAPITAL ASSURANCE PLC | 74.56M | 16.83M | 342.95 | 2.31 | 2.10 | 10.00 | 588 | 164.62M |
Investment Insights - High Div. Stocks
Dividend stocks distribute a portion of the company earnings to investors on a regular basis and they can a great choice for investors looking for regular income. As an investment or trading strategy, high dividend yield equities provide annual cash payments as against mostly capital gains in the price of a stock. The list in the table below represent the highest dividend paying stocks from the list of the most liquid stocks in the NSE top 30.
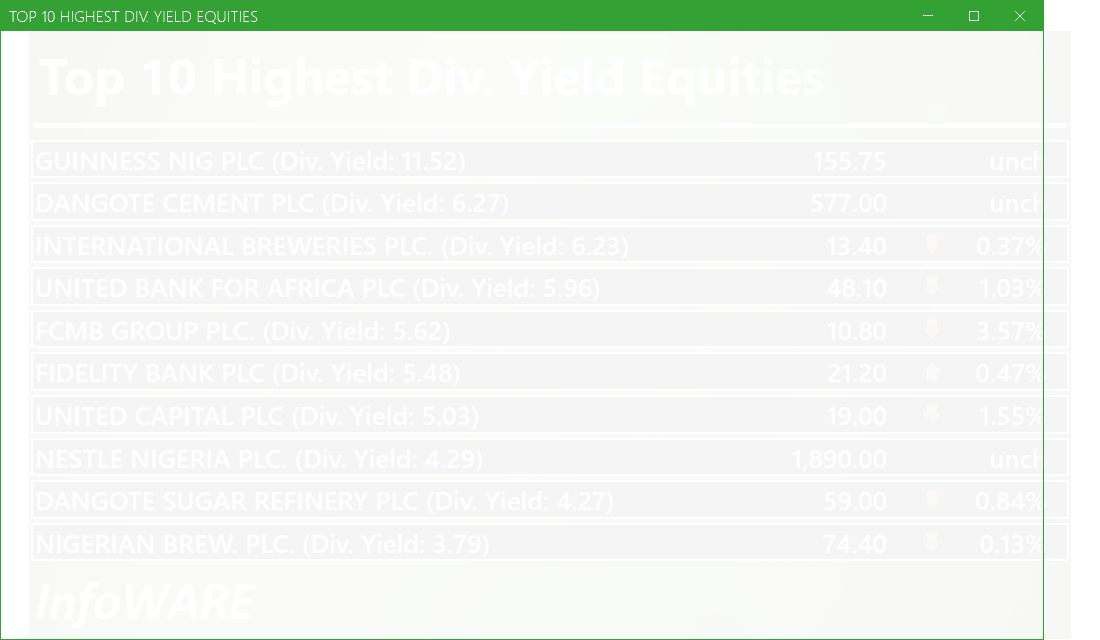
For more detailed analysis,
- On InfoWARE Market Data Terminal <HYIELD> <GO>
- On InfoWARE Finance Mobile App ( Android , iPhone & iPad and Windows 10) , "Research"
Investment Insights - Stocks outperforming the ASI but with approximately the same risk
These list of stocks represent equities that are less risky than the ASI but doing better than the ASI (All Shares Index) using the YTD (Year to Date) returns as the measure. The risk is measured by Beta. Beta is an assessment of a stock's tendency to undergo price changes, (its volatility), as well as its potential returns compared to the ASI. It is expressed as a ratio, where a score of 1 represents performance comparable to the ASI, and returns above or below the market may receive scores greater or lower than 1.
For a full list of both positively and negatively corelated stocks visit InfoWARE Market Data Terminal
- On InfoWARE Market Data Terminal <BANL> <GO>
- On InfoWARE Finance Mobile App ( Android , iPhone & iPad and Windows 10)
| Symbol | DivYield | PE | EPS | Beta | %ChgYTD | ASIYTDReturn | BetaDiff |
|---|---|---|---|---|---|---|---|
| HONYFLOUR | 1.40 | 16.28 | 0.31 | 0.99 | 235.98 | 41.45 | 0.01 |
| CAVERTON | 5.52 | 1.15 | 1.57 | 0.98 | 173.33 | 41.45 | 0.02 |
| ROYALEX | 7.81 | 0.00 | 0.00 | 0.96 | 138.18 | 41.45 | 0.04 |
| CORNERST | 5.28 | 8.62 | 0.35 | 0.93 | 78.03 | 41.45 | 0.07 |
| VERITASKAP | 4.17 | 48.77 | 0.02 | 0.88 | 55.03 | 41.45 | 0.12 |
| UNIVINSURE | 0.00 | 0.00 | 0.00 | 0.83 | 68.06 | 41.45 | 0.17 |
| FTNCOCOA | 1.60 | 0.00 | 0.00 | 0.79 | 216.49 | 41.45 | 0.21 |
| NB | 3.79 | 16.95 | 1.60 | 0.79 | 132.50 | 41.45 | 0.21 |
| MAYBAKER | 3.75 | 58.94 | 0.14 | 0.78 | 107.45 | 41.45 | 0.22 |
| WAPIC | 2.56 | 72.55 | 0.02 | 0.76 | 49.80 | 41.45 | 0.24 |
African Markets
| Name | LClose | Change | %Chg |
|---|---|---|---|
| BRVM Stock Exchange | 311.72 | -0.22 | -0.07 |
| Botswana Stock Exchange | 10,527.93 | 15.77 | 0.15 |
| Egyptian Exchange | 35,809.36 | 329.96 | 0.93 |
| Ghana Stock Exchange | 7,386.41 | 62.98 | 0.86 |
| Johannesburg Stock Exchange | 100,855.21 | 211.35 | 0.21 |
| Lusaka Stock Exchange | 21,524.31 | -8.61 | -0.04 |
| Casablanca Stock Exchange | 19,818.76 | 39.56 | 0.20 |
| Malawi Stock Exchange | 425,534.71 | 11,550.17 | 2.79 |
| Nigeria Stock Exchange | 145,754.91 | -820.82 | -0.56 |
| Nairobi Securities Exchange | 161.19 | 0.21 | 0.13 |
| Namibian Stock Exchange | 1,769.75 | 7.58 | 0.43 |
| Rwanda Stock Exchange | 150.61 | 0.18 | 0.12 |
| Tunis Stock Exchange | 11,864.07 | 43.74 | 0.37 |
| Uganda Securities Exchange | 1,354.38 | 4.72 | 0.35 |
Nigeria Market Indexes
| Symbol | LClose | %Chg | WTD% | MTD% | QTD% | YTD% | MktCap | Trades |
|---|---|---|---|---|---|---|---|---|
| ASI | 145,948.47 | 0.13 | 0.00 | 3.32 | 21.89 | 41.45 | 37,731 | |
| NGX30 | 5,329.73 | 0.04 | 0.00 | 2.78 | 12.83 | 39.71 | 17,938 | |
| NGXAFRBVI | 3,786.65 | 0.30 | 0.00 | -0.72 | 6.86 | 52.64 | 6,134 | |
| NGXAFRHDYI | 23,174.64 | 0.44 | 0.00 | -0.22 | 10.81 | 36.10 | 7,350 | |
| NGXASEM | 1,553.39 | 0.00 | 0.00 | 7.40 | -2.62 | -1.91 | 26 | |
| NGXBNK | 1,613.90 | 0.44 | 0.00 | -0.31 | 6.83 | 48.42 | 7,881 | |
| NGXCG | 4,269.87 | -0.10 | 0.00 | -0.74 | 24.17 | 50.92 | 17,692 | |
| NGXCNSMRGDS | 3,254.44 | 0.98 | 0.00 | 9.33 | -6.18 | 87.65 | 4,545 | |
| NGXCOMMDTY | 1,070.39 | 0.00 | 0.00 | -2.33 | 2.21 | 7.04 | ||
| NGXGROWTH | 10,100.98 | -0.89 | 0.00 | -8.74 | 6.22 | 30.12 | 390 | |
| NGXINDUSTR | 5,416.31 | -1.47 | 0.00 | 7.13 | 53.75 | 51.65 | 3,225 | |
| NGXINS | 1,372.40 | 9.74 | 0.00 | 54.73 | 85.81 | 74.56 | 5,700 | |
| NGXLOTUSISLM | 11,938.41 | -0.93 | 0.00 | 2.69 | 24.69 | 71.34 | 6,536 | |
| NGXMAINBOARD | 6,992.12 | 0.65 | 0.00 | 5.32 | 18.53 | 39.73 | 29,477 | |
| NGXMERIGRW | 10,301.84 | -0.41 | 0.00 | -0.07 | 6.73 | 57.93 | 5,667 | |
| NGXMERIVAL | 14,192.56 | -1.06 | 0.00 | -2.30 | 18.79 | 36.07 | 8,610 | |
| NGXOILGAS | 2,427.15 | -0.56 | 0.00 | -0.39 | 1.46 | -10.48 | 580 | |
| NGXPENBRD | 2,696.68 | 0.17 | 0.00 | 3.47 | 17.28 | 47.23 | 29,816 | |
| NGXPENSION | 6,901.08 | -0.05 | 0.00 | -0.19 | 8.60 | 52.21 | 20,845 | |
| NGXPREMIUM | 14,733.94 | -0.83 | 0.00 | -0.22 | 28.46 | 51.38 | 7,864 | |
| NGXSOVBND | 673.03 | 0.00 | 0.00 | 0.02 | 2.99 | 11.88 | 0 |
For more detailed analysis,
- On InfoWARE Market Data Terminal <MKTINS> <GO>
- On InfoWARE Finance Mobile App ( Android, iPhone & iPad and Windows 10) , "Market Indexes"
Find the topic interesting? Will like to comment? Contact Us at solutions@infowarelimited.com
Top News

Chart Of The Day - ASI Chart Vs ASI Advance Decline Line (YTD) (12-Aug-2025 15:06:59.143)
InfoWARE AI Analyst Daily Market Report: 12-Aug-2025

[OANDO]>>Corporate Disclosures-<OANDO PLC>
[OANDO]>>Corporate Disclosures-<OANDO PLC>
[XNSA]>> CORDROS MILESTONE FUNDS' BID & OFFER PRICES
[VETINDETF]>> DAILY INDICATIVE PRICES
[XNSA]>> CIS ACADEMY TRAINING
[XNSA]>> DAILY FUND PRICE SUBMISSION - FCMB ASSET MANAGEMENT LIMITED
[XNSA]>> NGX NON-INTEREST FINANCE BOARD LAUNCH COMMUNIQUE
[XNSA]>> SAVE THE DATE: 29TH ANNUAL STOCKBROKERS CONFERENCE
[XNSA]>> CHAMS HOLDING COMPANY PLC: ACTIVATION OF CODE FOR TRADING IN RIGHTS
[XNSA]>> NOTIFICATION OF PRICE ADJUSTMENT
Chart Of The Day - ASI Chart Vs ASI Advance Decline Line (YTD) (11-Aug-2025 15:10:12.070)
InfoWARE AI Analyst Daily Market Report: 11-Aug-2025
[XNSA]>> CORDROS MILESTONE FUNDS' BID & OFFER PRICES
[VETBANK]>> DAILY INDICATIVE PRICES
[XNSA]>> CIS ACADEMY TRAINING
[XNSA]>> EMERGING AFRICA DAILY FUND PRICES
[XNSA]>> NGX NON-INTEREST FINANCE BOARD LAUNCH COMMUNIQUE
[XNSA]>> SAVE THE DATE: 29TH ANNUAL STOCKBROKERS CONFERENCE
[SIAMLETF40]>> DAILY INDICATIVE PRICES
[XNSA]>> NOTIFICATION OF PRICE ADJUSTMENT
InfoWARE AI Analyst Weekly Market Report: 08-Aug-2025
Chart Of The Day - ASI Chart Vs ASI Advance Decline Line (YTD) (08-Aug-2025 15:07:22.279)
InfoWARE AI Analyst Daily Market Report: 08-Aug-2025
[MBENEFIT]>>Corporate Disclosures-<MUTUAL BENEFITS ASSURANCE PLC.>
[XNSA]>> NORRENBERGER MUTUAL FUNDS WEEKLY UPDATE
[XNSA]>> EMERGING AFRICA DAILY FUND PRICES
[STANBIC]>>Corporate Disclosures-<STANBIC IBTC HOLDINGS PLC>
[XNSA]>> CIS ACADEMY TRAINING
Get IDIA - the stock trading app for the modern investor
Solutions by Business
Product Suites
Company
Contacts
- 8th Floor,
- South Atlantic Petroleum Towers,
- 1 Adeola Odeku Street,
- Victoria Island,
- Lagos, Nigeria.
- Email: solutions@infowarelimited.com
Follow Us
 |
 |
 |
 |