


InfoWARE AI Analyst Daily Market Report: 12-Aug-2025 | InfoWARE Finance
Get IDIA - the stock trading app for the modern investor


InfoWARE AI Analyst Daily Market Report: 12-Aug-2025
(Source: InfoWARE Terminal, Date: 12-Aug-2025)
Dear Investor,
NGX Market Wrap – Tuesday, August 12, 2025
Today, the NGX All Share Index rebounded slightly, closing up by 0.12% to settle at 145,880.77. This brings the YTD performance to an impressive 41.55%, cementing the bourse’s status as one of the more resilient global equity markets year-to-date. Turnover was robust, rising 22.84% to ₦22.62bn, despite a notable 39% drop in total volume traded (1.24bn vs previous 2.04bn). Market breadth favored the bulls (1.51x), with 53 advancers overshadowing 35 decliners, and strong pockets of momentum across insurance, small-cap, and some banking stocks.
However, trading activity revealed a marked skew towards institutional dominance by value, as they accounted for 88.34% of total trade value, despite making up only 41.91% of deals. This suggests a concentration of big-ticket flows in select blue-chips, contrasting with active (yet smaller) retail participation across the wider market.
Market Breadth & Noteworthy Trends
- Advancers/Decliners & Breadth: 53 stocks rose versus 35 that fell, yielding a healthy breadth (1.51x). Volume increased for 69 companies but dipped for 71—a nuanced indicator of rotation as investors took profits and repositioned.
-
Top Gainers:
- ELLAHLAKES (ELLAH LAKES PLC.): +10.0% to ₦16.06, driven by robust momentum (RSI: 74.65), clear overbought technicals, and a bullish MACD crossover.
- CHAMPION (CHAMPION BREW. PLC.): +10.0% to ₦17.38, RSI at 63.70 and strong 5-day return. Underlying accumulation continues.
- PRESTIGE (PRESTIGE ASSURANCE): +10.0%, RSI at 83.99 (deeply overbought – caution for late entrants).
- WAPIC (WAPIC INSURANCE): +10.0%, RSI: 80.15 – at multi-year overbought levels, flagging unsustainable short-term demand.
- ABCTRANS—A nuanced case, see contrarian signals below.
-
Top Losers:
- UNILEVER: -9.97% to ₦71.3, but RSI is extremely high (93.87), hinting at a blow-off move after a parabolic run—possible short-term exhaustion?
- CUSTODIAN: -9.55%, RSI still elevated (75.79) despite sharp sequential drops, suggesting heavy "catch-up” selling or institutional rotation.
- Other losers include ACADEMY PRESS (-7.78%), MAYBAKER (-7.69%), WEMABANK (-6.05%), all with midline RSI readings, indicating more room for volatility and two-sided action.
- YTD Trend Overlaps: Multiple insurance names (MANSARD, MBENEFIT, AIICO, SOVRENINS) dominate the YTD gainers' table, reflecting sustained sector-wide accumulation and speculative momentum plays. Conversely, some recent top gainers appear in overbought lists, warning of likely near-term profit-taking.
Year-To-Date Top 5 Gainers and Losers
| Name | Price | YTD %Chg | 5-Dys % | 1Dy % | RSI | DivYield |
|---|---|---|---|---|---|---|
| MUTUAL BENEFITS (MBENEFIT) | 3.21 | 478.7% | 32.71% | 9.97% | 94.95 | 3.28% |
| ELLAHLAKES | 14.60 | 433.6% | 32.95% | 10.0% | 74.65 | 0.0% |
| CHAMPION | 15.80 | 356.2% | 32.67% | 10.0% | 63.70 | 0.41% |
| AIICO | 3.85 | 169.4% | 32.60% | 9.87% | 88.68 | 4.13% |
| SOVEREIGN TRUST (SOVRENINS) | 2.99 | 166.7% | 32.26% | 9.70% | 81.75 | 3.75% |
| Name | Price | YTD %Chg | 5-Dys % | 1Dy % | RSI | DivYield |
|---|---|---|---|---|---|---|
| HALDANE MCCALL (HMCALL) | 4.36 | -10.27% | -9.71% | 0.23% | 46.10 | 0.0% |
| CHAMS | 2.61 | 18.6% | -14.14% | -4.60% | 45.11 | 1.56% |
| UACN | 75.25 | 116.99% | -12.27% | -4.98% | 59.01 | 1.00% |
| CUSTODIAN | 41.90 | 121.64% | -14.25% | -9.55% | 75.79 | 1.20% |
| UNILEVER | 79.20 | 98.06% | -10.54% | -9.97% | 93.87 | 2.81% |
Deeper Insights & Predictive Notes
- Turnover Surge: Despite the drop in volume, the jump in turnover suggests significant institutional transactions in large-cap names, confirmed by the trading activity breakdown (88.34% of value from institutional investors).
- Volume Rotation: Only 69 companies saw higher volume, yet several stocks posted massive surges (see Unusual Volume below), underlining targeted speculative action.
- Unusual Volume Standouts:
- LASACO traded a staggering 1,466% above its 90-day average; price rallied 9.90%—potential accumulation or block trades.
- JAPAULGOLD up 9.29% on 187% of average volume, and on the bullish momentum list (price above 15DMA), with high Beta (1.92)—watch for possible near-term reversal or breakout continuity.
- AIICO, ROYALEX (both insurance) logged >130% and 154% spikes in activity, aligning with insurance sector dominance on the YTD winners’ board.
- STERLINGNG saw a price dip (-1.94%) amidst a >400% surge in volume – indicative of supply/demand imbalance or block distribution.
-
Momentum Technicals:
- Several high-flyers feature blisteringly high RSI readings (AIICO, PRESTIGE, MBENEFIT, WAPIC: all above 80), showing frothy demand—traders should brace for volatility or profit-taking soon.
- Bullish crossovers (Price > 15DMA): JAPAULGOLD, ABCTRANS, and more. Many are also YTD or recent gainers—a virtuous reinforcing cycle for mo-mo buyers, but risk increases with crowding.
- Bearish crossovers despite rising market: WEMABANK, UNILEVER, UACN, OKOMUOIL—contrarian alarms, especially since they underperform with the general index still rising.
- YTD Gainers Overlap: ELLAHLAKES, CHAMPION, PRESTIGE feature prominently both today and in the YTD tables—pressure risks of "overextension.”
- Dividend Alert: Several high-yield names are not present in momentum lists—defensive investors could look at AFRIPRUD (1.27% yield, Beta: 0.64) for relative safety.
Contrarian Signals & Hidden Patterns
- UNILEVER: Dropped -9.97% today, but RSI is at a sky-high 93.9, an unusually strong reading for a name under selling pressure. This may signal either an imminent bounce or that smart money is exiting after a crowded long trade.
- ABCTRANS: Gained 10.0% with RSI dropping sharply (from 65.68 to 49.87) despite +9.09% above 15DMA. Bullish price, but rapidly deteriorating momentum—flash warning on sustainability.
- CHAMPION: Despite only modest RSI (54.4 previously), bullish MACD and robust price action, yet YTD is -9.8%. Could signal bottoming out or reversal—worth closer monitoring.
- CUSTODIAN: Strong YTD, but suddenly severe weekly/daily losses and still overbought RSI – bearish divergence.
- Some bear momentum banks: (FIDELITYBK, WEMABANK) are underperforming by price and moving average signals, despite sector peers seeing inflows; possible risk-off signaling or specific rotation within large banks.
Sector Heatmap
| Sector | Perf | Retail %Trd | Inst. %Trd | Key Gainer(s) |
|---|---|---|---|---|
| Insurance | Strong | High | Moderate | MBENEFIT, PRESTIGE, AIICO |
| Energy/Mining | Positive | High | Moderate | JAPAULGOLD |
| Banking | Mixed | Active | Very High | FCMB, ACCESSCORP |
| Consumer Goods | Weak | Medium | High | UNILEVER (Drop), MAYBAKER |
| Agric/Small-Cap | Positive | Speculative | Low | ELLAHLAKES, TIP |
Dividend-Yield vs Beta Matrix
| Stock | DivYield | Beta | Momentum |
|---|---|---|---|
| AFRIPRUD | 1.27% | 0.64 | Bearish (Below 15DMA) |
| WAPCO | 2.87% | 1.17 | Bullish (Above 15DMA) |
| ZENITHBANK | 2.25% | 1.20 | Flat (Institutionally Active) |
| JAPAULGOLD | 0.90% | 1.92 | Bullish (Unusual Volume) |
| CAVERTON | 5.52% | 0.98 | Bullish |
Institutional Activity (Top Alerts)
| Stock | Inst. TradeValue % | Notes |
|---|---|---|
| ZENITHBANK | 8.06% | High institutional interest, subdued price action—possible stealth repositioning. |
| ACCESSCORP | 6.43% | Elevated block trades, but price slightly lower—potential for rebound if blocks absorbed. |
| GTCO | 10.61% | Heavy flows, but no price lift—distribution? |
| FCMB | 2.43% | Strong volume, price up, positive divergence. |
| UBA | 3.10% | Solid mix of retail (19%) and institutions, price modestly higher. |
Dividend Yield + Momentum Overlap
- AFRIPRUD: High-yield (1.27%), low-beta, but in bearish momentum (below 15DMA). Value/defensive investors must weigh yield against near-term price weakness—could be a falling knife or an opportunity on further weakness.
- CAVERTON: Offers both high yield and above-15DMA status. Early "sweet spot” for income-and-growth seekers—watch volume for signs of broadening demand.
Trading Suggestions & Cautions
-
Short-term traders:
- Insurance plays are overbought and crowded—winners (MBENEFIT, PRESTIGE, AIICO) are high-risk for sharp reversals/profit-taking. Tight stops advised.
- JAPAULGOLD, ELLAHLAKES, CHAMPION: Remain in breakout mode. Look for parabolic move reversals or momentum confirmations via sector flows and MACD/RSI combo.
- UNILEVER, CUSTODIAN, WEMABANK: Are in "blow-off” mode to the downside with elevated RSI. Mean reversion trades could be triggered, but volatility will likely remain high.
- Banks (ZENITHBANK, ACCESSCORP, GTCO): Flat prices, high institutional flows—potential stealth accumulation. Consider call options or small staggered entries.
-
For defensive/income investors:
- Watch AFRIPRUD and CAVERTON for attractive entry—downside momentum may offer bargains.
- Contrarians: Scan for reversal setups in overbought gainers or oversold losers with rising RSI/MACD divergences.
- Bullish momentum names (above 15DMA): JAPAULGOLD, TIP, WAPCO, CAVERTON. Many are small/mid-caps—size positions accordingly.
Market Activity & Trade Flow Analysis
-
Institutional vs Retail:
- Trade Count: 41.9% institutional, 58.1% retail—retail remains the "liquidity provider.” However, by value, institutions dominate (88.34%), showing that large-value block trades were concentrated in fewer names.
- Top Institutional Trades: ACCESSCORP, ZENITHBANK, GTCO, UBA, FCMB—core banking blue chips. Despite heavy block flows, prices are mostly flat, suggesting distribution or accumulation without chasing.
- Top Retail Trades: MTNN, ACCESSCORP, UBA, GTCO, ZENITHBANK. Retail gravitated toward both "cheap” high-float banking names and tier-1 Telco (MTNN).
- Correlation: Insurance stocks which dominated gainers/YTD lists are underrepresented among top institutionally traded by value. Institutions are likely keeping to large-caps (banks, reliable cashflows).
- Actionable insight: If institutional flows shift toward currently speculative winners (insurance/energy small-caps), potential for sharp rallies exists; but if profit-taking sets in, downward price velocity could match recent surges.
- High Volume Spots: LASACO, JAPAULGOLD, STERLINGNG, AIICO, ROYALEX. Many also feature on the insurance breakouts/YTD gainers.
|
Top ASI Gainers Over Last 5 Trading Days
|
Top ASI Losers Over Last 5 Trading Days
|
For more detailed analysis, on InfoWARE Market Data Terminal <NSEPERF> <GO>
On InfoWARE Finance Mobile App (Android, iPhone & iPad, Windows Phone and Windows 8/10), "Top Gainers & Losers"
ELLAH LAKES PLC. (ELLAHLAKES) topped the advancers list closing at N16.06 with a gain of 10.00% followed by ASSOCIATED BUS COMPANY PLC (ABCTRANS) which closed at N4.95 with a gain of 10.00%.
On the flip side JULI PLC. (JULI) and UNILEVER NIGERIA PLC. (UNILEVER) topped the decliners log with a loss of -10.00% at a close of N9.00, and -9.97% to close the day at N71.30 respectively.
| Symbol | LClose | %Chg |
|---|---|---|
| ELLAHLAKES | 16.06 | 10.00 |
| ABCTRANS | 4.95 | 10.00 |
| CHAMPION | 17.38 | 10.00 |
| MANSARD | 17.71 | 10.00 |
| MERGROWTH | 884.40 | 10.00 |
For more detailed analysis,
- On InfoWARE Market Data Terminal <TOPG> <GO>
- On InfoWARE Finance Mobile App ( Android, iPhone & iPad and Windows 10) , "Top Gainers & Losers"
Currency Market
In the currency market, the Naira was unchanged against the dollar at 1 to 1NSE: Bull Signal - Price crossed above 15 Day MA
This signal implies these stocks are under buying pressure and the price might continue to rise and therefore positions should be monitored closely. Further suggested analysis include looking at the overall market (ASI) to see if the uptrend is market wide, sector wide or specific to the stock. Portfolio managers tend to use this as a signal to do more research to add to their positions or lock in some profits. Typically further analysis should be done using commands like PC and RV on the InfoWARE Market Data Terminal. Another command is ALERTS to set price triggers for possible exit or entry as necessary
For more detailed analysis,
- On InfoWARE Market Data Terminal <NSEPERF> <GO>
- On InfoWARE Finance Mobile App ( Android , iPhone & iPad and Windows 10) , "Top Gainers & Losers"
| Symbol | Price | %Chg | 15DMA | PE | EPS | DivY | MktCap | Vol | Trades | Value | LstTradeTime |
|---|---|---|---|---|---|---|---|---|---|---|---|
| FGS202772 | 130.00 | 46.15 | 94.00 | 0.00 | 0.00 | 100.00 | 1.00 | 130.00K | 12-Aug-2025 14:30:49.360 | ||
| FGSUK2027S3 | 90.00 | 14.44 | 79.60 | 0.00 | 0.00 | 72.00 | 2.00 | 64.85K | 12-Aug-2025 14:31:35.067 | ||
| ABCTRANS | 4.95 | 9.09 | 4.87 | 6.68 | 0.17 | 2.19 | 11.84B | 1.49M | 128.00 | 7.12M | 12-Aug-2025 14:30:18.650 |
| TIP | 14.52 | 9.09 | 13.98 | 0.00 | 12.92B | 4.88M | 225.00 | 70.37M | 12-Aug-2025 14:31:29.307 | ||
| JAPAULGOLD | 2.94 | 8.50 | 2.79 | 0.19 | 12.01 | 0.90 | 18.41B | 106.90M | 710.00 | 302.66M | 12-Aug-2025 14:31:21.527 |
| NGXGROWTH | 10,773.12 | 6.24 | 10,449.19 | 18.83 | 0.18 | 0.00 | 0.00 | 8.25M | 351.00 | 82.28M | 12-Aug-2025 14:30:51.930 |
| OMATEK | 1.36 | 5.88 | 1.28 | 6.82 | 0.10 | 0.00 | 4.00B | 6.28M | 112.00 | 8.66M | 12-Aug-2025 14:30:37.137 |
| WAPCO | 140.00 | 5.71 | 139.49 | 24.60 | 2.87 | 2.70 | 2,255.09B | 4.16M | 512.00 | 551.21M | 12-Aug-2025 14:31:23.047 |
| FTNCOCOA | 6.30 | 5.56 | 6.28 | 0.00 | 0.00 | 1.60 | 24.57B | 6.02M | 309.00 | 36.40M | 12-Aug-2025 14:30:21.780 |
| CAVERTON | 7.20 | 3.19 | 7.13 | 1.15 | 1.57 | 5.52 | 24.12B | 3.31M | 132.00 | 23.01M | 12-Aug-2025 14:30:20.277 |
| FGS202762 | 94.64 | 0.00 | 94.64 | 0.00 | 0.00 | 0.00 | 0.00 | 0.00 | 12-Aug-2025 14:30:49.150 | ||
| FGSUK2032S5 | 98.00 | 0.00 | 97.29 | 0.00 | 0.00 | 0.00 | 0.00 | 0.00 | 12-Aug-2025 14:31:35.110 |
NSE: BEAR Signal - Price crossed below 15 Day MA
This signal implies these stocks are under selling pressure and the price might continue to slide and therefore positions should be monitored closely. Further suggested analysis include looking at the overall market (ASI) to see if the downtrend is market wide, sector wide or specific to the stock. If the overal market trend is upwards, then since these stocks are heading in the opposite direction, then further analysis should be done using commands like PC and RV on the InfoWARE Market Data Terminal. Another command is ALERTS to set price triggers for possible exit is necessar
For more detailed analysis,
- On InfoWARE Market Data Terminal <BEARM> <GO>
- On InfoWARE Finance Mobile App ( Android , iPhone & iPad and Windows 10)
| Symbol | Price | %Chg | 15DMA | PE | EPS | DivY | MktCap | Vol | Trades | Value | LstTradeTime |
|---|---|---|---|---|---|---|---|---|---|---|---|
| FG192038S2 | 97.00 | 0.00 | 97.00 | 0.00 | 0.00 | 0.00 | 0.00 | 0.00 | 12-Aug-2025 14:30:47.050 | ||
| FGS202669 | 96.31 | 0.00 | 96.31 | 0.00 | 0.00 | 0.00 | 0.00 | 0.00 | 12-Aug-2025 14:30:48.983 | ||
| OKOMUOIL | 1,020.00 | 0.00 | 1,024.53 | 65.18 | 5.63 | 0.54 | 972.99B | 71.70K | 400.00 | 71.53M | 12-Aug-2025 14:30:37.110 |
| FIDELITYBK | 21.00 | -0.95 | 21.09 | 13.24 | 1.17 | 5.48 | 608.47B | 24.42M | 725.00 | 513.22M | 12-Aug-2025 14:31:21.490 |
| TANTALIZER | 2.59 | -3.09 | 2.62 | 0.00 | 0.00 | 1.50 | 8.32B | 4.38M | 142.00 | 11.06M | 12-Aug-2025 14:30:38.470 |
| AFRIPRUD | 15.90 | -5.03 | 15.96 | 19.57 | 0.61 | 1.27 | 31.80B | 3.73M | 201.00 | 59.39M | 12-Aug-2025 14:30:18.927 |
| UACN | 71.50 | -5.24 | 74.85 | 9.38 | 2.35 | 1.00 | 209.22B | 4.58M | 497.00 | 319.01M | 12-Aug-2025 14:30:38.937 |
| LIVESTOCK | 8.45 | -5.33 | 8.57 | 0.00 | 0.00 | 2.94 | 25.35B | 4.09M | 127.00 | 34.60M | 12-Aug-2025 14:30:35.283 |
| WEMABANK | 21.75 | -6.44 | 21.89 | 216.91 | 0.04 | 5.81 | 279.66B | 3.91M | 343.00 | 88.08M | 12-Aug-2025 14:31:21.827 |
| NGXASEM | 1,400.53 | -10.91 | 1,486.13 | 1.55 | 0.34 | 0.00 | 0.00 | 101.70K | 6.00 | 915.30K | 12-Aug-2025 14:30:51.833 |
| UNILEVER | 71.30 | -11.08 | 73.41 | 67.09 | 0.40 | 2.81 | 409.62B | 4.19M | 238.00 | 299.20M | 12-Aug-2025 14:30:39.127 |
| JULI | 9.00 | -11.11 | 9.56 | 0.00 | 0.00 | 0.68 | 1.80B | 101.70K | 6.00 | 915.30K | 12-Aug-2025 14:30:39.810 |
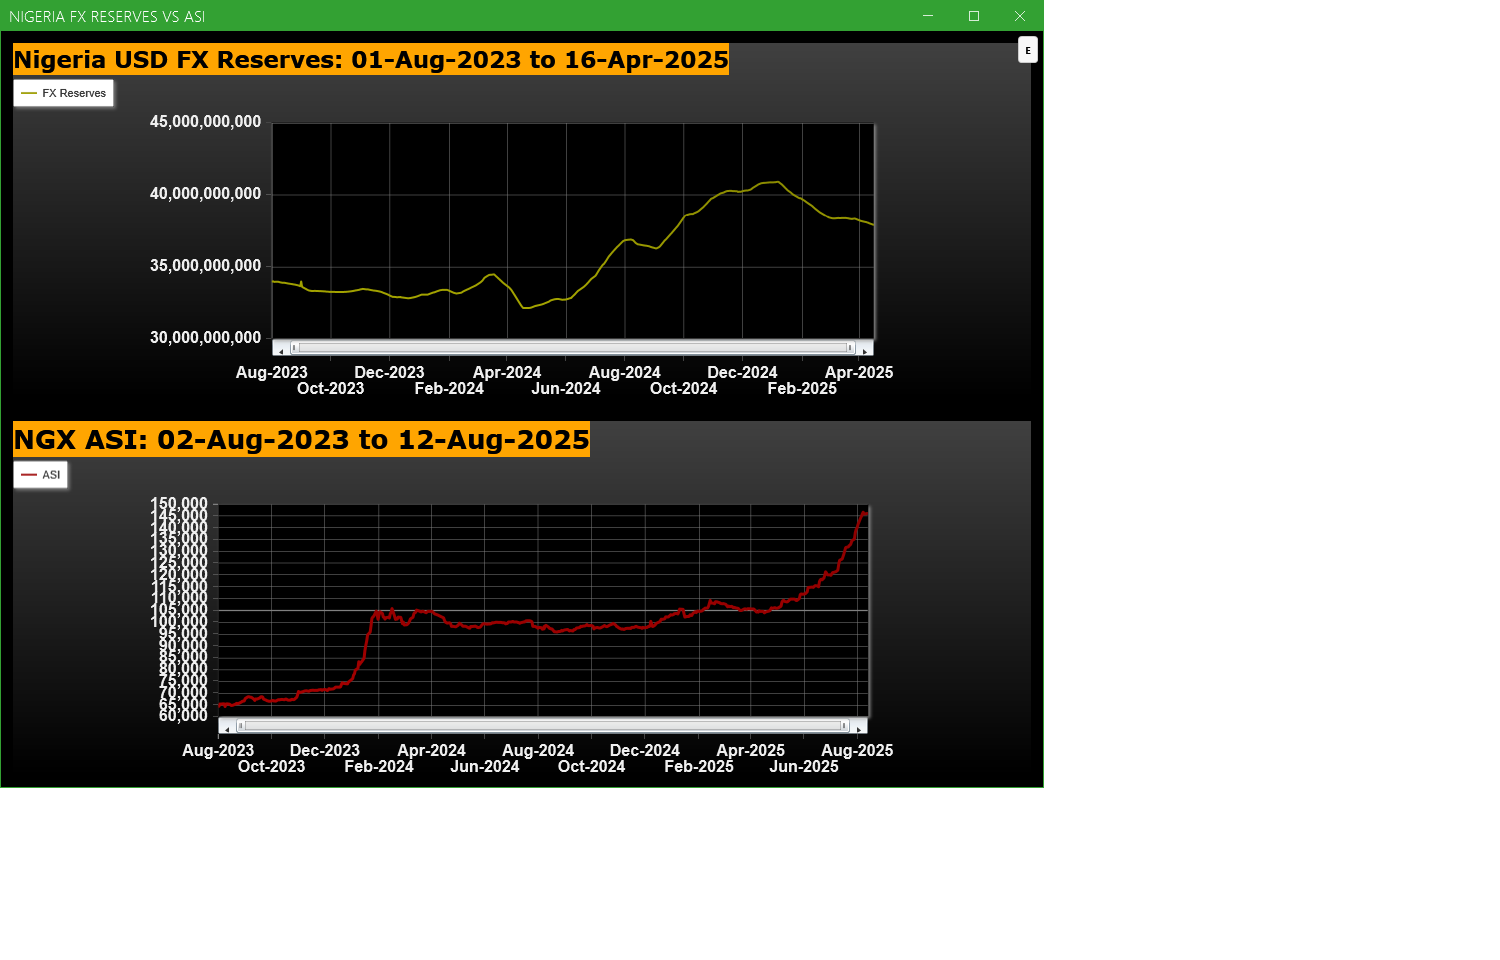
Economic Indicators - Nigeria FX Reserves Vs ASI Chart
Nigeria FX Reserves are assets held on reserve by CBN in foreign currencies. These reserves are used to back liabilities and influence monetary policy. Given the nature of the Nigeria economy, FX Reserves can appear to have an outsize influence on the economy and hence on the capital market. The chart below allows comparison of FX Reserves against the ASI to make investment decisions
For more detailed analysis,
- On InfoWARE Market Data Terminal <CI> <GO>
- On InfoWARE Finance Mobile App ( Android , iPhone & iPad and Windows 10) , "Research"
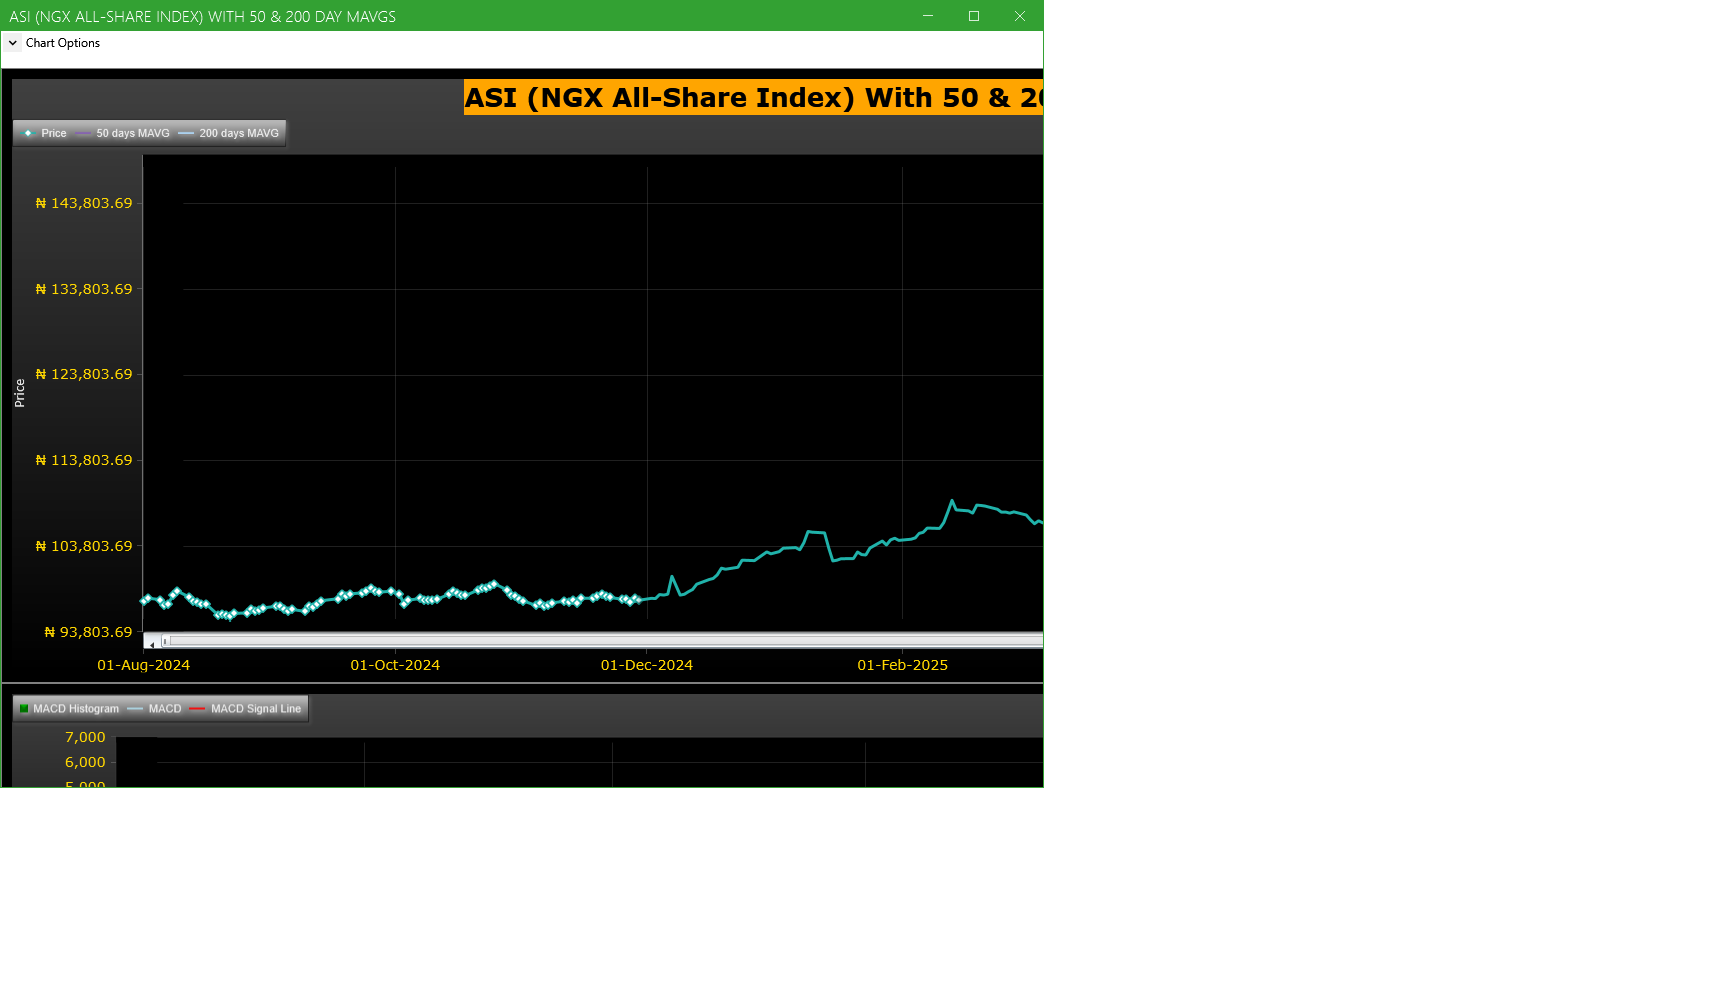
Market Trend - ASI (NGX All-Share-Index) With 50 & 200 Day MAvgs Chart
Technical traders typically use the 50 & 200 day moving averages to aid in choosing
where to enter or exit a position, which then causes these levels to act as strong
support or resistance. As a general guideline, if the price is above a moving average,
the trend is up. If the price is below a moving average, the trend is down.
It is important to note that critics of technical analysis say that moving averages act
as support and resistance because so many traders use these indicators to inform their
trading decisions. Also moving averages tend to work quite well in strong trending conditions
but poorly in choppy or ranging conditions.
Trading Strategies: Crossovers
Crossovers are one of the main moving average strategies. The first type is a price crossover,
which is when the price crosses above or below a moving average to signal a potential change
in trend. Another strategy is to apply two moving averages to a chart: one longer and one
shorter. When the shorter-term MA crosses above the longer-term MA, it is a buy signal, as
it indicates that the trend is shifting up. This is known as a golden cross. Meanwhile, when
the shorter-term MA crosses below the longer-term MA, it is a sell signal, as it indicates that
the trend is shifting down. This is known as a dead/death cross
For more detailed analysis,
- On InfoWARE Market Data Terminal <CI> <GO>
- On InfoWARE Finance Mobile App ( Android , iPhone & iPad and Windows 10) , "Research"
Unusual Volume: Volume traded is more than double the 90 day moving average (All exchanges; ASI & ASem). For more detailed analysis,
- On InfoWARE Market Data Terminal <UV> <GO>
- On InfoWARE Finance Mobile App ( Android , iPhone & iPad and Windows 10)
| Symbol | Name | Volume | 90DAvgVol | %VolChg | Price | LClose | %Chg | Trades | Value |
|---|---|---|---|---|---|---|---|---|---|
| LASACO | LASACO ASSURANCE PLC. | 107.22M | 6.85M | 1,465.68 | 4.55 | 4.14 | 9.90 | 568 | 439.21M |
| JAPAULGOLD | JAPAUL GOLD & VENTURES PLC | 106.90M | 37.19M | 187.43 | 2.94 | 2.69 | 9.29 | 710 | 302.66M |
| STERLINGNG | STERLING FINANCIAL HOLDINGS COMPANY PLC | 97.83M | 18.73M | 422.46 | 8.09 | 8.25 | -1.94 | 632 | 784.45M |
| AIICO | AIICO INSURANCE PLC. | 64.99M | 28.22M | 130.30 | 4.23 | 3.85 | 9.87 | 401 | 273.37M |
| ROYALEX | ROYAL EXCHANGE PLC. | 44.20M | 17.37M | 154.44 | 2.88 | 2.62 | 9.92 | 209 | 127.20M |
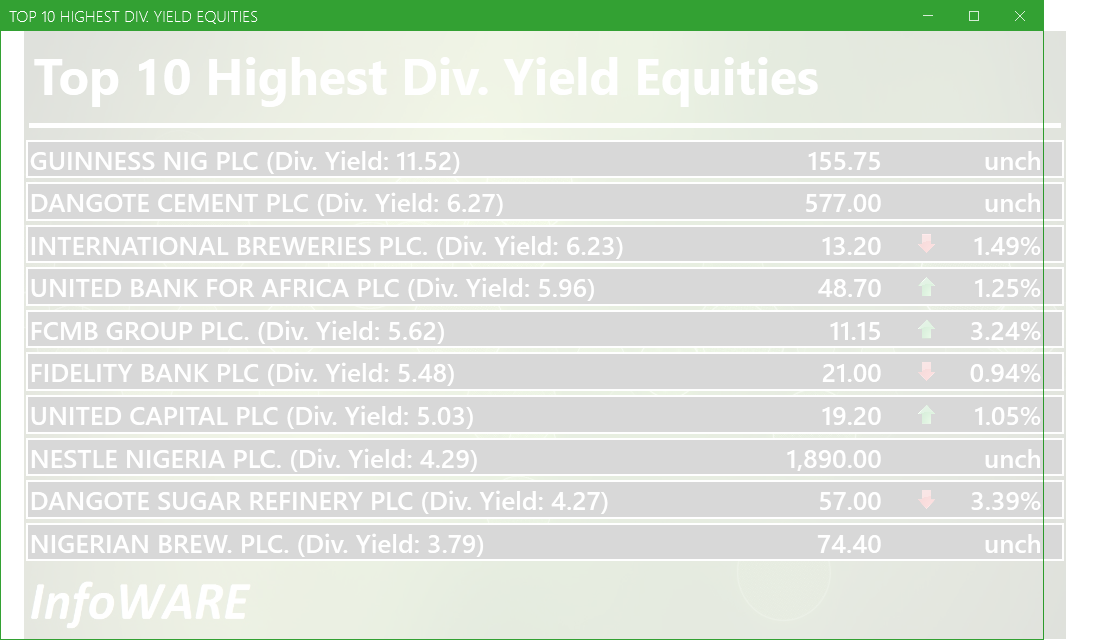
Investment Insights - High Div. Stocks
Dividend stocks distribute a portion of the company earnings to investors on a regular basis and they can a great choice for investors looking for regular income. As an investment or trading strategy, high dividend yield equities provide annual cash payments as against mostly capital gains in the price of a stock. The list in the table below represent the highest dividend paying stocks from the list of the most liquid stocks in the NSE top 30.
For more detailed analysis,
- On InfoWARE Market Data Terminal <HYIELD> <GO>
- On InfoWARE Finance Mobile App ( Android , iPhone & iPad and Windows 10) , "Research"
African Markets
| Name | LClose | Change | %Chg |
|---|---|---|---|
| BRVM Stock Exchange | 311.77 | 0.06 | 0.02 |
| Botswana Stock Exchange | 10,527.93 | 0.00 | 0.00 |
| Egyptian Exchange | 35,908.50 | -202.22 | -0.56 |
| Ghana Stock Exchange | 7,411.94 | 25.85 | 0.35 |
| Johannesburg Stock Exchange | 100,630.37 | -221.87 | -0.22 |
| Lusaka Stock Exchange | 21,535.21 | 10.76 | 0.05 |
| Casablanca Stock Exchange | 19,843.43 | 23.78 | 0.12 |
| Malawi Stock Exchange | 432,152.86 | 6,638.03 | 1.56 |
| Nigeria Stock Exchange | 145,880.77 | 131.17 | 0.09 |
| Nairobi Securities Exchange | 162.18 | 0.98 | 0.61 |
| Namibian Stock Exchange | 1,768.30 | -1.42 | -0.08 |
| Rwanda Stock Exchange | 150.43 | -0.18 | -0.12 |
| Tunis Stock Exchange | 11,863.37 | -1.19 | -0.01 |
| Uganda Securities Exchange | 1,364.31 | 9.89 | 0.73 |
Nigeria Market Indexes
| Symbol | LClose | %Chg | WTD% | MTD% | QTD% | YTD% | MktCap | Trades |
|---|---|---|---|---|---|---|---|---|
| ASI | 146,055.87 | 0.12 | 0.07 | 3.39 | 21.98 | 41.55 | 29,185 | |
| NGX30 | 5,328.61 | 0.03 | -0.02 | 2.76 | 12.81 | 39.68 | 13,810 | |
| NGXAFRBVI | 3,782.73 | -0.10 | -0.10 | -0.82 | 6.75 | 52.48 | 5,090 | |
| NGXAFRHDYI | 23,558.74 | 1.66 | 1.66 | 1.44 | 12.65 | 38.36 | 5,791 | |
| NGXASEM | 1,400.53 | -9.84 | -9.84 | -3.17 | -12.20 | -11.57 | 6 | |
| NGXBNK | 1,610.42 | -0.22 | -0.22 | -0.52 | 6.60 | 48.10 | 6,341 | |
| NGXCG | 4,264.29 | -0.13 | -0.13 | -0.87 | 24.01 | 50.72 | 14,173 | |
| NGXCNSMRGDS | 3,238.74 | -0.47 | -0.48 | 8.81 | -6.63 | 86.74 | 3,477 | |
| NGXCOMMDTY | 1,070.39 | 0.00 | 0.00 | -2.33 | 2.21 | 7.04 | ||
| NGXGROWTH | 10,773.12 | 6.65 | 6.65 | -2.66 | 13.29 | 38.78 | 351 | |
| NGXINDUSTR | 5,463.16 | 0.87 | 0.87 | 8.06 | 55.08 | 52.96 | 2,377 | |
| NGXINS | 1,497.50 | 9.12 | 9.12 | 68.84 | 102.75 | 90.48 | 3,329 | |
| NGXLOTUSISLM | 11,977.41 | 0.73 | 0.33 | 3.02 | 25.10 | 71.90 | 4,761 | |
| NGXMAINBOARD | 6,981.32 | -0.08 | -0.15 | 5.15 | 18.35 | 39.52 | 22,594 | |
| NGXMERIGRW | 10,258.64 | -0.42 | -0.42 | -0.49 | 6.28 | 57.26 | 4,730 | |
| NGXMERIVAL | 14,185.09 | -0.04 | -0.05 | -2.35 | 18.73 | 36.00 | 7,428 | |
| NGXOILGAS | 2,422.59 | -0.19 | -0.19 | -0.58 | 1.27 | -10.64 | 410 | |
| NGXPENBRD | 2,700.04 | 0.12 | 0.12 | 3.60 | 17.43 | 47.41 | 22,856 | |
| NGXPENSION | 6,908.95 | 0.11 | 0.11 | -0.08 | 8.72 | 52.38 | 16,258 | |
| NGXPREMIUM | 14,798.66 | 0.44 | 0.44 | 0.22 | 29.02 | 52.05 | 6,240 | |
| NGXSOVBND | 673.03 | 0.00 | 0.00 | 0.02 | 2.99 | 11.88 | 0 |
For more detailed analysis,
- On InfoWARE Market Data Terminal <MKTINS> <GO>
- On InfoWARE Finance Mobile App ( Android, iPhone & iPad and Windows 10) , "Market Indexes"
Find the topic interesting? Will like to comment? Contact Us at solutions@infowarelimited.com
Top News

Chart Of The Day - ASI Chart Vs ASI Advance Decline Line (YTD) (12-Aug-2025 15:06:59.143)
InfoWARE AI Analyst Daily Market Report: 12-Aug-2025

[OANDO]>>Corporate Disclosures-<OANDO PLC>
[OANDO]>>Corporate Disclosures-<OANDO PLC>
[XNSA]>> CORDROS MILESTONE FUNDS' BID & OFFER PRICES
[VETINDETF]>> DAILY INDICATIVE PRICES
[XNSA]>> CIS ACADEMY TRAINING
[XNSA]>> DAILY FUND PRICE SUBMISSION - FCMB ASSET MANAGEMENT LIMITED
[XNSA]>> NGX NON-INTEREST FINANCE BOARD LAUNCH COMMUNIQUE
[XNSA]>> SAVE THE DATE: 29TH ANNUAL STOCKBROKERS CONFERENCE
[XNSA]>> CHAMS HOLDING COMPANY PLC: ACTIVATION OF CODE FOR TRADING IN RIGHTS
[XNSA]>> NOTIFICATION OF PRICE ADJUSTMENT
Chart Of The Day - ASI Chart Vs ASI Advance Decline Line (YTD) (11-Aug-2025 15:10:12.070)
InfoWARE AI Analyst Daily Market Report: 11-Aug-2025
[XNSA]>> CORDROS MILESTONE FUNDS' BID & OFFER PRICES
[VETBANK]>> DAILY INDICATIVE PRICES
[XNSA]>> CIS ACADEMY TRAINING
[XNSA]>> EMERGING AFRICA DAILY FUND PRICES
[XNSA]>> NGX NON-INTEREST FINANCE BOARD LAUNCH COMMUNIQUE
[XNSA]>> SAVE THE DATE: 29TH ANNUAL STOCKBROKERS CONFERENCE
[SIAMLETF40]>> DAILY INDICATIVE PRICES
[XNSA]>> NOTIFICATION OF PRICE ADJUSTMENT
InfoWARE AI Analyst Weekly Market Report: 08-Aug-2025
Chart Of The Day - ASI Chart Vs ASI Advance Decline Line (YTD) (08-Aug-2025 15:07:22.279)
InfoWARE AI Analyst Daily Market Report: 08-Aug-2025
[MBENEFIT]>>Corporate Disclosures-<MUTUAL BENEFITS ASSURANCE PLC.>
[XNSA]>> NORRENBERGER MUTUAL FUNDS WEEKLY UPDATE
[XNSA]>> EMERGING AFRICA DAILY FUND PRICES
[STANBIC]>>Corporate Disclosures-<STANBIC IBTC HOLDINGS PLC>
[XNSA]>> CIS ACADEMY TRAINING
Get IDIA - the stock trading app for the modern investor
Solutions by Business
Product Suites
Company
Contacts
- 8th Floor,
- South Atlantic Petroleum Towers,
- 1 Adeola Odeku Street,
- Victoria Island,
- Lagos, Nigeria.
- Email: solutions@infowarelimited.com
Follow Us
 |
 |
 |
 |