


InfoWARE AI Analyst Daily Market Report: 28-Aug-2025 | InfoWARE Finance
Get IDIA - the stock trading app for the modern investor


InfoWARE AI Analyst Daily Market Report: 28-Aug-2025
(Source: InfoWARE Terminal, Date: 28-Aug-2025)
Dear Investor,
NGX Daily Market Wrap – Thursday, August 28, 2025
The All Share Index (ASI) retreated by -0.49% today, closing at 141,248.76. Despite this pullback, year-to-date returns remain robust at 36.23%. Market breadth was notably weak at 0.48x, with only 22 advancers versus 46 decliners, signaling broad-based pressure across the board. Nonetheless, turnover surged by 37.80% to 23.05B naira, and trading volume leapt to 820.02M shares, a sign of heightened participation (albeit with more selling than buying). SCOA Nigeria (+10%) led the gainers with an extreme RSI, while VETINDETF and VSPBONDETF topped the losers, each shedding -10% or more. Several big names (notably CHAMPION and GTCO) printed huge, unusual volumes, hinting at institutional action and possible positioning for trend turns.
Key Market Trends
- Market Breadth: Weak, at only 0.48x (22 up, 46 down), flashing pervasive caution. Deteriorating breadth often precedes further index pressure.
- Turnover spike: +37.80% vs previous session, with institutional investors driving over 93.6% of traded value — suggesting informed hands are active.
- Volume up: 820M shares (+32% vs previous), yet the advance-to-decline ratio is skewed negative — classic "distribution day” pattern.
Day’s Top Gainers & Losers
| Stock | Change (%) | RSI | Notes |
|---|---|---|---|
| SCOA | +10.00 | 87.2 | Extreme overbought, YTD +193.7%, could be peaking; bullish MACD but caution warranted. |
| VETINDETF | -10.00 | 35.3 | Big drop despite moderate RSI, possible short-term oversold soon. |
| RTBRISCOE | +9.8 | 38.4 | Low RSI, approached from deeply oversold; keep an eye for momentum reversal. |
| VSPBONDETF | -14.8 | 47.3 | Huge drop, high volatility, falling below 50d/15d averages. |
| CHAMPION | -4.42 | 54.4 | Unusual Volume (2015% of average!); negative price, but MACD flipping bullish. Contrarian setup. |
YTD Top 5 Gainers:
| Name | Symbol | Price | %ChgYTD | RSI | MACD | Div Yield |
|---|---|---|---|---|---|---|
| BETAGLAS | BETAGLAS | 486.00 | 648.84 | 99.2 | 29.2 | 2.42 |
| MCNICHOLS | MCNICHOLS | 3.55 | 136.02 | 53.2 | 0.05 | 5.88 |
| NEM | NEM | 28.90 | 160.00 | 54.3 | 1.3 | 6.52 |
| SCOA | SCOA | 5.50 | 193.69 | 87.2 | 0.11 | 3.40 |
| NCR | NCR | 11.55 | 110.00 | 99.1 | 1.08 | 61.22 |
YTD Top 5 Losers:
| Name | Symbol | Price | %ChgYTD | RSI | MACD | Div Yield |
|---|---|---|---|---|---|---|
| SIAMLETF40 | SIAMLETF40 | 586.09 | -26.73 | 65.2 | 63.4 | 0.00 |
| LEGEND INTERNET PLC | LEGENDINT | 5.65 | -12.90 | 45.2 | -0.24 | 0.00 |
| OMATEK | OMATEK | 1.45 | -65.00 | 55.5 | 0.07 | 0.00 |
| GUINEAINS | GUINEAINS | 1.61 | -73.03 | 61.8 | 0.18 | 1.96 |
| INTENEGINS | INTENEGINS | 3.64 | -75.94 | 61.9 | 0.34 | 3.40 |
Momentum & Unusual Patterns
- Unusual Volume:
- CHAMPION: Volume up 2015%! Yet price fell -4.4%. RSI 54 and bullish MACD, textbook contrarian setup; aggressive traders could watch for reversal signals.
- GTCO: Volume up 311%, price -3.1%. Heavy institutional trading, possible accumulation under pressure.
- STERLINGNG: Vol +278%. Neutral price. Watch for future breakout or shakeout.
- Bullish momentum (crossed above 15DMA):
- NEM (RSI 54.3, up +7.4%, strong YTD and solid 6.5% Div Yield) – insurance sector leadership proves defensive character.
- NEWGOLD ETF: mild gain, studiously held above average despite broader volatility—possible inflation/protection play.
- UNIVINSURE: modest volume, 15DMA cross.
- Bearish momentum (crossed below 15DMA):
- OMATEK and INTENEGINS: in both YTD loser and bearish tables—serial weakness cannot be ignored.
- CHAMPION, MBENEFIT, DANGSUGAR: slumping despite recent runs, all with key breakdowns. MBENEFIT notably also has a healthy Div Yield (3.28%).
- CADBURY: Defensive sector but breaking short term support, see if big buyers step in.
- High RSI Extremes: Several YTD gainers (e.g., BETAGLAS: RSI 99.2!) are technically overbought, and could see short-term mean reversion.
Contrarian Signals
-
CHAMPION:
- RSI: 54.4 (neutral)
- Bullish MACD vs Bearish price action (-4.4% down), with enormous unusual volume.
- Signal: If institutional accumulation is behind the volume, bounce could be imminent. However, sharp price drop warns of potential liquidation.
- SCOA: RSI at extreme 87.2 but still gaining—mean reversion risk high; consider profit lock-in.
- GTCO: Massive sell volume yet price didn’t collapse; suggests "strong hands” may be absorbing float.
- OMATEK/INTENEGINS: Appear across YTD losers, daily losers, bearish crosses—downside exhaustion or pump/dump? Value only for highly tactical traders.
Sector Heatmap & Technical Matrix
| Sector | Leaders | Laggards | Key Technical Trend |
|---|---|---|---|
| Insurance | NEM (+7.4%), UNIVINSURE (+3.9%) | MBENEFIT (-4.1%), GUINEAINS (-4.6%), INTENEGINS (-10.6%) | MOMENTUM DIVERGENCE: Some names crossing up (NEM), others sharply down. |
| Banking | In line with index | GTCO (-3.1%, high volume), ACCESSCORP, ZENITHBANK, UBA (all modest losses) | All heavily traded, but negative closes amid institutional absorption; sign of rotation or accumulation? |
| Consumer - Food/Beverages | SCOA (+10%) | CHAMPION (-4.4%), DANGSUGAR (-5.9%) | High volatility; some overbought (SCOA), others breaking trend support (DANGSUGAR, CHAMPION). |
| Financial (ETF/Asset Mgmt) | NEWGOLD (+6.8%) | VETINDETF (-10%), VSPBONDETF (-14.8%) | Flight to inflation hedges? Broad ETF pain elsewhere. |
Dividend-Beta Matrix: Defensive Plays
| Stock | Dividend Yield | Beta | Momentum | Comment |
|---|---|---|---|---|
| NEM | 6.52% | 0.69 | Bullish | Defensive, outperforming both in price and yield. |
| MBENEFIT | 3.28% | 1.27 | Bearish | High yield, but high Beta and on breakdown watchout. |
| GUINEAINS | 1.96% | 1.51 | Bearish | Very high Beta; downside candidate despite yield, best avoided by risk-averse. |
| AIICO | 4.13% | 1.33 | Bearish | Yield, but trending down—only for bargain hunters. |
| FTNCOCOA | 1.60% | 0.79 | Bearish | Low Beta with yield, bearish momentum—do not add. |
Institutional Clustering Alerts
- ACCESSCORP: 11% of institutional trade volume; active sector repositioning (probable component in rotation basket).
- GTCO: 31% of institutional volume, highest absolute value traded. Despite downtick in price, likely accumulation from large funds.
- ZENITHBANK: 20.17% institutional trade share (previous data), again a sign that top financial names are being actively repositioned.
Trader Suggestions:
- For momentum traders:
- Look at NEM and NEWGOLD for further upside, but with tight trailing stops.
- Avoid names with extreme overbought RSI unless executing tactical reversal shorts (e.g., SCOA, BETAGLAS).
- Contrarian setups:
- CHAMPION: Monitor closely — if price stabilizes, could be a strong bounce-back on high volume.
- Bargain hunters can watch GUINEAINS, MBENEFIT, and OMATEK for exhaustion signals, but these are high risk, "falling knife” plays.
- Defensive & Yield Focus:
- Insurance leaders like NEM combine positive yield and low Beta — a haven if recent market volatility intensifies.
- Be wary of stocks that are both high yield/high Beta and in negative technical momentum (MBENEFIT, GUINEAINS); possible dividend "traps”.
- Broad base institutional activity in banks is a double-edged sword – could support prices, but if flows dry up, expect sharp coups.
Retail vs Institutional Activity – Insights
| Investor Type | Trade Count | Volume | Traded Value |
|---|---|---|---|
| Institutional | 1,781 | 727.60M (82.18%) | ₦26.47B (93.63%) |
| Retail | 24,442 | 157.73M (17.82%) | ₦1.80B (6.37%) |
- Pattern: Institutional investors are commanding the market with 82% of volume but only 38% of the trade count. Larger-sized block trades are crowding out typical retail activity despite the higher number of retail trades.
- Top Institutional Trades: ACCESSCORP, GTCO, FIRSTHOLDCO, ARADEL, UBA — these blue-chip names are drawing heavy block trading, likely for quarter-end portfolio rebalancing or index tracking purposes.
- Retail Most Active:
- Retail is also most active in GTCO, followed by ACCESSCORP, MTNN, UBA, ZENITHBANK.
- Aside from MTNN, retail behavior mirrors institutional picks, which often signals a "herd” effect in blue chips but thin conviction in second/third-tier names.
- Correlation: All most-traded institutional/retail names are also those with highest unusual volumes — a potential sign of systemic positioning, not one-off events.
- Traders’ Edge: When both sectors pour into the same names and technicals are mixed (like GTCO, CHAMPION), the next move (breakout or breakdown) can be powerful and quick. Watch for further institutional follow-through, especially in Banking and Large Cap stocks.
Summary & Takeaways
- The NGX ASI broke lower on broad-based weakness despite a turnover jump, hinting that larger players are active but perhaps rotating within sectors.
- Momentum is fracturing: a handful of big gainers with overbought signals (SCOA, BETAGLAS), plenty of laggards breaking through technical floors.
- Unusual volumes (CHAMPION, GTCO) could presage big moves; price bottoms here often see fast rebounds or further flushes.
- The insurance sector features both defensive winners (NEM) and cautionary tales (GUINEAINS, MBENEFIT) — critical to separate signal from noise within sub-sectors.
- Yield + Low Beta stocks (NEM) stand out as defensive plays in choppy tapes; beware "yield traps” where downside persists despite dividends.
- Retail and institutional trading patterns are overlapping — in the past, this unity has either been "the last hurrah” before a reversal or prelude to a major breakout following weakness. Traders should act decisively on breakout confirmations and stay nimble.
Final Word: Stay alert for reversals in stocks with conflicting signals and elevated volumes. Defensive sector names with supportive technicals and yield (e.g. NEM) merit attention, but don’t chase overbought rallies. Risk management is key as smart money appears to be actively repositioning in core blue chips.
|
Top ASI Gainers Over Last 5 Trading Days
|
Top ASI Losers Over Last 5 Trading Days
|
For more detailed analysis, on InfoWARE Market Data Terminal <NSEPERF> <GO>
On InfoWARE Finance Mobile App (Android, iPhone & iPad, Windows Phone and Windows 8/10), "Top Gainers & Losers"
S C O A NIG. PLC. (SCOA) topped the advancers list closing at N6.05 with a gain of 10.00% followed by VETIVA INDUSTRIAL ETF (VETINDETF) which closed at N49.50 with a gain of 10.00%.
On the flip side VETIVA S & P NIGERIA SOVEREIGN BOND ETF (VSPBONDETF) and LOTUS HALAL EQUITY ETF (LOTUSHAL15) topped the decliners log with a loss of -14.82% at a close of N211.08, and -9.97% to close the day at N69.71 respectively.
| Symbol | LClose | %Chg |
|---|---|---|
| SCOA | 6.05 | 10.00 |
| VETINDETF | 49.50 | 10.00 |
| RTBRISCOE | 3.36 | 9.80 |
| NEM | 31.20 | 7.96 |
| NGXGROUP | 57.80 | 7.94 |
| Symbol | LClose | %Chg |
|---|---|---|
| VSPBONDETF | 211.08 | -14.82 |
| LOTUSHAL15 | 69.71 | -9.97 |
| GREENWETF | 284.50 | -9.94 |
| INTENEGINS | 3.29 | -9.62 |
| OMATEK | 1.32 | -8.97 |
For more detailed analysis,
- On InfoWARE Market Data Terminal <TOPG> <GO>
- On InfoWARE Finance Mobile App ( Android, iPhone & iPad and Windows 10) , "Top Gainers & Losers"
Currency Market
In the currency market, the Naira fell 0.01%(-0.15) against the Dollar to settle at 1 to 1NSE: Bull Signal - Price crossed above 15 Day MA
This signal implies these stocks are under buying pressure and the price might continue to rise and therefore positions should be monitored closely. Further suggested analysis include looking at the overall market (ASI) to see if the uptrend is market wide, sector wide or specific to the stock. Portfolio managers tend to use this as a signal to do more research to add to their positions or lock in some profits. Typically further analysis should be done using commands like PC and RV on the InfoWARE Market Data Terminal. Another command is ALERTS to set price triggers for possible exit or entry as necessary
For more detailed analysis,
- On InfoWARE Market Data Terminal <NSEPERF> <GO>
- On InfoWARE Finance Mobile App ( Android , iPhone & iPad and Windows 10) , "Top Gainers & Losers"
| Symbol | Price | %Chg | 15DMA | PE | EPS | DivY | MktCap | Vol | Trades | Value | LstTradeTime |
|---|---|---|---|---|---|---|---|---|---|---|---|
| NEM | 31.20 | 7.37 | 31.19 | 24.99 | 0.37 | 6.52 | 156.51B | 1.74M | 85.00 | 50.58M | 28-Aug-2025 14:30:12.420 |
| NEWGOLD | 55,000.00 | 6.36 | 54,053.47 | 0.00 | 0.00 | 0.00 | 0.00 | 1.00 | 1.00 | 55.00K | 28-Aug-2025 14:30:32.287 |
| UNIVINSURE | 1.28 | 3.91 | 1.26 | 0.00 | 0.00 | 0.00 | 20.48B | 10.38M | 195.00 | 13.17M | 28-Aug-2025 14:30:13.320 |
NSE: BEAR Signal - Price crossed below 15 Day MA
This signal implies these stocks are under selling pressure and the price might continue to slide and therefore positions should be monitored closely. Further suggested analysis include looking at the overall market (ASI) to see if the downtrend is market wide, sector wide or specific to the stock. If the overal market trend is upwards, then since these stocks are heading in the opposite direction, then further analysis should be done using commands like PC and RV on the InfoWARE Market Data Terminal. Another command is ALERTS to set price triggers for possible exit is necessar
For more detailed analysis,
- On InfoWARE Market Data Terminal <BEARM> <GO>
- On InfoWARE Finance Mobile App ( Android , iPhone & iPad and Windows 10)
| Symbol | Price | %Chg | 15DMA | PE | EPS | DivY | MktCap | Vol | Trades | Value | LstTradeTime |
|---|---|---|---|---|---|---|---|---|---|---|---|
| FTNCOCOA | 6.50 | 0.00 | 6.51 | 0.00 | 0.00 | 1.60 | 25.35B | 1.83M | 167.00 | 11.85M | 28-Aug-2025 14:30:11.610 |
| MANSARD | 16.50 | -1.21 | 16.87 | 31.16 | 0.24 | 4.59 | 148.50B | 1.09M | 145.00 | 18.29M | 28-Aug-2025 14:30:12.120 |
| NGXAFRHDYI | 22,818.24 | -1.35 | 23,102.09 | 7.46 | 39.30 | 0.00 | 0.00 | 163.19M | 6,132.00 | 10.82B | 28-Aug-2025 14:30:19.773 |
| AIICO | 4.11 | -1.70 | 4.13 | 2.01 | 0.60 | 4.13 | 150.45B | 8.47M | 513.00 | 35.38M | 28-Aug-2025 14:30:10.697 |
| MBENEFIT | 3.90 | -4.10 | 3.92 | 5.43 | 0.11 | 3.28 | 78.24B | 11.12M | 314.00 | 44.00M | 28-Aug-2025 14:30:31.993 |
| CADBURY | 60.00 | -4.17 | 62.13 | 33.25 | 0.64 | 1.88 | 112.69B | 1.42M | 188.00 | 85.11M | 28-Aug-2025 14:30:10.957 |
| GUINEAINS | 1.54 | -4.55 | 1.59 | 66.79 | 0.01 | 1.96 | 9.46B | 2.02M | 100.00 | 3.25M | 28-Aug-2025 14:30:11.720 |
| CHAMPION | 17.30 | -4.62 | 17.55 | 412.83 | 0.01 | 0.41 | 135.45B | 201.05M | 160.00 | 3.47B | 28-Aug-2025 14:30:11.023 |
| DANGSUGAR | 58.00 | -5.86 | 58.87 | 11.48 | 3.06 | 4.27 | 704.52B | 1.65M | 568.00 | 95.95M | 28-Aug-2025 14:30:11.270 |
| OMATEK | 1.32 | -9.85 | 1.42 | 6.82 | 0.10 | 0.00 | 3.88B | 1.53M | 110.00 | 2.11M | 28-Aug-2025 14:30:12.570 |
| INTENEGINS | 3.29 | -10.64 | 3.55 | 0.52 | 2.85 | 3.40 | 4.22B | 2.60M | 73.00 | 8.63M | 28-Aug-2025 14:30:11.897 |
| VSPBONDETF | 211.08 | -17.40 | 223.81 | 0.00 | 0.00 | 11.90K | 7.00 | 2.54M | 28-Aug-2025 14:30:32.347 |
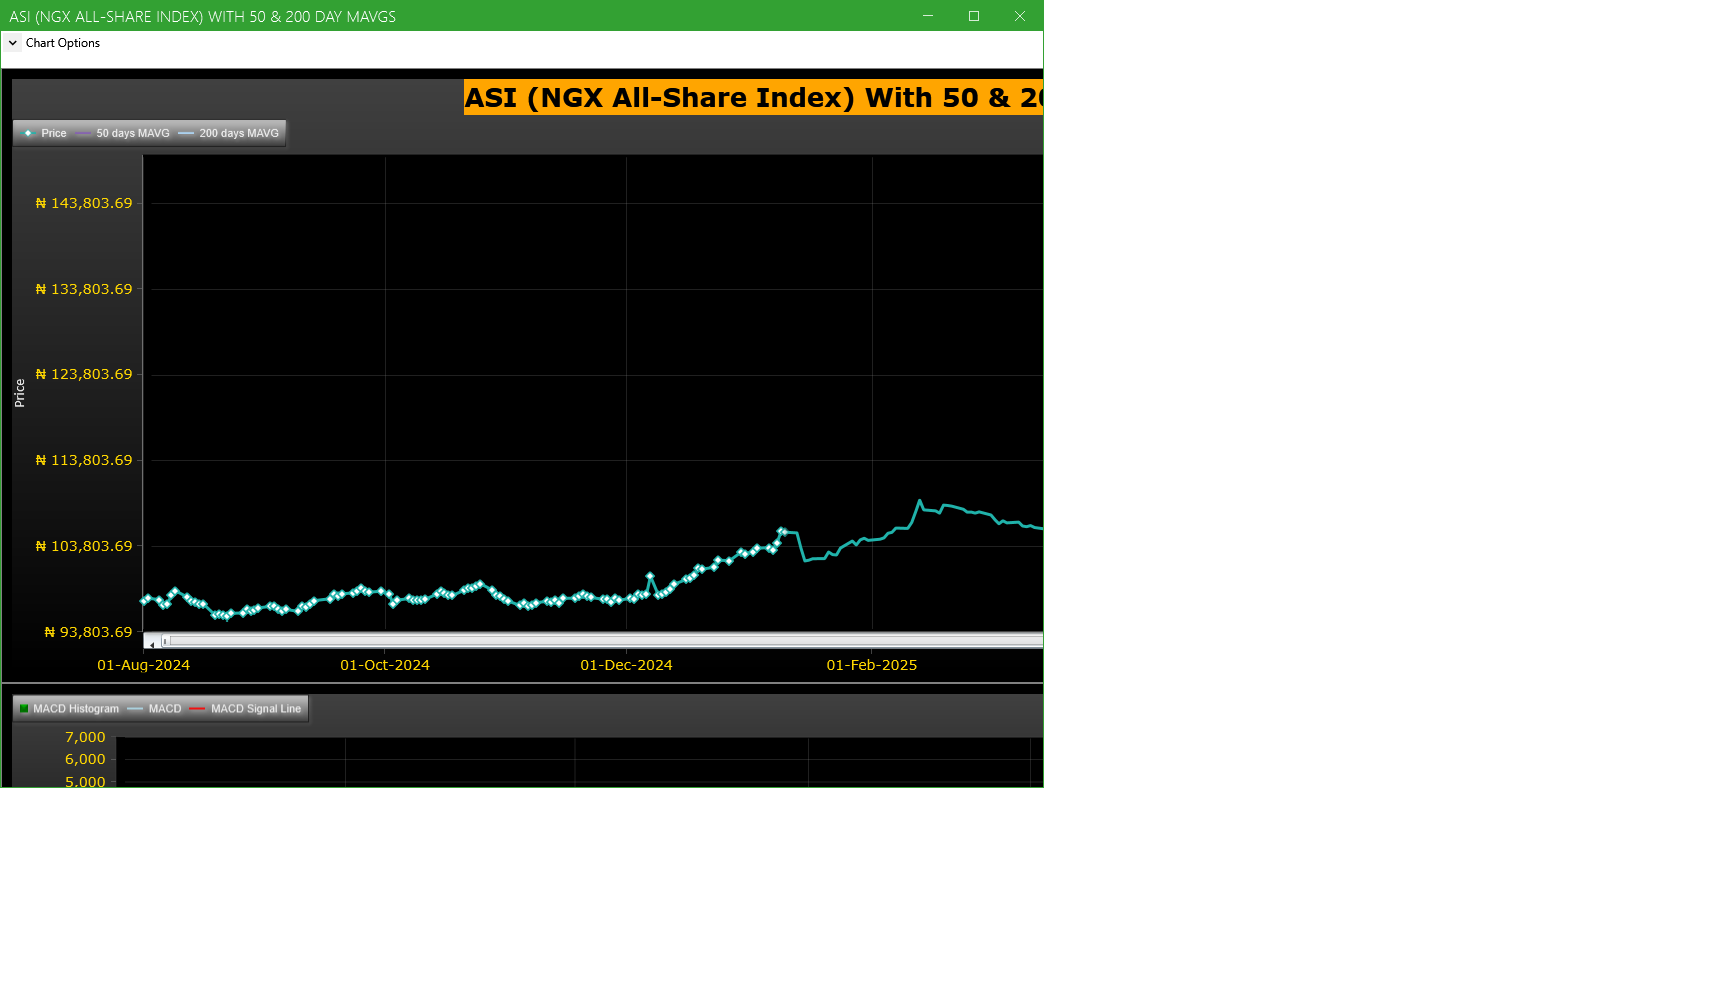
Market Trend - ASI (NGX All-Share-Index) With 50 & 200 Day MAvgs Chart
Technical traders typically use the 50 & 200 day moving averages to aid in choosing
where to enter or exit a position, which then causes these levels to act as strong
support or resistance. As a general guideline, if the price is above a moving average,
the trend is up. If the price is below a moving average, the trend is down.
It is important to note that critics of technical analysis say that moving averages act
as support and resistance because so many traders use these indicators to inform their
trading decisions. Also moving averages tend to work quite well in strong trending conditions
but poorly in choppy or ranging conditions.
Trading Strategies: Crossovers
Crossovers are one of the main moving average strategies. The first type is a price crossover,
which is when the price crosses above or below a moving average to signal a potential change
in trend. Another strategy is to apply two moving averages to a chart: one longer and one
shorter. When the shorter-term MA crosses above the longer-term MA, it is a buy signal, as
it indicates that the trend is shifting up. This is known as a golden cross. Meanwhile, when
the shorter-term MA crosses below the longer-term MA, it is a sell signal, as it indicates that
the trend is shifting down. This is known as a dead/death cross
For more detailed analysis,
- On InfoWARE Market Data Terminal <CI> <GO>
- On InfoWARE Finance Mobile App ( Android , iPhone & iPad and Windows 10) , "Research"
Unusual Volume: Volume traded is more than double the 90 day moving average (All exchanges; ASI & ASem). For more detailed analysis,
- On InfoWARE Market Data Terminal <UV> <GO>
- On InfoWARE Finance Mobile App ( Android , iPhone & iPad and Windows 10)
| Symbol | Name | Volume | 90DAvgVol | %VolChg | Price | LClose | %Chg | Trades | Value |
|---|---|---|---|---|---|---|---|---|---|
| CHAMPION | CHAMPION BREW. PLC. | 201.05M | 9.50M | 2,015.43 | 17.30 | 18.10 | -4.42 | 160 | 3.47B |
| GTCO | GUARANTY TRUST HOLDING COMPANY PLC | 96.45M | 23.44M | 311.50 | 92.05 | 95.00 | -3.11 | 1,478 | 8.89B |
| STERLINGNG | STERLING FINANCIAL HOLDINGS COMPANY PLC | 90.82M | 24.00M | 278.46 | 8.00 | 8.00 | 0.00 | 367 | 726.59M |
| FIRSTHOLDCO | FIRST HOLDCO PLC | 46.26M | 15.75M | 193.65 | 32.55 | 32.50 | 0.15 | 479 | 1.50B |
| DEAPCAP | DEAP CAPITAL MANAGEMENT & TRUST PLC | 9.52M | 4.58M | 107.66 | 1.81 | 1.74 | 4.02 | 194 | 17.64M |
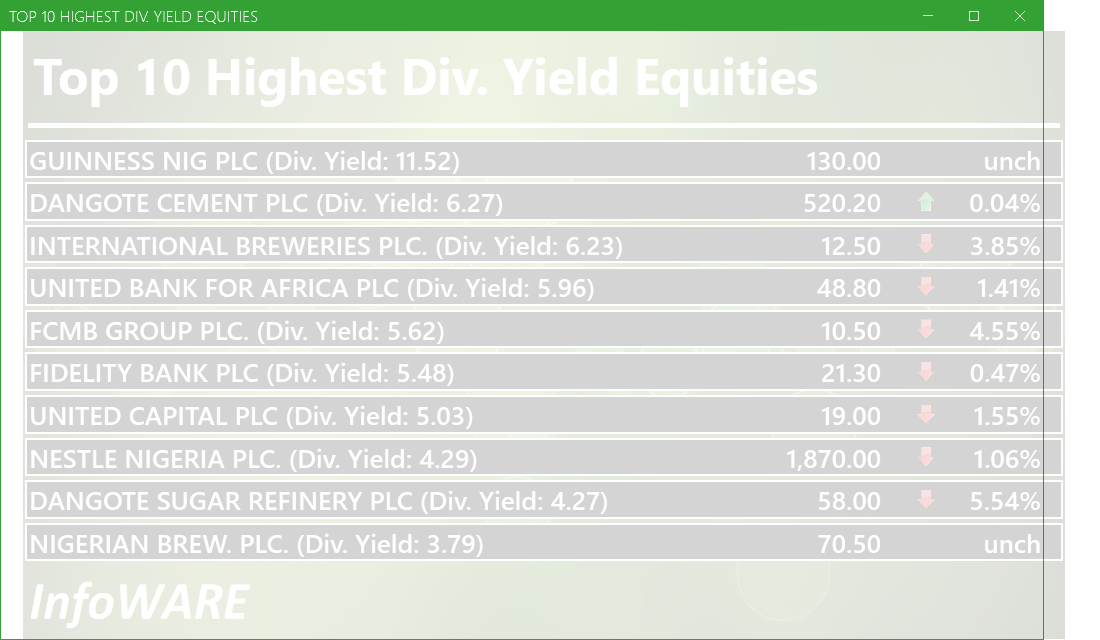
Investment Insights - High Div. Stocks
Dividend stocks distribute a portion of the company earnings to investors on a regular basis and they can a great choice for investors looking for regular income. As an investment or trading strategy, high dividend yield equities provide annual cash payments as against mostly capital gains in the price of a stock. The list in the table below represent the highest dividend paying stocks from the list of the most liquid stocks in the NSE top 30.
For more detailed analysis,
- On InfoWARE Market Data Terminal <HYIELD> <GO>
- On InfoWARE Finance Mobile App ( Android , iPhone & iPad and Windows 10) , "Research"
African Markets
| Name | LClose | Change | %Chg |
|---|---|---|---|
| BRVM Stock Exchange | 318.59 | -2.31 | -0.72 |
| Botswana Stock Exchange | 10,560.08 | 0.00 | 0.00 |
| Egyptian Exchange | 35,676.19 | 318.22 | 0.90 |
| Ghana Stock Exchange | 7,339.02 | 2.93 | 0.04 |
| Lusaka Stock Exchange | 23,630.27 | 547.07 | 2.37 |
| Casablanca Stock Exchange | 20,233.50 | 168.55 | 0.84 |
| Malawi Stock Exchange | 528,895.50 | 9,504.85 | 1.83 |
| Nigeria Stock Exchange | 141,248.76 | -510.33 | -0.36 |
| Nairobi Securities Exchange | 171.57 | -0.78 | -0.45 |
| Rwanda Stock Exchange | 178.88 | 0.00 | 0.00 |
| Uganda Securities Exchange | 1,450.30 | 18.33 | 1.28 |
Nigeria Market Indexes
| Symbol | LClose | %Chg | WTD% | MTD% | QTD% | YTD% | MktCap | Trades |
|---|---|---|---|---|---|---|---|---|
| ASI | 140,557.24 | -0.49 | -0.62 | -0.50 | 17.38 | 36.23 | 24,424 | |
| NGX30 | 5,126.80 | -0.50 | -0.51 | -1.13 | 8.53 | 34.39 | 12,934 | |
| NGXAFRBVI | 3,591.38 | -1.67 | -1.48 | -5.84 | 1.35 | 44.77 | 5,555 | |
| NGXAFRHDYI | 22,818.24 | -1.34 | -0.83 | -1.75 | 9.11 | 34.01 | 6,132 | |
| NGXASEM | 1,538.10 | 0.00 | 0.00 | 6.34 | -3.57 | -2.88 | 4 | |
| NGXBNK | 1,542.19 | -1.41 | -1.44 | -4.74 | 2.08 | 41.82 | 5,785 | |
| NGXCG | 4,097.70 | -1.03 | -0.83 | -4.74 | 19.16 | 44.83 | 12,500 | |
| NGXCNSMRGDS | 3,186.06 | -0.92 | -1.31 | 7.04 | -8.15 | 83.70 | 2,882 | |
| NGXCOMMDTY | 1,066.84 | 0.00 | 0.00 | -2.65 | 1.87 | 6.68 | ||
| NGXGROWTH | 11,200.10 | 0.24 | 0.28 | 1.20 | 17.78 | 44.28 | 223 | |
| NGXINDUSTR | 4,975.04 | -0.45 | -0.37 | -1.60 | 41.22 | 39.29 | 2,212 | |
| NGXINS | 1,303.61 | 0.44 | -3.17 | 46.98 | 76.50 | 65.81 | 2,546 | |
| NGXLOTUSISLM | 11,477.94 | -0.35 | -0.60 | -1.27 | 19.88 | 64.73 | 4,088 | |
| NGXMAINBOARD | 6,800.49 | -0.53 | -0.78 | 2.43 | 15.28 | 35.90 | 17,934 | |
| NGXMERIGRW | 9,908.23 | -1.85 | -2.05 | -3.89 | 2.65 | 51.89 | 3,108 | |
| NGXMERIVAL | 13,808.42 | -1.10 | -0.83 | -4.94 | 15.57 | 32.39 | 6,657 | |
| NGXOILGAS | 2,393.58 | -0.02 | 0.64 | -1.77 | 0.06 | -11.71 | 468 | |
| NGXPENBRD | 2,605.02 | -0.42 | -0.49 | -0.05 | 13.29 | 42.22 | 19,612 | |
| NGXPENSION | 6,693.67 | -0.74 | -0.73 | -3.19 | 5.34 | 47.63 | 14,477 | |
| NGXPREMIUM | 13,951.40 | -0.44 | -0.32 | -5.52 | 21.63 | 43.34 | 6,267 | |
| NGXSOVBND | 658.87 | 0.00 | -0.10 | -2.08 | 0.82 | 9.53 | 0 |
For more detailed analysis,
- On InfoWARE Market Data Terminal <MKTINS> <GO>
- On InfoWARE Finance Mobile App ( Android, iPhone & iPad and Windows 10) , "Market Indexes"
Find the topic interesting? Will like to comment? Contact Us at solutions@infowarelimited.com
Top News

Chart Of The Day - ASI Chart Vs ASI Advance Decline Line (YTD) (28-Aug-2025 15:07:47.937)
InfoWARE AI Analyst Daily Market Report: 28-Aug-2025

[XNSA]>> CORDROS MILESTONE FUNDS' BID & OFFER PRICES
[MERGROWTH]>> DAILY INDICATIVE PRICES
[XNSA]>> DAILY FUND PRICE SUBMISSION - FCMB ASSET MANAGEMENT LIMITED
[VETINDETF]>> DAILY INDICATIVE PRICES
[XNSA]>> NGX FIXED INCOME INDICATIVE PRICE LIST FOR AUG 28, 2025
[XNSA]>> APPOINTMENT OF A DIRECTOR (INVESTMENT ONE STOCKBROKERS INTERNATIONAL LI
[XNSA]>> REGISTRATION FOR BATCH TWO- 2025 DEALING CLERKSHIP CERTIFICATION PROGRA
[XNSA]>> NGX NON-INTEREST FINANCE BOARD LAUNCH COMMUNIQUE
[SIAMLETF40]>> DAILY INDICATIVE PRICES
[XNSA]>> UPDATED- SAVE THE DATE: 29TH ANNUAL STOCKBROKERS CONFERENCE
Chart Of The Day - ASI Chart Vs ASI Advance Decline Line (YTD) (27-Aug-2025 15:06:59.938)
InfoWARE AI Analyst Daily Market Report: 27-Aug-2025
[XNSA]>> CORDROS MILESTONE FUNDS' BID & OFFER PRICES
[XNSA]>> APPOINTMENT OF A DIRECTOR
[XNSA]>> DAILY FUND PRICE SUBMISSION - FCMB ASSET MANAGEMENT LIMITED
[XNSA]>> EMERGING AFRICA DAILY FUND PRICES
[XNSA]>> NGX FIXED INCOME INDICATIVE PRICE LIST FOR AUG 27, 2025
[VETGOODS]>> DAILY INDICATIVE PRICES
[XNSA]>> REGISTRATION FOR BATCH TWO- 2025 DEALING CLERKSHIP CERTIFICATION PROGRA
[XNSA]>> NGX NON-INTEREST FINANCE BOARD LAUNCH COMMUNIQUE
[XNSA]>> UPDATED- SAVE THE DATE: 29TH ANNUAL STOCKBROKERS CONFERENCE
[XNSA]>> SUPPLEMENTARY LISTING OF FGN BONDS ISSUED IN MAY 2025
[SIAMLETF40]>> DAILY INDICATIVE PRICES
Chart Of The Day - ASI Chart Vs ASI Advance Decline Line (YTD) (26-Aug-2025 15:06:44.871)
InfoWARE AI Analyst Daily Market Report: 26-Aug-2025
[XNSA]>> DAILY FUND PRICE SUBMISSION - FCMB ASSET MANAGEMENT LIMITED
[VSPBONDETF]>> DAILY INDICATIVE PRICES
[XNSA]>> EMERGING AFRICA DAILY FUND PRICES
Get IDIA - the stock trading app for the modern investor
Solutions by Business
Product Suites
Company
Contacts
- 8th Floor,
- South Atlantic Petroleum Towers,
- 1 Adeola Odeku Street,
- Victoria Island,
- Lagos, Nigeria.
- Email: solutions@infowarelimited.com
Follow Us
 |
 |
 |
 |