


InfoWARE AI Analyst Daily Market Report: 26-Aug-2025 | InfoWARE Finance
Get IDIA - the stock trading app for the modern investor


InfoWARE AI Analyst Daily Market Report: 26-Aug-2025
(Source: InfoWARE Terminal, Date: 26-Aug-2025)
Dear Investor,
NGX Daily Market Summary – Tuesday, August 26, 2025
The NGX All Share Index (ASI) ended the day up by 0.23% at 141,439.77, sustaining the strong Year-To-Date (YTD) return of 37.39%. Despite the positive close, market breadth undershot at 0.81x, with more decliners (36) than advancers (29). Trading activity was vibrant: volume increased slightly to 578.08M shares, while turnover surged 26.92% to ₦12.02B, signaling robust institutional participation. Top movers delivered eye-popping single-day moves, and several momentum and volume signals flashed across sectors, giving traders plenty to digest.
Significant Trends in Market Breadth
- Market Breadth: 0.81x (decliners outpaced advancers), which signals underlying weakness beneath the index's slight gain.
- Volume Up: 79 stocks had higher trading volume, with only 62 down, suggesting rotational interest beneath the surface.
- Turnover Surge: Value traded jumped nearly +27%, continuing a recent trend of institutional re-engagement.
Top Gainers & Losers
- Top Gainer: NCR (NIGERIA) PLC (NCR) jumped +10.00% to ₦11.55, with an extremely overbought RSI of 98.7 and positive MACD — clear momentum but ripe for retracement.
-
Other Big Movers:
- BERGER PAINTS PLC (BERGER) +9.06% | Moderate RSI, but price broke above both 15/50DMA (bullish), volume robust.
- BETA GLASS (BETAGLAS) +8.16% | Another parabolic run, RSI near the upper limit.
- CADBURY +8.04% | Healthy uptick; 15DMA crossover points to further possible upside.
- SOVEREIGN TRUST INS. (SOVRENINS) +7.55% | On both Gainers & YTD outperformers lists.
- Top Loser: SFS REIT (SFSREIT) plunged -9.99% (high beta correction).
-
Other Notables:
- VETINDETF -10.00% | Signs of heavy ETF rotation and failing momentum.
- LEGENDINT -10.00%
- VETGRIF30 -9.43%
- NSLTECH -9.26% | Also flashed in "Unusual Volume" table – possible forced selling or block exit.
- CUTIX -8.97% | Bearish momentum confirmed by 15DMA breakdown and negative sentiment.
Key Insights & Predictions
- Turnover Implications: Elevated turnover, up 26.92%, alongside index resilience and negative breadth, hints at large players reshuffling portfolios — potentially buying select large-caps while distributing mid/small-caps.
- Advancers/Decliners: Although the ASI closed green, the higher number of decliners indicates potential near-term pressure unless leadership broadens out.
-
Unusual Volumes:
- AUSTINLAZ: +1294% vs 90D avg – microcap, speculative inflow, but liquidity risk is high.
- VERITASKAP: +177% vs 90D avg | YTD gainer, now with momentum confirmation: strong candidate for trend continuation.
- NSLTECH: +270% vs 90D avg but price -9.26% | High likelihood of a large seller; monitor for reversal or continued dump.
-
Bullish Momentum:
- BERGER, CADBURY, OANDO, FCMB, GTCO, FIDELITYBK, UBA, ACCESSCORP all closed above their 15DMA (bullish crossover), with several also on institutional Top Trades lists — a constructive sign for trend followers.
- NCR & BETAGLAS have extremely high RSI (>98)—suggesting "blow-off” tops; trailing stops recommended.
-
Bearish Momentum:
- CUTIX, NSLTECH, VETGRIF30, LEGENDINT, JAPAULGOLD, ETI closed below 15DMA with prices heavily down, RSI not yet deeply oversold except for select names—bearish moves may persist.
- ETI (EcoBank) is a top YTD decliner, crossed bearish, negative sentiment persists, risk for further downside.
-
Notable Overlaps:
- VERITASKAP: YTD Top Gainer + Unusual Volume + Positive RSI — textbook strong uptrend.
- NSLTECH: In Losers, Unusual Volume, Bearish Momentum — likely to remain under downward pressure.
- BETAGLAS: Present in both Daily and YTD Top Gainers, with an RSI in "extreme” territory — tactical risk of sharp pullback.
- SOVRENINS: On Gainers and YTD Momentum tables.
- CUTIX: Daily Loser, Bearish Momentum.
Contrarian Signals
- BERGER PAINTS: RSI is only moderate (45) despite a +9.06% surge and bullish 15DMA crossover — positive momentum may have more room to run than the chart suggests.
- LEGENDINT: RSI near neutral (48.9), but with sharp losses and a breakdown below 15DMA—watch for bounce, but continue with caution.
- CADBURY: Moderate RSI (39.3, down from 58.6!) even as price crossed above 15DMA, perhaps signaling near-term exhaustion despite upward break.
- GTCO — High price momentum, moderate RSI (stopped short of overbought), institutional flows strong but top Retail activity as well; might see mean reversion.
Sector Heatmap
| Sector | Top Performing Stock | %Chg | Key Technical | Institutional/ Retail Flows |
|---|---|---|---|---|
| Banking | GTCO / UBA / ACCESSCORP | +1.99% / +0.93% / +0.18% | Bullish 15DMA/50DMA cross on all; GTCO and UBA at new highs | Strong presence on both Institutional & Retail trades |
| Insurance | VERITASKAP / SOVRENINS | +1.38% / +7.55% | Unusual volume, upward RSI, positive YTD, momentum | Primarily Retail-driven (confirmed by trade tables) |
| Consumer | CADBURY / BERGER | +8.04% / +9.06% | Bullish breakouts, moderate RSI, watching for overextension | Additional Retail interest noted |
| ETFs | VETINDETF / VETGRIF30 | -10.00% / -9.43% | Broke below 15DMA, heavy losses — sector-wide ETF unwinding | Likely institutional rebalancing |
| Specialty | NSLTECH | -9.26% | Bearish breakdown, big volume spike | Retail participants likely responding to price action |
Dividend-Beta Matrix (Defensive Screen Highlights)
| Stock | Dividend Yield | Beta | Momentum Signal | Comment |
|---|---|---|---|---|
| UBA | 5.96% | 1.56 | Bullish 15DMA break | High-yield, aggressive uptrend — attractive for both yield and momentum |
| FIDELITYBK | 5.48% | 0.89 | Bullish 15DMA break | Low Beta, decent dividend; safe defensive bet with momentum |
| GTCO | 1.88% | 1.09 | Bullish 15DMA | Balanced profile for traders seeking yield with upside |
| BERGER | 1.15% | 0.56 | Bullish 15DMA | Low beta, low yield; lower volatility with trend resumption |
| SOVRENINS | 3.75% | 1.12 | YTD/Momentum/Volume leader | Yield adds cushion if trend stalls |
Institutional Clustering Alerts
- ZENITHBANK captured 20.17% of institutional trade value (₦520M out of ₦2.58B tracked top-5). Combined volume & value concentration marks it as a high-conviction institutional play—momentum watch.
- GTCO, UBA, MTNN, ACCESSCORP: All showing up on both institutional and retail top-traded lists. These large financials are acting as market liquidity proxies; moves here set tone for wider sentiment.
- MTNN: Despite no price change, top value stock for both Institutional and Retail trades—potential buildup ahead of bigger move.
High Dividend + Momentum Alert
- UBA, FIDELITYBK, SOVRENINS: Present in both high dividend yield and bullish momentum tables. This combination is rare and supportive for core trend traders and defensive portfolio managers.
- GTCO: While not a high-yield standout, combines rising momentum with institutional inflow—yield chasers and growth traders both participating.
Trader Suggestions & Cautions
- Momentum Traders: Focus on stocks with bullish 15DMA/50DMA cross (e.g., GTCO, BERGER, UBA, ACCESSCORP) while maintaining trailing stops, especially for extreme RSI names (NCR, BETAGLAS).
- Reversal Watch: Stocks with high volume but deep price drops (NSLTECH, CUTIX) are possible short-term "dead cat bounces," but risk remains tilted lower unless sentiment quickly turns.
- ETF Traders: Heavy losses in VETINDETF, VETGRIF30, LOTUSHAL15 suggest systematic rebalancing — opportunities may exist for nimble mean-reversion trades if oversold conditions deepen.
- Defensive Investors: Yields plus momentum (UBA, FIDELITY, SOVRENINS) can buffer portfolio volatility, but rotation risk is present if market sentiment sours.
YTD Top 5 Gainers & Losers
| Top 5 YTD Gainers | |||||||
|---|---|---|---|---|---|---|---|
| Symbol | Name | Price | %ChgYTD | RSI | DivYield | PE | 15D/50DMA |
| VERITASKAP | Veritas Kapital | 2.17 | +47.65% | 59.46 | 4.17 | 48.77 | Above |
| NCR | NCR (Nigeria) | 10.50 | +110.00% | 98.74 | 61.22 | 0.00 | Above |
| SIAMLETF40 | SIAML Pension ETF 40 | 651.21 | +84.47% | 64.26 | 4.11 | 0.00 | Above |
| BETAGLAS | BETA GLASS CO PLC. | 449.35 | +648.84% | 98.73 | 2.42 | 5.32 | Above |
| SOVRENINS | Sovereign Trust Ins. | 2.65 | +131.71% | 55.25 | 3.75 | 27.95 | Above |
| Top 5 YTD Losers | |||||||
|---|---|---|---|---|---|---|---|
| Symbol | Name | Price | %ChgYTD | RSI | DivYield | PE | 15D/50DMA |
| VSPBONDETF | Vetiva S&P Bond ETF | 211.02 | -39.69% | 42.95 | 0 | 0.00 | Below |
| MERGROWTH | Meristem Growth ETF | 726.00 | -18.70% | 47.24 | 0 | 0.00 | Below |
| VETINDETF | Vetiva Ind ETF | 50.00 | +7.53% | 52.77 | 0 | 0.00 | Below |
| UPL | University Press | 5.54 | +43.90% | 42.48 | 0.60 | 7.13 | Below |
| THOMASWY | Thomas Wyatt | 3.00 | +57.89% | 41.67 | 1.05 | 0.00 | Above |
Market Activity Comparison – Retail vs Institutional
- Trade Count: Retail made up a dominant 62.3% of trade count but only 37.9% of volume and 16.2% of value – suggesting active "churn” in smaller names, with institutions focusing on block trades in high-conviction picks.
- Volume & Value: Institutional trades accounted for 62.1% of volume and a commanding 83.8% of trade value, confirming big money drove today’s major moves — especially in banking giants (GTCO, UBA, ACCESSCORP, ZENITHBANK).
-
Top Institutional Stocks:
- MTNN, ACCESSCORP, ZENITHBANK, UBA, GTCO
- All are large liquid names, and are also on the Retail top-5 traded list, indicating market-wide focus and ample liquidity.
- ZENITHBANK’s high institutional concentration signals further possible block flows, potentially signposting future price leadership.
-
Top Retail Stocks:
- ACCESSCORP, GTCO, UBA, MTNN, AIICO
- Overlap with institutional top picks shows confluence; retail chase in laggards (AIICO) is also visible—watch for whiplash.
Hidden/Edge Insights
- ETF Stress: Seeing several ETFs among YTD losers and in today's top losers, market-wide risk-off flows and rebalancing may continue if bond/fixed income yields rise.
- Insurance Sector Outperformance: Multiple insurance names (VERITASKAP, SOVRENINS, WAPIC, REGALINS) are present in both YTD gainers and Unusual Volume tables — sector momentum seems sticky; tactical long bias justified.
- Excessive Overbought Readings: Both NCR and BETAGLAS at RSI >98 — statistically rare, often followed by short-term corrections, but may continue "melt-up” before mean reversion bites.
- Retail/Inst’l Trade Overlap: Banking sector names being top-traded by both groups increases short-term volatility and provides robust liquidity; watch pivot days for early trend changes.
Summary Table: Bullish & Bearish Stocks with Highest Technical Edge
| Symbol | 15DMA/Price | RSI | MACD | Sector | Momentum Verdict |
|---|---|---|---|---|---|
| NCR | Above | 98.7 (OB) | +0.85 | IT Services | Strongest Bullish, extreme caution |
| BETAGLAS | Above | 98.7 (OB) | +22.68 | Industrial | Blow-off Top, trailing stops essential |
| VERITASKAP | Above | 59.5 | 0.21 | Insurance | Bullish, momentum intact |
| CUTIX | Below | 53.0 | -0.03 | Electronic/Elec. | Bearish breakdown likely to continue |
| NSLTECH | Below | 59.2 | +0.05 | Specialty | Bearish panic, high volume – monitor for capitulation |
Final Thoughts for Traders:
Stay both nimble and defensive this week. Ultra-strong momentum in select leaders coexists with clear warning signs in breadth and surging ETF outflows. Institutions are driving value into large caps; retail traders are chasing both momentum and speculative volume, sometimes in laggards. Mix trailing stops with position scaling and avoid crowded exits.
|
Top ASI Gainers Over Last 5 Trading Days
|
Top ASI Losers Over Last 5 Trading Days
|
For more detailed analysis, on InfoWARE Market Data Terminal <NSEPERF> <GO>
On InfoWARE Finance Mobile App (Android, iPhone & iPad, Windows Phone and Windows 8/10), "Top Gainers & Losers"
NCR (NIGERIA) PLC. (NCR) topped the advancers list closing at N11.55 with a gain of 10.00% followed by SFS REAL ESTATE INVESTMENT TRUST (SFSREIT) which closed at N301.55 with a gain of 9.99%.
On the flip side LEGEND INTERNET PLC (LEGENDINT) and VETIVA INDUSTRIAL ETF (VETINDETF) topped the decliners log with a loss of -10.00% at a close of N5.40, and -10.00% to close the day at N45.00 respectively.
| Symbol | LClose | %Chg |
|---|---|---|
| NCR | 11.55 | 10.00 |
| SFSREIT | 301.55 | 9.99 |
| BERGER | 34.90 | 9.06 |
| BETAGLAS | 486.00 | 8.16 |
| CADBURY | 62.50 | 8.04 |
| Symbol | LClose | %Chg |
|---|---|---|
| LEGENDINT | 5.40 | -10.00 |
| VETINDETF | 45.00 | -10.00 |
| LOTUSHAL15 | 86.03 | -9.99 |
| VETGRIF30 | 48.00 | -9.43 |
| NSLTECH | 0.98 | -9.26 |
For more detailed analysis,
- On InfoWARE Market Data Terminal <TOPG> <GO>
- On InfoWARE Finance Mobile App ( Android, iPhone & iPad and Windows 10) , "Top Gainers & Losers"
Currency Market
In the currency market, the Naira was unchanged against the dollar at 1 to 1NSE: Bull Signal - Price crossed above 15 Day MA
This signal implies these stocks are under buying pressure and the price might continue to rise and therefore positions should be monitored closely. Further suggested analysis include looking at the overall market (ASI) to see if the uptrend is market wide, sector wide or specific to the stock. Portfolio managers tend to use this as a signal to do more research to add to their positions or lock in some profits. Typically further analysis should be done using commands like PC and RV on the InfoWARE Market Data Terminal. Another command is ALERTS to set price triggers for possible exit or entry as necessary
For more detailed analysis,
- On InfoWARE Market Data Terminal <NSEPERF> <GO>
- On InfoWARE Finance Mobile App ( Android , iPhone & iPad and Windows 10) , "Top Gainers & Losers"
| Symbol | Price | %Chg | 15DMA | PE | EPS | DivY | MktCap | Vol | Trades | Value | LstTradeTime |
|---|---|---|---|---|---|---|---|---|---|---|---|
| BERGER | 34.90 | 8.31 | 33.41 | 14.18 | 1.22 | 1.15 | 10.11B | 1.03M | 115.00 | 34.97M | 26-Aug-2025 14:30:10.613 |
| CADBURY | 62.50 | 7.44 | 62.36 | 33.25 | 0.64 | 1.88 | 117.39B | 1.49M | 203.00 | 91.40M | 26-Aug-2025 14:30:10.720 |
| FGSUK2033S6 | 103.00 | 5.82 | 98.83 | 0.00 | 0.00 | 1.00 | 1.00 | 1.03K | 26-Aug-2025 14:30:54.733 | ||
| OANDO | 53.00 | 4.72 | 51.96 | 24.10 | 2.53 | 1.15 | 658.86B | 6.61M | 718.00 | 352.52M | 26-Aug-2025 14:30:12.860 |
| STERLINGNG | 7.95 | 3.14 | 7.91 | 15.75 | 0.30 | 3.19 | 228.88B | 10.29M | 330.00 | 79.53M | 26-Aug-2025 14:30:13.890 |
| FCMB | 11.20 | 2.68 | 11.04 | 104.31 | 0.09 | 5.62 | 221.79B | 89.30M | 571.00 | 980.80M | 26-Aug-2025 14:30:48.153 |
| PZ | 36.90 | 2.44 | 36.89 | 44.17 | 0.50 | 4.59 | 146.51B | 729.93K | 146.00 | 26.64M | 26-Aug-2025 14:30:13.220 |
| GTCO | 98.00 | 1.99 | 96.92 | 7.49 | 7.10 | 1.88 | 2,884.26B | 12.07M | 1,124.00 | 1.18B | 26-Aug-2025 14:30:48.180 |
| FIDELITYBK | 21.25 | 1.88 | 20.98 | 13.24 | 1.17 | 5.48 | 615.71B | 14.52M | 603.00 | 307.91M | 26-Aug-2025 14:30:48.167 |
| NGXMERIGRW | 10,213.98 | 0.96 | 10,200.54 | 34.89 | 293.99 | 0.00 | 0.00 | 37.27M | 3,927.00 | 1.51B | 26-Aug-2025 14:30:28.223 |
| UBA | 48.40 | 0.93 | 48.17 | 8.29 | 4.05 | 5.96 | 1,655.25B | 9.49M | 1,065.00 | 458.26M | 26-Aug-2025 14:30:49.167 |
| NGXAFRHDYI | 23,203.92 | 0.84 | 23,126.41 | 7.46 | 39.30 | 0.00 | 0.00 | 132.54M | 5,593.00 | 3.71B | 26-Aug-2025 14:30:27.777 |
| ACCESSCORP | 27.50 | 0.18 | 27.48 | 8.56 | 2.81 | 1.87 | 977.49B | 21.44M | 1,339.00 | 588.31M | 26-Aug-2025 14:30:48.930 |
NSE: BEAR Signal - Price crossed below 15 Day MA
This signal implies these stocks are under selling pressure and the price might continue to slide and therefore positions should be monitored closely. Further suggested analysis include looking at the overall market (ASI) to see if the downtrend is market wide, sector wide or specific to the stock. If the overal market trend is upwards, then since these stocks are heading in the opposite direction, then further analysis should be done using commands like PC and RV on the InfoWARE Market Data Terminal. Another command is ALERTS to set price triggers for possible exit is necessar
For more detailed analysis,
- On InfoWARE Market Data Terminal <BEARM> <GO>
- On InfoWARE Finance Mobile App ( Android , iPhone & iPad and Windows 10)
| Symbol | Price | %Chg | 15DMA | PE | EPS | DivY | MktCap | Vol | Trades | Value | LstTradeTime |
|---|---|---|---|---|---|---|---|---|---|---|---|
| TRANSCOHOT | 164.60 | 0.00 | 164.61 | 216.94 | 0.49 | 0.09 | 1,685.92B | 10.08K | 58.00 | 1.64M | 26-Aug-2025 14:30:14.183 |
| FG192053S3 | 98.38 | -1.26 | 99.54 | 0.00 | 0.00 | 4.93K | 1.00 | 4.85M | 26-Aug-2025 14:30:25.260 | ||
| JAPAULGOLD | 2.80 | -1.79 | 2.84 | 0.19 | 12.01 | 0.90 | 17.54B | 10.73M | 171.00 | 30.03M | 26-Aug-2025 14:30:11.563 |
| ETI | 36.50 | -7.40 | 38.06 | 5.00 | 5.10 | 2.00 | 669.76B | 6.04M | 164.00 | 220.55M | 26-Aug-2025 14:30:11.177 |
| CUTIX | 3.55 | -9.86 | 3.82 | 8.81 | 0.26 | 6.52 | 12.51B | 8.80M | 453.00 | 34.76M | 26-Aug-2025 14:30:10.957 |
| NSLTECH | 0.98 | -10.20 | 1.03 | 0.00 | 0.00 | 15.87 | 5.52B | 27.30M | 193.00 | 27.06M | 26-Aug-2025 14:30:12.840 |
| VETGRIF30 | 48.00 | -10.42 | 52.60 | 0.00 | 0.00 | 21.95K | 22.00 | 1.12M | 26-Aug-2025 14:30:48.887 | ||
| LOTUSHAL15 | 86.03 | -11.10 | 87.68 | 0.00 | 0.00 | 17.10K | 24.00 | 1.70M | 26-Aug-2025 14:30:54.067 | ||
| LEGENDINT | 5.40 | -11.11 | 5.74 | 0.00 | 0.00 | 10.55M | 112.00 | 58.02M | 26-Aug-2025 14:30:48.193 |
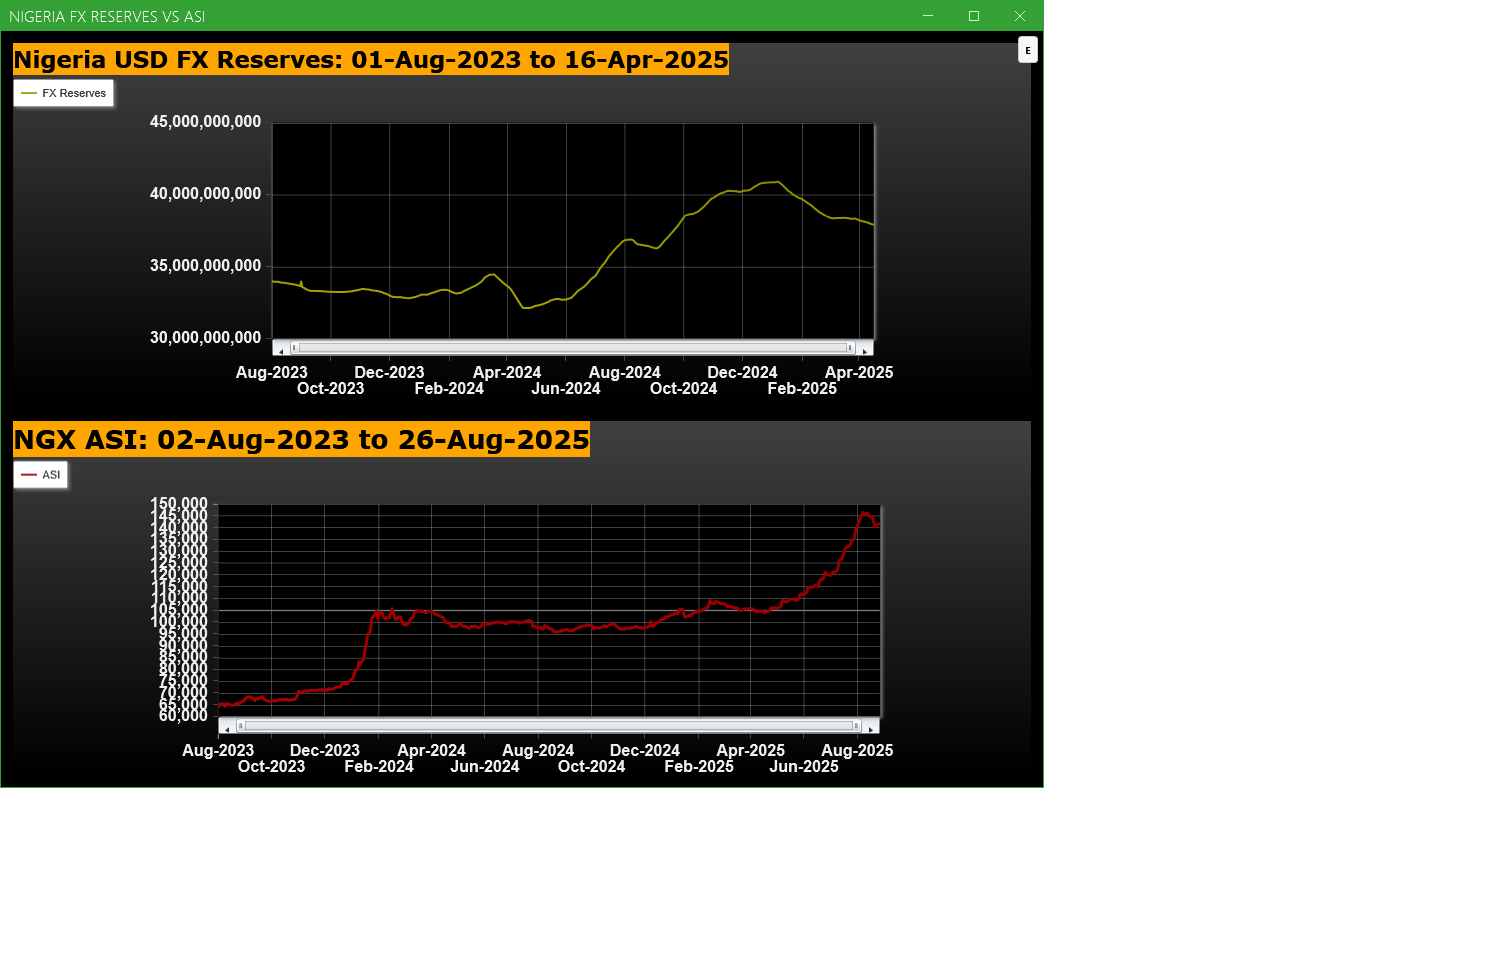
Economic Indicators - Nigeria FX Reserves Vs ASI Chart
Nigeria FX Reserves are assets held on reserve by CBN in foreign currencies. These reserves are used to back liabilities and influence monetary policy. Given the nature of the Nigeria economy, FX Reserves can appear to have an outsize influence on the economy and hence on the capital market. The chart below allows comparison of FX Reserves against the ASI to make investment decisions
For more detailed analysis,
- On InfoWARE Market Data Terminal <CI> <GO>
- On InfoWARE Finance Mobile App ( Android , iPhone & iPad and Windows 10) , "Research"
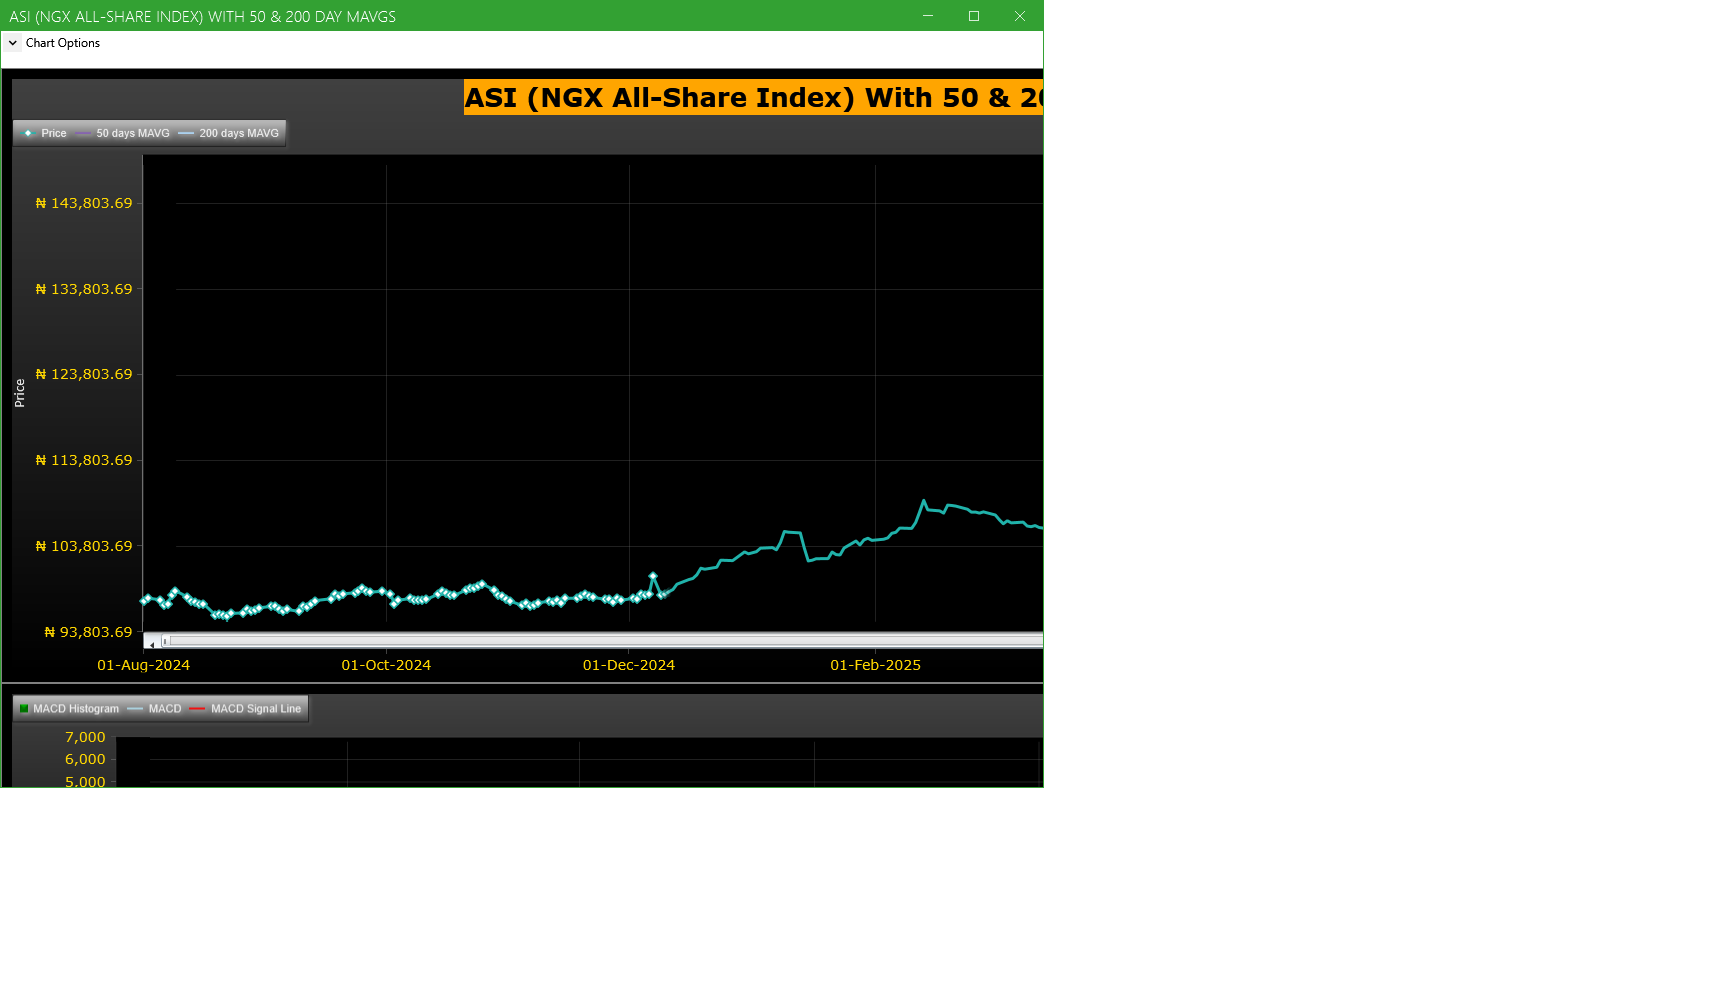
Market Trend - ASI (NGX All-Share-Index) With 50 & 200 Day MAvgs Chart
Technical traders typically use the 50 & 200 day moving averages to aid in choosing
where to enter or exit a position, which then causes these levels to act as strong
support or resistance. As a general guideline, if the price is above a moving average,
the trend is up. If the price is below a moving average, the trend is down.
It is important to note that critics of technical analysis say that moving averages act
as support and resistance because so many traders use these indicators to inform their
trading decisions. Also moving averages tend to work quite well in strong trending conditions
but poorly in choppy or ranging conditions.
Trading Strategies: Crossovers
Crossovers are one of the main moving average strategies. The first type is a price crossover,
which is when the price crosses above or below a moving average to signal a potential change
in trend. Another strategy is to apply two moving averages to a chart: one longer and one
shorter. When the shorter-term MA crosses above the longer-term MA, it is a buy signal, as
it indicates that the trend is shifting up. This is known as a golden cross. Meanwhile, when
the shorter-term MA crosses below the longer-term MA, it is a sell signal, as it indicates that
the trend is shifting down. This is known as a dead/death cross
For more detailed analysis,
- On InfoWARE Market Data Terminal <CI> <GO>
- On InfoWARE Finance Mobile App ( Android , iPhone & iPad and Windows 10) , "Research"
Unusual Volume: Volume traded is more than double the 90 day moving average (All exchanges; ASI & ASem). For more detailed analysis,
- On InfoWARE Market Data Terminal <UV> <GO>
- On InfoWARE Finance Mobile App ( Android , iPhone & iPad and Windows 10)
| Symbol | Name | Volume | 90DAvgVol | %VolChg | Price | LClose | %Chg | Trades | Value |
|---|---|---|---|---|---|---|---|---|---|
| VERITASKAP | VERITAS KAPITAL ASSURANCE PLC | 68.49M | 24.74M | 176.84 | 2.20 | 2.17 | 1.38 | 539 | 154.20M |
| NSLTECH | SECURE ELECTRONIC TECHNOLOGY PLC | 27.30M | 7.37M | 270.48 | 0.98 | 1.08 | -9.26 | 193 | 27.06M |
| WAPCO | LAFARGE WAPCO PLC. | 12.15M | 4.80M | 153.41 | 134.00 | 134.55 | -0.41 | 353 | 1.63B |
| INTENEGINS | INTERNATIONAL ENERGY INSURANCE COMPANY PLC | 5.10M | 2.41M | 112.09 | 3.65 | 3.68 | -0.82 | 83 | 17.97M |
| AUSTINLAZ | AUSTIN LAZ & COMPANY PLC | 4.39M | 315.19K | 1,293.57 | 2.72 | 2.71 | 0.37 | 59 | 12.04M |
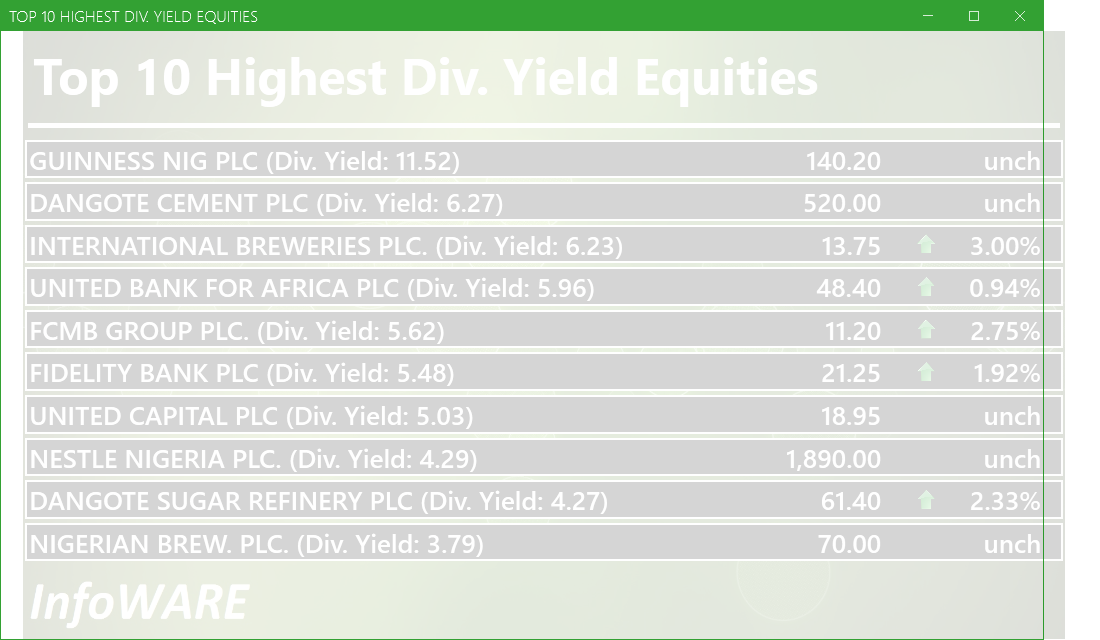
Investment Insights - High Div. Stocks
Dividend stocks distribute a portion of the company earnings to investors on a regular basis and they can a great choice for investors looking for regular income. As an investment or trading strategy, high dividend yield equities provide annual cash payments as against mostly capital gains in the price of a stock. The list in the table below represent the highest dividend paying stocks from the list of the most liquid stocks in the NSE top 30.
For more detailed analysis,
- On InfoWARE Market Data Terminal <HYIELD> <GO>
- On InfoWARE Finance Mobile App ( Android , iPhone & iPad and Windows 10) , "Research"
African Markets
| Name | LClose | Change | %Chg |
|---|---|---|---|
| BRVM Stock Exchange | 317.51 | -1.53 | -0.48 |
| Botswana Stock Exchange | 10,559.88 | 0.00 | 0.00 |
| Egyptian Exchange | 35,810.57 | 0.00 | 0.00 |
| Ghana Stock Exchange | 7,348.65 | 2.20 | 0.03 |
| Casablanca Stock Exchange | 19,997.35 | 15.99 | 0.08 |
| Nigeria Stock Exchange | 141,439.77 | 437.11 | 0.31 |
Nigeria Market Indexes
| Symbol | LClose | %Chg | WTD% | MTD% | QTD% | YTD% | MktCap | Trades |
|---|---|---|---|---|---|---|---|---|
| ASI | 141,761.36 | 0.23 | 0.23 | 0.35 | 18.39 | 37.39 | 27,178 | |
| NGX30 | 5,166.25 | 0.26 | 0.26 | -0.37 | 9.37 | 35.43 | 12,924 | |
| NGXAFRBVI | 3,686.65 | 1.13 | 1.13 | -3.34 | 4.04 | 48.61 | 4,857 | |
| NGXAFRHDYI | 23,203.92 | 0.84 | 0.84 | -0.09 | 10.95 | 36.27 | 5,593 | |
| NGXASEM | 1,538.10 | 0.00 | 0.00 | 6.34 | -3.57 | -2.88 | 8 | |
| NGXBNK | 1,576.16 | 0.73 | 0.73 | -2.64 | 4.33 | 44.94 | 5,546 | |
| NGXCG | 4,159.63 | 0.67 | 0.67 | -3.30 | 20.97 | 47.02 | 12,322 | |
| NGXCNSMRGDS | 3,243.75 | 0.48 | 0.48 | 8.97 | -6.48 | 87.03 | 3,097 | |
| NGXCOMMDTY | 1,066.84 | 0.00 | 0.00 | -2.65 | 1.87 | 6.68 | ||
| NGXGROWTH | 11,174.38 | 0.05 | 0.05 | 0.96 | 17.51 | 43.95 | 334 | |
| NGXINDUSTR | 4,997.60 | 0.09 | 0.09 | -1.15 | 41.86 | 39.92 | 2,487 | |
| NGXINS | 1,343.84 | -0.18 | -0.18 | 51.51 | 81.94 | 70.93 | 4,308 | |
| NGXLOTUSISLM | 11,525.73 | -0.18 | -0.18 | -0.86 | 20.38 | 65.41 | 4,623 | |
| NGXMAINBOARD | 6,874.85 | 0.31 | 0.31 | 3.55 | 16.54 | 37.39 | 21,017 | |
| NGXMERIGRW | 10,213.98 | 0.97 | 0.97 | -0.93 | 5.82 | 56.58 | 3,927 | |
| NGXMERIVAL | 13,969.42 | 0.33 | 0.33 | -3.83 | 16.92 | 33.93 | 6,293 | |
| NGXOILGAS | 2,389.70 | 0.48 | 0.48 | -1.93 | -0.10 | -11.86 | 379 | |
| NGXPENBRD | 2,621.55 | 0.14 | 0.14 | 0.59 | 14.01 | 43.13 | 22,126 | |
| NGXPENSION | 6,767.98 | 0.37 | 0.37 | -2.12 | 6.50 | 49.27 | 14,879 | |
| NGXPREMIUM | 14,012.37 | 0.12 | 0.12 | -5.10 | 22.17 | 43.97 | 5,827 | |
| NGXSOVBND | 658.87 | -0.10 | -0.10 | -2.08 | 0.82 | 9.53 | 0 |
For more detailed analysis,
- On InfoWARE Market Data Terminal <MKTINS> <GO>
- On InfoWARE Finance Mobile App ( Android, iPhone & iPad and Windows 10) , "Market Indexes"
Find the topic interesting? Will like to comment? Contact Us at solutions@infowarelimited.com
Top News

Chart Of The Day - ASI Chart Vs ASI Advance Decline Line (YTD) (26-Aug-2025 15:06:44.871)
InfoWARE AI Analyst Daily Market Report: 26-Aug-2025

[XNSA]>> DAILY FUND PRICE SUBMISSION - FCMB ASSET MANAGEMENT LIMITED
[VSPBONDETF]>> DAILY INDICATIVE PRICES
[XNSA]>> EMERGING AFRICA DAILY FUND PRICES
[XNSA]>> CORDROS MILESTONE FUNDS' BID & OFFER PRICES
[XNSA]>> NGX FIXED INCOME INDICATIVE PRICE LIST FOR AUG 26, 2025
Breaking News! Unusual Volume Alert (26-Aug-2025 11:55:28.376)
Breaking News! Bulls Momentum Alert (26-Aug-2025 11:55:27.046)
Breaking News! Bears Momentum Alert (26-Aug-2025 11:55:26.883)
[XNSA]>> ACTIVATION OF CODE FOR TRADING IN RIGHTS
[TRANSEXPR]>> Earning Forcast - <Q4-2025> ?-<TRANS-NATIONWIDE EXPRESS PLC.>
[XNSA]>> REGISTRATION FOR BATCH TWO- 2025 DEALING CLERKSHIP CERTIFICATION PROGRA
[XNSA]>> NGX NON-INTEREST FINANCE BOARD LAUNCH COMMUNIQUE
[XNSA]>> UPDATED- SAVE THE DATE: 29TH ANNUAL STOCKBROKERS CONFERENCE
[UPL]>>Notice of Meeting -<UNIVERSITY PRESS PLC.>
Chart Of The Day - ASI Chart Vs ASI Advance Decline Line (YTD) (25-Aug-2025 15:13:34.656)
InfoWARE AI Analyst Daily Market Report: 25-Aug-2025
[XNSA]>> CORDROS MILESTONE FUNDS' BID & OFFER PRICES
[RONCHESS]>>Corporate Disclosures-<RONCHESS GLOBAL RESOURCES PLC>
[XNSA]>> DAILY FUND PRICE SUBMISSION - FCMB ASSET MANAGEMENT LIMITED
[XNSA]>> LISTING OF CORONATION INFRASTRUCTURE FUND - SERIES 1
[XNSA]>> DAILY INDICATIVE PRICES
[XNSA]>> OFF MARKET TRADE
[XNSA]>> LISTING OF THE NIGERIAN INFRASTRUCTURE DEBT FUND SCRIP UNIT ISSUES FOR
[XNSA]>> NGX FIXED INCOME INDICATIVE PRICE LIST FOR AUG 25, 2025
[VSPBONDETF]>> DAILY INDICATIVE PRICES.
[XNSA]>> REGISTRATION FOR BATCH TWO- 2025 DEALING CLERKSHIP CERTIFICATION PROGRA
[XNSA]>> NGX NON-INTEREST FINANCE BOARD LAUNCH COMMUNIQUE
[XNSA]>> NOTIFICATION OF PRICE ADJUSTMENT
Get IDIA - the stock trading app for the modern investor
Solutions by Business
Product Suites
Company
Contacts
- 8th Floor,
- South Atlantic Petroleum Towers,
- 1 Adeola Odeku Street,
- Victoria Island,
- Lagos, Nigeria.
- Email: solutions@infowarelimited.com
Follow Us
 |
 |
 |
 |