


InfoWARE AI Analyst Daily Market Report: 27-Aug-2025 | InfoWARE Finance
Get IDIA - the stock trading app for the modern investor


InfoWARE AI Analyst Daily Market Report: 27-Aug-2025
(Source: InfoWARE Terminal, Date: 27-Aug-2025)
Dear Investor,
NGX Daily Market Summary: Wednesday, August 27, 2025
The NGX All Share Index (ASI) tracked a modest -0.36% retreat to 141,761.36, even as YTD returns remain a robust 36.90%. Market activity heated up: turnover surged 39.14% to ₦16.73B and trading volume increased to 621.25M. Despite this liquidity boost, the market breadth was weak at 0.44x with decliners (43) far outpacing advancers (19), pointing to pronounced broad-based pressure. Standouts included the VETIVA S&P Nigeria Sovereign Bond ETF (VSPBONDETF) with its eye-popping +17.40% rally, while the Naira slumped sharply by -1.18% against the USD. Institutional trades dominated value and volume flows, especially concentrated in banking giants and blue chips.
Key Market Trends in Bullet Points
- Market Breadth: Only 19 advancers vs. 43 decliners (breadth ratio 0.44x), highlighting broad-based weakness even as overall activity was strong.
-
Top 5 Gainers:
- VSPBONDETF: +17.40% (Closed at ₦247.80) – Huge price action with technical breakout. Noteworthy for positive momentum and high volatility (RSI: 43), though not yet overbought.
- VETGRIF30: +7.71% (Closed at ₦51.70) – ETF volatility again, but reversed fortunes (also appears in top losers due to weekday volatility).
- DEAPCAP: +4.82% (₦1.74) – Momentum supported by RSI (56), signaling continued buy interest.
- LEGENDINT: +4.63% (₦5.65) – Mid-tier name, positive move but still with moderate RSI—rally not yet extended.
- HONYFLOUR: +4.17% (₦22.50) – Mild upward move consistent with improving sector sentiment.
-
Top 5 Losers:
- CORNERST: -10.00% (₦6.39) – Hit hard, dragged by strong bearish move. RSI at 59, not oversold, indicating more downside?
- RTBRISCOE: -10.00% (₦3.06) – Heavy fall, low RSI, highlights capitulation risk.
- SIAMLETF40: -10.00% (₦586.09) – Overbought ETF (RSI: 84.5), aggressive correction may not be over.
- ABCTRANS: -9.80% (₦4.51) – Confirmed uptrend reversal with RSI at 57.9, bears in control.
- NGXGROUP: -9.70% (₦53.55) – Unusual for exchange—signals shifting confidence or portfolio rebalancing by big investors.
-
YTD Movers Table (Top 5 as of Wednesday):
Stock Symbol YTD %Chg RSI 5 Day %Chg 1 Day %Chg VERITAS KAPITAL VERITASKAP +47.65 60.13 +11.11 0.00 GEREGU Power GEREGU -0.74 48.13 +11.11 0.00 MCNICHOLS MCNICHOLS +120.50 53.17 +10.94 0.00 OANDO OANDO -18.01 50.73 +10.10 +1.79 NCR (NIGERIA) NCR +110.00 99.13 +10.00 0.00 -
YTD Top Losers Table (Top 5):
Stock Symbol YTD %Chg RSI 5 Day %Chg 1 Day %Chg NSLTECH NSLTECH +37.68 49.88 -13.64 -3.06 CAVERTON CAVERTON +150.98 50.65 -12.33 -8.83 UPL UPL +43.89 42.48 -12.06 0.00 CORNERST CORNERST +61.36 59.51 -10.00 -10.00 RTBRISCOE RTBRISCOE +11.27 45.53 -10.00 -10.00
Technical & Momentum Insights
-
Bullish Momentum:
- VSPBONDETF crossed above its 15-Day MA (223.74 vs. close at 247.80)—potential start of a new uptrend despite RSI around a neutral 43.0. (Note: No extreme RSI readings & the ETF’s MACD histogram is narrowing, suggesting buyers may still have room).
-
Bearish Momentum:
- CORNERST & ABCTRANS: Both fell sharply after crossing below 15DMA, signaling fresh technical weakness. Their RSI values are not yet oversold, warning that more downside could be possible.
- Banks/Financials: ACCESSCORP, FCMB, GTCO all broke below their 15DMA and closed down. Heavy institutional activity, but sector is seeing profit-taking/cautious rotation out of banking names after strong YTD runs.
- UNILEVER, INTBREW, REGALINS: Persistent downtrend, all closing below 15DMA with negative price momentum and no technical sign of reversal.
-
Unusual Volume:
- CUTIX, FCMB, ARADEL: All with volume more than 2x their 90-day average. This often signals either institutional repositioning or rumors ahead of a corporate event. Cutix’s heavy volume during a price slip hints at possible distribution by large holder(s).
- STERLINGNG: Huge volume (279% of average) but only a modest move up (+0.63%), possible early accumulation or resistance zone.
-
Institutional & Retail Patterns:
- Institutions did only 38.77% of trades but controlled a staggering 70.67% of volume and 90.89% of value—greater than typical dominance.
- Top Institutional focus: ACCESSCORP, FIRSTHOLDCO, MTNN, GTCO, ZENITHBANK—all key financial services/telecoms blue chips.
- Retail investors favored similar blue chips but at much smaller trade values and volumes, with NEIMETH sneaking in as a retail favorite—potential for outsized volatility.
- Correlation: Declines in heavy institutional favorites like GTCO and ZENITHBANK may indicate broad sector rotation or pre-emptive rebalancing ahead of expected macro changes.
-
Liquidity & Sentiment:
- Turnover spiked 39%, but breadth weakened further—rising liquidity into declining prices is often a warning flag for further price weakness or profit-taking regimes.
- Volume up in 71 companies, showing active churning as investors are repositioning portfolios.
-
Currency Headwinds:
- The Naira's sharp -1.18% fall adds pressure to foreign-currency exposed sectors and puts focus on defensive plays with strong local earnings.
Contrarian Signals
- SIAMLETF40: -10% (₦586.09) despite a heavily overbought RSI at 84.5 and blockbuster previous momentum. MACD still strong, but such high RSI readings typically precede deeper pullbacks.
- CAVERTON: YTD up +150.98%, yet losing -8.83% today with barely neutral RSI—momentum fading, possible distribution phase.
- CORNERST: Down -10% on both 1-day and 5-day, but RSI still at 59—suggests more room to fall but not yet technically oversold, a possible value-trap scenario.
- VERITASKAP: YTD up strongly, yet flat on the day and with neutral RSI; any break could trigger a reversal.
Sector Heatmap & Technical Patterns
| Sector | Avg %Change | Vol Change | Notable Movers | Technical Score |
|---|---|---|---|---|
| Banking | -1.2% | Mixed (Heavy inst. flow) | FCMB (-1.79%), ACCESSCORP (-1.10%), GTCO (-3.16%), ZENITHBANK (-0.99%) | Bearish (Break below key moving avgs) |
| Insurance | -4.5% | High | CORNERST (-10%), REGALINS (-7.52%), LINKASSURE, SUNUASSUR | Bearish (Most stocks below 15DMA) |
| Consumer Goods | -0.87% | Low | UNILEVER (-4.79%), HONYFLOUR (+4.17%) | Cautiously Bearish |
| ETFs | Highly volatile (VSPBONDETF +17.4% / VETGRIF30 -7.71%) | High | VSPBONDETF, VETGRIF30, SIAMLETF40 | Mixed Momentum (Contrarian signals) |
| Telecom | Flat | Stable | MTNN (0%) | Stable |
| Oil & Gas | +1% | Rising | ARADEL (unusual volume, flat price), OANDO (+1.79%) | Bullish volume, prices mixed |
Dividend-Yield vs Beta Matrix (Defensive Play Opportunities)
| Stock | Div. Yield | Beta | Momentum Signal |
|---|---|---|---|
| AFRIPRUD | 1.27% | 0.64 | Stable |
| HONYFLOUR | 1.54% | 0.98 | Bullish (4.17% up today) |
| REGALINS | 6.52% | 0.47 | Bearish (Crossed below 15 DMA) |
| CORNERST | 5.28% | 0.93 | Bearish, heavy losses |
Institutional Clustering Alerts
- ACCESSCORP, FIRSTHOLDCO, GTCO, ZENITHBANK, MTNN: Featured as the top institutional targets by value and volume—suggests focus on liquidity and risk management by large players.
- ZENITHBANK: Accounted for over 20.1% of institutional trade value—banking sector under close institutional watch; could be early signal of rotation or consolidation.
- High clustering in first-tier banks and blue-chip telecom—liquidity premium or flight to perceived safety within equities.
Trade Suggestions & Market Outlook
-
Traders:
- Watch for possible short-term bounce-back in stocks with heavy oversold conditions and high volume—particularly in mid- and small-cap names within insurance and banking, but only once reversal signals emerge (e.g., bullish MACD cross).
- Bullish Setups: VSPBONDETF (ETF break above 15DMA, high volatility—momentum traders may play for further upside, but with tight stops).
- Caution: Stay away from names with high dividend yield but confirmed technical breakdown (REGALINS, CORNERST)—don't catch a falling knife.
- Look for defensive allocation in low-beta, high-dividend stocks which have stabilized (AFRIPRUD, HONYFLOUR).
- Unusual volume signals can precede breakouts or breakdowns; monitor CUTIX and STERLINGNG for followthrough moves (potential for mean-reversion plays).
- Short-term caution remains warranted—expanding volume on declining breadth and the currency’s continued slide may foreshadow more volatility.
- Institutional flow into large-caps could offer cushion but also signals reallocation by big players; retail should follow market leaders closely.
Retail vs Institutional Trade Analysis
- Trade Count: Retail investors made up 61.23% of trades but commanded only 9.11% of traded value — institutions still dictate price and flow.
-
Top Institutions’ focus:
- ACCESSCORP: 35.6M shares / ₦973M traded
- FIRSTHOLDCO: 34.4M shares / ₦1.12B traded
- MTNN: 2.1M shares / ₦856.4M
- GTCO: 8.6M shares / ₦835M
- ZENITHBANK: 6.3M shares / ₦441M
-
Top Retail Traded:
- ACCESSCORP
- GTCO
- MTNN
- ZENITHBANK
- NEIMETH
- Hidden Insight: Institutional clustering in ACCESSCORP, GTCO, ZENITHBANK suggests these stocks will continue to set market tone; outsized retail activity not matched by institutional interest (e.g., NEIMETH) may mean temporary spikes rather than sustained rallies.
In summary, the market faces a classic liquidity-versus-breadth dilemma as large-caps are propped up by institutional flows, but the wider market sells off amid profit-taking, macro caution, and forex anxiety. Multi-strategy traders should remain nimble: play momentum but with strict discipline, rotate into defense, and monitor sector-wide technical signals for confirmation of potential reversals or breakdowns.
|
Top ASI Gainers Over Last 5 Trading Days
|
Top ASI Losers Over Last 5 Trading Days
|
For more detailed analysis, on InfoWARE Market Data Terminal <NSEPERF> <GO>
On InfoWARE Finance Mobile App (Android, iPhone & iPad, Windows Phone and Windows 8/10), "Top Gainers & Losers"
VETIVA S & P NIGERIA SOVEREIGN BOND ETF (VSPBONDETF) topped the advancers list closing at N247.80 with a gain of 17.40% followed by VETIVA GRIFFIN 30 ETF (VETGRIF30) which closed at N51.70 with a gain of 7.71%.
On the flip side CORNERSTONE INSURANCE COMPANY PLC. (CORNERST) and R T BRISCOE PLC. (RTBRISCOE) topped the decliners log with a loss of -10.00% at a close of N6.39, and -10.00% to close the day at N3.06 respectively.
| Symbol | LClose | %Chg |
|---|---|---|
| VSPBONDETF | 247.80 | 17.40 |
| VETGRIF30 | 51.70 | 7.71 |
| DEAPCAP | 1.74 | 4.82 |
| LEGENDINT | 5.65 | 4.63 |
| HONYFLOUR | 22.50 | 4.17 |
| Symbol | LClose | %Chg |
|---|---|---|
| CORNERST | 6.39 | -10.00 |
| RTBRISCOE | 3.06 | -10.00 |
| SIAMLETF40 | 586.09 | -10.00 |
| LOTUSHAL15 | 77.43 | -10.00 |
| ABCTRANS | 4.51 | -9.80 |
For more detailed analysis,
- On InfoWARE Market Data Terminal <TOPG> <GO>
- On InfoWARE Finance Mobile App ( Android, iPhone & iPad and Windows 10) , "Top Gainers & Losers"
Currency Market
In the currency market, the Naira fell 1.18%(-17.87) sharply against the Dollar to settle at 1 to 1NSE: Bull Signal - Price crossed above 15 Day MA
This signal implies these stocks are under buying pressure and the price might continue to rise and therefore positions should be monitored closely. Further suggested analysis include looking at the overall market (ASI) to see if the uptrend is market wide, sector wide or specific to the stock. Portfolio managers tend to use this as a signal to do more research to add to their positions or lock in some profits. Typically further analysis should be done using commands like PC and RV on the InfoWARE Market Data Terminal. Another command is ALERTS to set price triggers for possible exit or entry as necessary
For more detailed analysis,
- On InfoWARE Market Data Terminal <NSEPERF> <GO>
- On InfoWARE Finance Mobile App ( Android , iPhone & iPad and Windows 10) , "Top Gainers & Losers"
| Symbol | Price | %Chg | 15DMA | PE | EPS | DivY | MktCap | Vol | Trades | Value | LstTradeTime |
|---|---|---|---|---|---|---|---|---|---|---|---|
| VSPBONDETF | 247.80 | 14.82 | 223.74 | 0.00 | 0.00 | 33.00 | 4.00 | 7.25K | 27-Aug-2025 14:31:03.150 |
NSE: BEAR Signal - Price crossed below 15 Day MA
This signal implies these stocks are under selling pressure and the price might continue to slide and therefore positions should be monitored closely. Further suggested analysis include looking at the overall market (ASI) to see if the downtrend is market wide, sector wide or specific to the stock. If the overal market trend is upwards, then since these stocks are heading in the opposite direction, then further analysis should be done using commands like PC and RV on the InfoWARE Market Data Terminal. Another command is ALERTS to set price triggers for possible exit is necessar
For more detailed analysis,
- On InfoWARE Market Data Terminal <BEARM> <GO>
- On InfoWARE Finance Mobile App ( Android , iPhone & iPad and Windows 10)
| Symbol | Price | %Chg | 15DMA | PE | EPS | DivY | MktCap | Vol | Trades | Value | LstTradeTime |
|---|---|---|---|---|---|---|---|---|---|---|---|
| SUNUASSUR | 5.92 | -0.51 | 5.96 | 0.00 | 0.00 | 0.99 | 34.40B | 2.09M | 91.00 | 11.78M | 27-Aug-2025 14:30:22.210 |
| NGXCNSMRGDS | 3,215.70 | -0.87 | 3,219.93 | 30.19 | 55.24 | 0.00 | 0.00 | 21.36M | 3,083.00 | 3.57B | 27-Aug-2025 14:30:32.220 |
| ACCESSCORP | 27.20 | -1.10 | 27.46 | 8.56 | 2.81 | 1.87 | 966.83B | 39.34M | 1,383.00 | 1.08B | 27-Aug-2025 14:31:03.273 |
| NGXMERIGRW | 10,095.38 | -1.17 | 10,177.34 | 34.89 | 293.99 | 0.00 | 0.00 | 110.28M | 3,530.00 | 2.66B | 27-Aug-2025 14:30:32.390 |
| LINKASSURE | 2.33 | -1.72 | 2.37 | 59.89 | 0.02 | 5.56 | 32.62B | 8.83M | 111.00 | 20.15M | 27-Aug-2025 14:30:58.350 |
| WEMABANK | 23.00 | -1.74 | 23.16 | 216.91 | 0.04 | 5.81 | 295.74B | 4.44M | 254.00 | 102.14M | 27-Aug-2025 14:31:02.697 |
| FCMB | 11.00 | -1.82 | 11.01 | 104.31 | 0.09 | 5.62 | 217.83B | 108.49M | 540.00 | 1.19B | 27-Aug-2025 14:30:58.310 |
| VETBANK | 15.75 | -1.90 | 15.89 | 0.00 | 0.00 | 2.00 | 1.00 | 31.50 | 27-Aug-2025 14:31:03.063 | ||
| ELLAHLAKES | 14.95 | -2.34 | 15.24 | 0.00 | 0.00 | 0.00 | 29.90B | 10.57M | 480.00 | 159.72M | 27-Aug-2025 14:30:58.290 |
| GTCO | 95.00 | -3.16 | 96.62 | 7.49 | 7.10 | 1.88 | 2,795.96B | 9.37M | 1,272.00 | 909.61M | 27-Aug-2025 14:30:10.557 |
| NGXINS | 1,297.89 | -3.54 | 1,354.17 | 10.41 | 2.09 | 0.00 | 0.00 | 127.40M | 3,152.00 | 406.96M | 27-Aug-2025 14:30:32.303 |
| UNILEVER | 73.00 | -4.79 | 75.51 | 67.09 | 0.40 | 2.81 | 419.39B | 304.71K | 81.00 | 22.46M | 27-Aug-2025 14:30:22.790 |
| UNIVINSURE | 1.23 | -5.69 | 1.24 | 0.00 | 0.00 | 0.00 | 19.68B | 5.89M | 214.00 | 7.57M | 27-Aug-2025 14:30:22.930 |
| INTBREW | 13.00 | -5.77 | 13.11 | 0.00 | 0.00 | 6.23 | 349.21B | 1.07M | 123.00 | 14.44M | 27-Aug-2025 14:30:58.330 |
| REGALINS | 1.33 | -7.52 | 1.40 | 4.35 | 0.11 | 6.52 | 8.87B | 17.15M | 172.00 | 23.90M | 27-Aug-2025 14:30:13.353 |
| ABCTRANS | 4.51 | -10.86 | 4.87 | 6.68 | 0.17 | 2.19 | 10.79B | 1.48M | 104.00 | 6.74M | 27-Aug-2025 14:30:08.403 |
| CORNERST | 6.39 | -11.11 | 7.10 | 8.62 | 0.35 | 5.28 | 116.08B | 1.70M | 125.00 | 11.73M | 27-Aug-2025 14:30:09.377 |
| FGSUK2031S4 | 80.00 | -21.17 | 94.95 | 0.00 | 0.00 | 5.00K | 3.00 | 4.00M | 27-Aug-2025 14:31:12.617 | ||
| FGS202772 | 70.00 | -85.71 | 114.00 | 0.00 | 0.00 | 23.00 | 1.00 | 16.10K | 27-Aug-2025 14:30:30.320 |
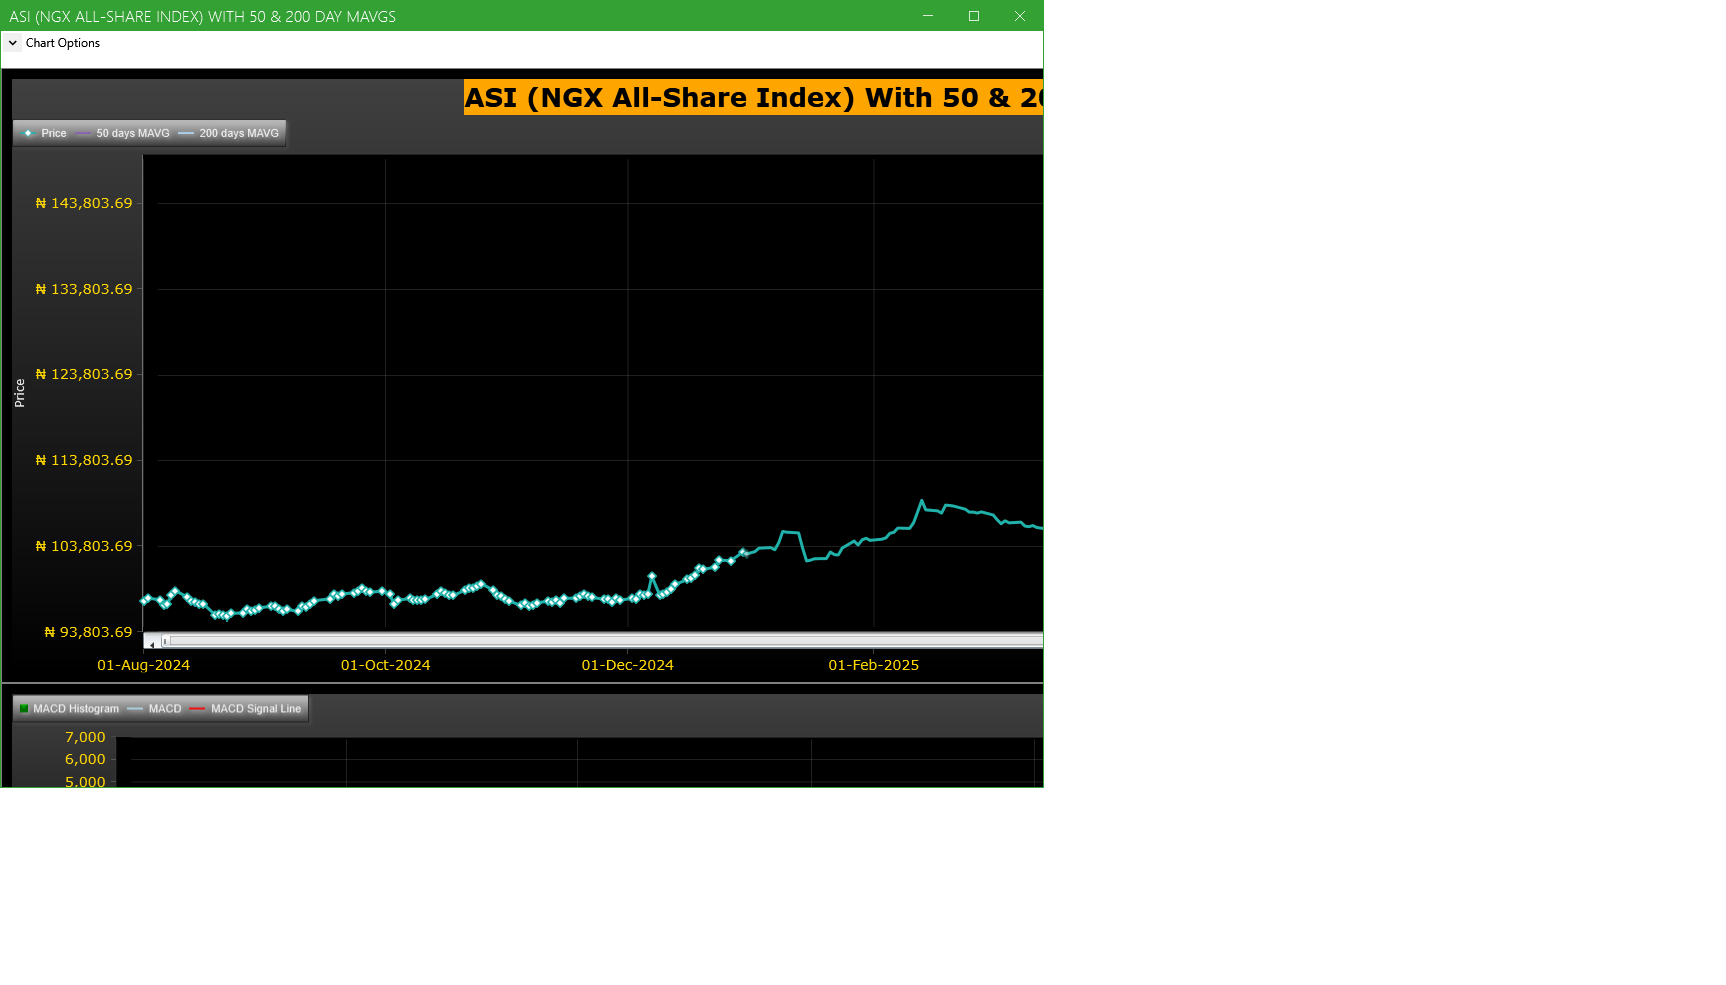
Market Trend - ASI (NGX All-Share-Index) With 50 & 200 Day MAvgs Chart
Technical traders typically use the 50 & 200 day moving averages to aid in choosing
where to enter or exit a position, which then causes these levels to act as strong
support or resistance. As a general guideline, if the price is above a moving average,
the trend is up. If the price is below a moving average, the trend is down.
It is important to note that critics of technical analysis say that moving averages act
as support and resistance because so many traders use these indicators to inform their
trading decisions. Also moving averages tend to work quite well in strong trending conditions
but poorly in choppy or ranging conditions.
Trading Strategies: Crossovers
Crossovers are one of the main moving average strategies. The first type is a price crossover,
which is when the price crosses above or below a moving average to signal a potential change
in trend. Another strategy is to apply two moving averages to a chart: one longer and one
shorter. When the shorter-term MA crosses above the longer-term MA, it is a buy signal, as
it indicates that the trend is shifting up. This is known as a golden cross. Meanwhile, when
the shorter-term MA crosses below the longer-term MA, it is a sell signal, as it indicates that
the trend is shifting down. This is known as a dead/death cross
For more detailed analysis,
- On InfoWARE Market Data Terminal <CI> <GO>
- On InfoWARE Finance Mobile App ( Android , iPhone & iPad and Windows 10) , "Research"
Unusual Volume: Volume traded is more than double the 90 day moving average (All exchanges; ASI & ASem). For more detailed analysis,
- On InfoWARE Market Data Terminal <UV> <GO>
- On InfoWARE Finance Mobile App ( Android , iPhone & iPad and Windows 10)
| Symbol | Name | Volume | 90DAvgVol | %VolChg | Price | LClose | %Chg | Trades | Value |
|---|---|---|---|---|---|---|---|---|---|
| FCMB | FCMB GROUP PLC. | 108.49M | 51.75M | 109.63 | 11.00 | 11.20 | -1.79 | 540 | 1.19B |
| STERLINGNG | STERLING FINANCIAL HOLDINGS COMPANY PLC | 86.04M | 22.66M | 279.63 | 8.00 | 7.95 | 0.63 | 400 | 688.08M |
| CUTIX | CUTIX PLC. | 45.81M | 10.86M | 321.74 | 3.50 | 3.55 | -1.41 | 623 | 155.69M |
| FIRSTHOLDCO | FIRST HOLDCO PLC | 35.78M | 15.25M | 134.60 | 32.50 | 32.50 | 0.00 | 476 | 1.16B |
| ARADEL | ARADEL HOLDINGS PLC | 8.03M | 1.68M | 377.50 | 510.00 | 510.00 | 0.00 | 370 | 4.10B |
Investment Insights - High Div. Stocks
Dividend stocks distribute a portion of the company earnings to investors on a regular basis and they can a great choice for investors looking for regular income. As an investment or trading strategy, high dividend yield equities provide annual cash payments as against mostly capital gains in the price of a stock. The list in the table below represent the highest dividend paying stocks from the list of the most liquid stocks in the NSE top 30.
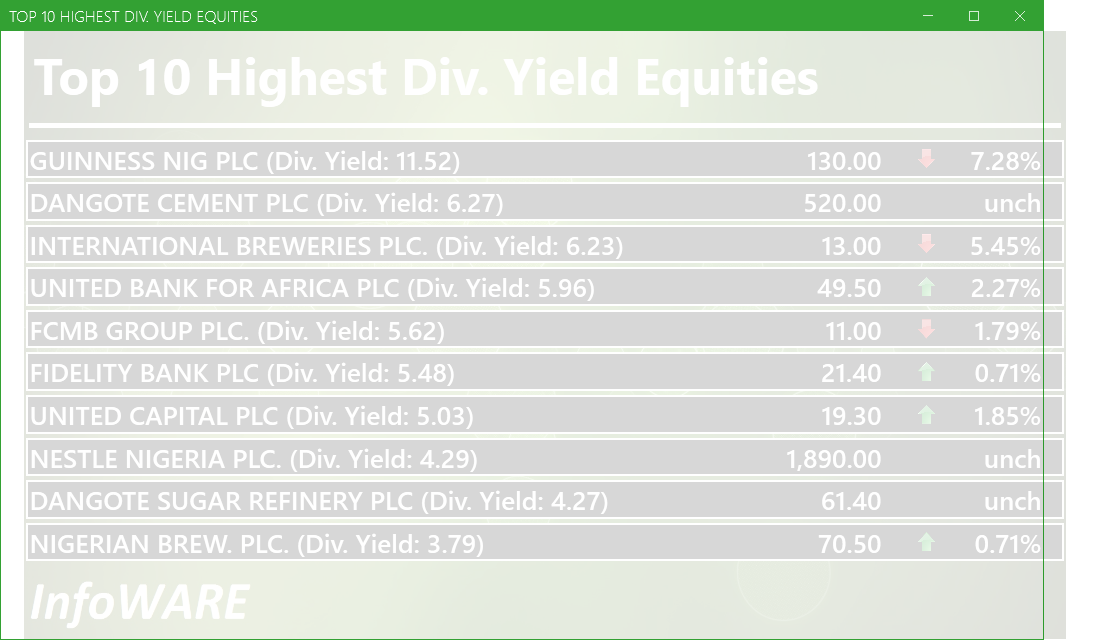
For more detailed analysis,
- On InfoWARE Market Data Terminal <HYIELD> <GO>
- On InfoWARE Finance Mobile App ( Android , iPhone & iPad and Windows 10) , "Research"
Investment Insights - Stocks outperforming the ASI but with approximately the same risk
These list of stocks represent equities that are less risky than the ASI but doing better than the ASI (All Shares Index) using the YTD (Year to Date) returns as the measure. The risk is measured by Beta. Beta is an assessment of a stock's tendency to undergo price changes, (its volatility), as well as its potential returns compared to the ASI. It is expressed as a ratio, where a score of 1 represents performance comparable to the ASI, and returns above or below the market may receive scores greater or lower than 1.
For a full list of both positively and negatively corelated stocks visit InfoWARE Market Data Terminal
- On InfoWARE Market Data Terminal <BANL> <GO>
- On InfoWARE Finance Mobile App ( Android , iPhone & iPad and Windows 10)
| Symbol | DivYield | PE | EPS | Beta | %ChgYTD | ASIYTDReturn | BetaDiff |
|---|---|---|---|---|---|---|---|
| HONYFLOUR | 1.40 | 16.28 | 0.31 | 0.99 | 225.14 | 36.90 | 0.01 |
| CAVERTON | 5.52 | 1.15 | 1.57 | 0.98 | 150.98 | 36.90 | 0.02 |
| ROYALEX | 7.81 | 0.00 | 0.00 | 0.96 | 95.45 | 36.90 | 0.04 |
| CORNERST | 5.28 | 8.62 | 0.35 | 0.93 | 61.36 | 36.90 | 0.07 |
| DEAPCAP | 13.76 | 188.84 | 0.01 | 0.89 | 45.00 | 36.90 | 0.11 |
| VERITASKAP | 4.17 | 48.77 | 0.02 | 0.88 | 47.65 | 36.90 | 0.12 |
| UNIVINSURE | 0.00 | 0.00 | 0.00 | 0.83 | 70.83 | 36.90 | 0.17 |
| FTNCOCOA | 1.60 | 0.00 | 0.00 | 0.79 | 245.74 | 36.90 | 0.21 |
| NB | 3.79 | 16.95 | 1.60 | 0.79 | 120.31 | 36.90 | 0.21 |
| MAYBAKER | 3.75 | 58.94 | 0.14 | 0.78 | 92.02 | 36.90 | 0.22 |
African Markets
| Name | LClose | Change | %Chg |
|---|---|---|---|
| BRVM Stock Exchange | 320.91 | 3.40 | 1.07 |
| Botswana Stock Exchange | 10,560.08 | 0.00 | 0.00 |
| Egyptian Exchange | 35,358.34 | -451.20 | -1.26 |
| Ghana Stock Exchange | 7,335.76 | -13.23 | -0.18 |
| Lusaka Stock Exchange | 23,083.42 | 16.15 | 0.07 |
| Casablanca Stock Exchange | 20,065.36 | 67.99 | 0.34 |
| Malawi Stock Exchange | 519,415.84 | 23,316.66 | 4.70 |
| Nairobi Securities Exchange | 172.35 | 1.94 | 1.14 |
| Uganda Securities Exchange | 1,431.97 | -0.14 | -0.01 |
Nigeria Market Indexes
| Symbol | LClose | %Chg | WTD% | MTD% | QTD% | YTD% | MktCap | Trades |
|---|---|---|---|---|---|---|---|---|
| ASI | 141,248.76 | -0.36 | -0.14 | -0.01 | 17.96 | 36.90 | 26,961 | |
| NGX30 | 5,152.36 | -0.27 | -0.01 | -0.64 | 9.07 | 35.06 | 12,834 | |
| NGXAFRBVI | 3,652.44 | -0.93 | 0.19 | -4.24 | 3.07 | 47.23 | 5,052 | |
| NGXAFRHDYI | 23,127.04 | -0.33 | 0.51 | -0.42 | 10.58 | 35.82 | 6,077 | |
| NGXASEM | 1,538.10 | 0.00 | 0.00 | 6.34 | -3.57 | -2.88 | 8 | |
| NGXBNK | 1,564.22 | -0.76 | -0.03 | -3.38 | 3.54 | 43.85 | 5,611 | |
| NGXCG | 4,140.16 | -0.47 | 0.19 | -3.75 | 20.40 | 46.34 | 13,095 | |
| NGXCNSMRGDS | 3,215.70 | -0.86 | -0.39 | 8.03 | -7.29 | 85.41 | 3,083 | |
| NGXCOMMDTY | 1,066.84 | 0.00 | 0.00 | -2.65 | 1.87 | 6.68 | ||
| NGXGROWTH | 11,173.56 | -0.01 | 0.04 | 0.96 | 17.50 | 43.94 | 396 | |
| NGXINDUSTR | 4,997.47 | 0.00 | 0.08 | -1.15 | 41.86 | 39.92 | 2,718 | |
| NGXINS | 1,297.89 | -3.42 | -3.59 | 46.33 | 75.72 | 65.09 | 3,152 | |
| NGXLOTUSISLM | 11,518.18 | -0.07 | -0.25 | -0.93 | 20.30 | 65.31 | 4,327 | |
| NGXMAINBOARD | 6,836.54 | -0.56 | -0.25 | 2.97 | 15.89 | 36.62 | 20,618 | |
| NGXMERIGRW | 10,095.38 | -1.16 | -0.20 | -2.08 | 4.59 | 54.76 | 3,530 | |
| NGXMERIVAL | 13,961.51 | -0.06 | 0.27 | -3.89 | 16.85 | 33.85 | 6,488 | |
| NGXOILGAS | 2,394.03 | 0.18 | 0.66 | -1.75 | 0.08 | -11.70 | 414 | |
| NGXPENBRD | 2,616.04 | -0.21 | -0.07 | 0.38 | 13.77 | 42.83 | 21,935 | |
| NGXPENSION | 6,743.48 | -0.36 | 0.01 | -2.47 | 6.12 | 48.73 | 14,686 | |
| NGXPREMIUM | 14,012.55 | 0.00 | 0.12 | -5.10 | 22.17 | 43.97 | 5,947 | |
| NGXSOVBND | 658.87 | 0.00 | -0.10 | -2.08 | 0.82 | 9.53 | 0 |
For more detailed analysis,
- On InfoWARE Market Data Terminal <MKTINS> <GO>
- On InfoWARE Finance Mobile App ( Android, iPhone & iPad and Windows 10) , "Market Indexes"
Find the topic interesting? Will like to comment? Contact Us at solutions@infowarelimited.com
Top News

Chart Of The Day - ASI Chart Vs ASI Advance Decline Line (YTD) (27-Aug-2025 15:06:59.938)
InfoWARE AI Analyst Daily Market Report: 27-Aug-2025

[XNSA]>> CORDROS MILESTONE FUNDS' BID & OFFER PRICES
[XNSA]>> APPOINTMENT OF A DIRECTOR
[XNSA]>> DAILY FUND PRICE SUBMISSION - FCMB ASSET MANAGEMENT LIMITED
[XNSA]>> EMERGING AFRICA DAILY FUND PRICES
[XNSA]>> NGX FIXED INCOME INDICATIVE PRICE LIST FOR AUG 27, 2025
[VETGOODS]>> DAILY INDICATIVE PRICES
[XNSA]>> REGISTRATION FOR BATCH TWO- 2025 DEALING CLERKSHIP CERTIFICATION PROGRA
[XNSA]>> NGX NON-INTEREST FINANCE BOARD LAUNCH COMMUNIQUE
[XNSA]>> UPDATED- SAVE THE DATE: 29TH ANNUAL STOCKBROKERS CONFERENCE
[XNSA]>> SUPPLEMENTARY LISTING OF FGN BONDS ISSUED IN MAY 2025
[SIAMLETF40]>> DAILY INDICATIVE PRICES
Chart Of The Day - ASI Chart Vs ASI Advance Decline Line (YTD) (26-Aug-2025 15:06:44.871)
InfoWARE AI Analyst Daily Market Report: 26-Aug-2025
[XNSA]>> DAILY FUND PRICE SUBMISSION - FCMB ASSET MANAGEMENT LIMITED
[VSPBONDETF]>> DAILY INDICATIVE PRICES
[XNSA]>> EMERGING AFRICA DAILY FUND PRICES
[XNSA]>> CORDROS MILESTONE FUNDS' BID & OFFER PRICES
[XNSA]>> NGX FIXED INCOME INDICATIVE PRICE LIST FOR AUG 26, 2025
Breaking News! Unusual Volume Alert (26-Aug-2025 11:55:28.376)
Breaking News! Bulls Momentum Alert (26-Aug-2025 11:55:27.046)
Breaking News! Bears Momentum Alert (26-Aug-2025 11:55:26.883)
[XNSA]>> ACTIVATION OF CODE FOR TRADING IN RIGHTS
[TRANSEXPR]>> Earning Forcast - <Q4-2025> ?-<TRANS-NATIONWIDE EXPRESS PLC.>
[XNSA]>> REGISTRATION FOR BATCH TWO- 2025 DEALING CLERKSHIP CERTIFICATION PROGRA
[XNSA]>> NGX NON-INTEREST FINANCE BOARD LAUNCH COMMUNIQUE
[XNSA]>> UPDATED- SAVE THE DATE: 29TH ANNUAL STOCKBROKERS CONFERENCE
[UPL]>>Notice of Meeting -<UNIVERSITY PRESS PLC.>
Chart Of The Day - ASI Chart Vs ASI Advance Decline Line (YTD) (25-Aug-2025 15:13:34.656)
Get IDIA - the stock trading app for the modern investor
Solutions by Business
Product Suites
Company
Contacts
- 8th Floor,
- South Atlantic Petroleum Towers,
- 1 Adeola Odeku Street,
- Victoria Island,
- Lagos, Nigeria.
- Email: solutions@infowarelimited.com
Follow Us
 |
 |
 |
 |