


InfoWARE AI Analyst Daily Market Report: 03-Sep-2025 | InfoWARE Finance
Get IDIA - the stock trading app for the modern investor


InfoWARE AI Analyst Daily Market Report: 03-Sep-2025
(Source: InfoWARE Terminal, Date: 03-Sep-2025)
Dear Investor,
NGX Market Daily Summary – Wednesday, September 3, 2025
Market Overview
The NGX All Share Index (ASI) ended Wednesday's session with a -0.42% decline, closing at 138,737.64. Despite a slight pull-back, the market remains robust with a 33.90% Year-to-Date (YTD) return. Turnover picked up pace with a significant 20.56% increase to ₦12.92B compared to yesterday, driven by both institutional and retail activity. However, market breadth was notably weak (0.31x), with just 15 advancers versus 49 decliners, signaling a persistent bearish undertone even as trading volumes rose sharply across sectors.
🔎 Key Market Breadth & Trends
- Market Breadth: Only 15 stocks advanced versus 49 decliners, indicating broad-based selling pressure even as the total volume traded surged (450.36M vs 370.39M yesterday).
- Turnover Spike: Market turnover jumped by 20.56%, often a sign of increased institutional positioning, opportunistic profit-taking, or portfolio rebalancing.
- Volume Action: Volume was up in 74 stocks but declined in 64—a split market with heightened activity but downward bias.
🚀 Top Gainers & Losers – Noteworthy Movements
| Symbol | Name | Price(₦) | % Change | RSI | MACD |
|---|---|---|---|---|---|
| NSLTECH | Secure Electronic Tech. | 0.96 | 9.09% | 17.43 | -0.08 |
| VETINDETF | Vetiva Industrial ETF | 48.92 | 8.71% | 11.47 | -3.35 |
| CONHALLPLC | Consolidated Hallmark Ins. | 4.2 | 8.53% | 20.11 | -0.19 |
| JOHNHOLT | John Holt Plc | 6.8 | 7.94% | 6.49 | -0.82 |
| CADBURY | Cadbury Nigeria Plc | 58.00 | 5.45% | 10.25 | -4.84 |
| Symbol | Name | Price(₦) | % Change | RSI | MACD |
|---|---|---|---|---|---|
| DAARCOMM | DAAR Communications | 0.90 | -10.00% | 16.65 | -0.03 |
| LEARNAFRCA | Learn Africa Plc | 7.02 | -10.00% | 16.30 | -0.25 |
| LEGENDINT | Legend Internet | 4.77 | -10.00% | 15.38 | -0.69 |
| MANSARD | Mansard Insurance | 14.39 | -9.95% | 17.21 | -0.47 |
| MERGROWTH | Meristem Growth ETF | 568.00 | -9.84% | 19.62 | -48.39 |
- NSLTECH (Secure Electronic Tech): Continued its impressive run with both a strong daily gain and 39.13% YTD. However, RSI remains very low (17.43), hinting gains may be losing momentum—potential risk of short-term exhaustion.
- DAARCOMM: Unusual volume (+128% vs 90d avg) and big drop suggest heavy institutional exit; RSI at 16.6 implies possible oversold bounce, but caution warranted given YTD loss (-32.35%).
- LEARNAFRCA: Sharp decline with both price and RSI plunging—possible candidates for a short-lived technical bounce if volume persists.
- JOHNHOLT: Both in daily and 5-day top gainers, with unusual volume (+141.8%); momentum may persist if buying continues, but RSI also very low (6.49).
📌 Analysis & Insights: Market Activity & Underlying Signals
- Turnover Surge: A 20.56% jump in turnover with falling prices suggests institutions may be using the higher liquidity to reduce risk exposure or rotate portfolios, amplifying the market’s downward move. Historically, such spikes can precede a short-term relief rally as selling pressure abates.
- Advancers vs Decliners: Bears clearly in control – declining stocks outnumber advancers by over 3:1. Similar action, especially following a turnover spike, may signal further short-term downside unless a reversal in breadth occurs.
-
Unusual Volume Names:
- ARADEL: Volume up 512% vs average, price only down -0.45%. Suggests major accumulation/distribution—and likely institutional positioning—worth a close watch for a volatile breakout or breakdown.
- REDSTAREX, JOHNHOLT, TRANSCOHOT: All posted volume >100% above 90d average, showing heavy speculative or institutional interest, often a precursor to short-term swings.
-
YTD Top Gainers & Losers:
- Top Gainers: NSLTECH, SCOA, SOVRENINS, NCR, AUSTINLAZ all exhibited massive YTD returns, yet nearly all have low-to-mid RSI (6–42). This suggests some cooling off and possible sector rotation. None exhibit classic overbought momentum (i.e., RSI > 70).
- Top Losers: DAARCOMM, AIICO, ELLAHLAKES, PZ, ROYALEX stand out for persistent pressure. Note significant overlap of DAARCOMM across daily losers, YTD losers, and unusual volume—indicates a flush-out scenario, attractive for high-risk contrarian plays.
-
Bullish & Bearish Momentum (15D/50D MA & RSI):
- Bullish Crossovers: Only debt securities (FG202033S6, FGS202890) crossed above 15DMA, showing individual equities continue to lack broad bullish momentum.
- Bearish Crossovers: AFRIPRUD and REDSTAREX both crossed below their 15DMA on price declines, with REDSTAREX also on unusual volume. Additionally, LEARNAFRCA aligns with both top losers and a fresh bearish crossover, reinforcing the risk of continued downside in the near term.
⚖️ Contrarian Signals
- AFRIPRUD: While price broke below the 15DMA (bearish), its dividend yield is a healthy 1.27% and Beta is low (0.64), classically defensive. With RSI at median, this may attract value/dividend bargain hunters even as technicals suggest caution.
- DAARCOMM: Oversold by RSI (16.65), heavy volume flush, severe YTD loser, but may soon present a tactical oversold bounce, especially if positive divergence emerges.
- JOHNHOLT: Rallied hard on high volume despite a single-digit RSI—risk of "lower high" pattern forming, but short covering likely not finished.
🌡️ Sector Heatmaps & Activity
| Sector | Trend | Retail Activity | Institutional Activity |
|---|---|---|---|
| Banking | Down (ZENITHBANK, UBA, GTCO all drop) | High (featured in 3 of top 5 most traded) | High concentration, heavy turnover |
| Insurance | Weak (MANSARD, CONHALLPLC diverge) | Low to moderate | Scattered |
| Diversified Industries | Mixed/Speculative | High (JOHNHOLT volume surge) | Moderate |
| Consumer Goods | Soft (CADBURY, downtrend) | Moderate | Low |
| Debt/ETF | Bullish (FG202033S6, FGS202890 bullish cross) | Low | Moderate |
💡 Dividend-Yield / Beta Matrix: Defensive Screening
| Symbol | Name | Dividend Yield | Beta | Technical Trend |
|---|---|---|---|---|
| AFRIPRUD | Africa Prudential | 1.27% | 0.64 | Bearish (below 15DMA) |
| CAP | CAP Plc | 4.13% | 0.04 | Bearish (below 15DMA) |
| LEARNAFRCA | Learn Africa Plc | 8.53% | 0.03 | Bearish (below 15DMA) |
| REDSTAREX | Red Star Express | 6.12% | 0.21 | Bearish (below 15DMA, unusual vol) |
- Several high-dividend, low-beta names are technically weak, potentially presenting strategic entry points for longer-term, income-focused investors once technicals bottom.
🏢 Institutional Clustering Alerts
- ZENITHBANK: Accounted for 20.17% of institutional trade value share, indicating pronounced institutional interest or distribution at current levels. Similar clustering is seen in UBA, GTCO, and ACCESSCORP, but note heavy selling pressure as all closed down.
- Neutral on sector direction for now; rotation may be setting up for Q4, but vigilance required for late-stage profit-taking.
🕵️ Institutional vs Retail Activity Analysis
- Institutional dominance: 37.8% of trades by count but 65.5% by volume and 89.96% by value. Big block trades, particularly in Banking (ZENITH, UBA, GTCO) and Oil & Gas (ARADEL), drove value.
-
Top 5 Most Traded by Institutions:
- UBA (6.2% of volume), GTCO (7%), ZENITHBANK (3.4%), ACCESSCORP (8.1%), FIDELITYBK (7.9%) — all major banks, all posting negative/dull price action, signal risk-off or potential sector rotation out of banks.
-
Top 5 Most Traded by Retail:
- MTNN, GTCO, UBA, ZENITHBANK, ACCESSCORP — mirror institutional interest, but with less value impact. Indicates that retail and institutional sentiment are closely aligned, possibly compounding momentum in each direction.
- Pattern Insight: Persistent pressure on banking majors amidst high activity is a cautionary sign for short-term traders. For long-term, this may be a "wait-and-see” moment as sector risk is repriced.
📊 YTD Top 5 Gainers & Losers (Table)
| Top 5 YTD Gainers | |||||
|---|---|---|---|---|---|
| Symbol | Name | Price(₦) | %ChgYTD | RSI | DivYield |
| SCOA | SCOA NIG PLC | 6.59 | 219.90% | 14.48 | 3.40% |
| SOVRENINS | Sovereign Trust Insurance | 2.85 | 131.71% | 26.06 | 3.75% |
| NCR | NCR Nigeria PLC | 12.70 | 130.91% | 16.79 | 61.22% |
| NSLTECH | Secure Electronic Tech | 0.88 | 39.13% | 17.43 | 15.87% |
| AUSTINLAZ | Austin Laz & Co | 3.18 | 75.69% | 15.59 | 0.0% |
| Top 5 YTD Losers | |||||
| Symbol | Name | Price(₦) | %ChgYTD | RSI | DivYield |
| AIICO | AIICO Insurance | 3.42 | -21.29% | 21.72 | 4.13% |
| DAARCOMM | DAAR Communications | 1.00 | -32.35% | 16.65 | 0.0% |
| PZ | P Z Cussons Nigeria | 33.25 | -15.99% | 7.96 | 4.59% |
| ROYALEX | Royal Exchange Plc | 1.89 | -14.50% | 24.12 | 7.81% |
| MERGROWTH | Meristem Growth ETF | 630.00 | -13.02% | 19.62 | 0.0% |
💎 Actionable Insights & Trader Suggestions
- Watch for Reversal Plays: Extreme bearish sentiment (low breadth, high volume selling) often sets up for "oversold bounce" candidates; focus on DAARCOMM, LEARNAFRCA, REDSTAREX once price action stabilizes.
- Banking Pressure: Both institutions and retail are actively trading top-tier banks, but price pressure suggests caution—wait for technical turn before scaling in for bounce trades.
- Dividend/Low-Beta Value: Keep an eye on high-yield, low-beta names (e.g., AFRIPRUD, CAP, PZ, AIICO) for potential medium-term defensive entry if technicals bottom out.
- Monitor Unusual Volume Names: Prolonged high volume on ARADEL, JOHNHOLT may precede larger moves—traders can watch for breakouts in either direction following this absorption phase.
- Short-term caution, look for stabilization: Breadth and RSI readings suggest another leg down is possible short-term; nimble traders may try for quick technical bounces rather than new long-term entries.
- Macro Insight: The Naira stabilized, appreciating 0.11% against the Dollar—potentially positive for importers and select consumer stocks.
Summary: Healthy turnover coupled with weak breadth and low RSI levels highlight a tactical bear phase. Income/dividend investors may prepare shopping lists as technicals reach oversold extremes. Traders should stay nimble, leverage bounces in high volume/oversold names, and hold off on aggressive long entries until institutional selling exhausts.
|
Top ASI Gainers Over Last 5 Trading Days
|
Top ASI Losers Over Last 5 Trading Days
|
For more detailed analysis, on InfoWARE Market Data Terminal <NSEPERF> <GO>
On InfoWARE Finance Mobile App (Android, iPhone & iPad, Windows Phone and Windows 8/10), "Top Gainers & Losers"
SECURE ELECTRONIC TECHNOLOGY PLC (NSLTECH) topped the advancers list closing at N0.96 with a gain of 9.09% followed by VETIVA INDUSTRIAL ETF (VETINDETF) which closed at N48.92 with a gain of 8.71%.
On the flip side DAAR COMMUNICATIONS PLC (DAARCOMM) and LEARN AFRICA PLC (LEARNAFRCA) topped the decliners log with a loss of -10.00% at a close of N0.90, and -10.00% to close the day at N7.02 respectively.
| Symbol | LClose | %Chg |
|---|---|---|
| NSLTECH | 0.96 | 9.09 |
| VETINDETF | 48.92 | 8.71 |
| CONHALLPLC | 4.20 | 8.53 |
| JOHNHOLT | 6.80 | 7.94 |
| CADBURY | 58.00 | 5.45 |
| Symbol | LClose | %Chg |
|---|---|---|
| DAARCOMM | 0.90 | -10.00 |
| LEARNAFRCA | 7.02 | -10.00 |
| LEGENDINT | 4.77 | -10.00 |
| MANSARD | 14.39 | -9.95 |
| MERGROWTH | 568.00 | -9.84 |
For more detailed analysis,
- On InfoWARE Market Data Terminal <TOPG> <GO>
- On InfoWARE Finance Mobile App ( Android, iPhone & iPad and Windows 10) , "Top Gainers & Losers"
Currency Market
In the currency market, the Naira appreciated 0.11%(1.70) against the Dollar to settle at 1 to 1NSE: Bull Signal - Price crossed above 15 Day MA
This signal implies these stocks are under buying pressure and the price might continue to rise and therefore positions should be monitored closely. Further suggested analysis include looking at the overall market (ASI) to see if the uptrend is market wide, sector wide or specific to the stock. Portfolio managers tend to use this as a signal to do more research to add to their positions or lock in some profits. Typically further analysis should be done using commands like PC and RV on the InfoWARE Market Data Terminal. Another command is ALERTS to set price triggers for possible exit or entry as necessary
For more detailed analysis,
- On InfoWARE Market Data Terminal <NSEPERF> <GO>
- On InfoWARE Finance Mobile App ( Android , iPhone & iPad and Windows 10) , "Top Gainers & Losers"
| Symbol | Price | %Chg | 15DMA | PE | EPS | DivY | MktCap | Vol | Trades | Value | LstTradeTime |
|---|---|---|---|---|---|---|---|---|---|---|---|
| FG202033S6 | 111.96 | 0.86 | 111.06 | 0.00 | 0.00 | 422.00 | 1.00 | 472.48K | 03-Sep-2025 14:30:20.283 | ||
| FGS202890 | 85.00 | 0.00 | 85.00 | 0.00 | 0.00 | 0.00 | 0.00 | 0.00 | 03-Sep-2025 14:30:21.523 |
NSE: BEAR Signal - Price crossed below 15 Day MA
This signal implies these stocks are under selling pressure and the price might continue to slide and therefore positions should be monitored closely. Further suggested analysis include looking at the overall market (ASI) to see if the downtrend is market wide, sector wide or specific to the stock. If the overal market trend is upwards, then since these stocks are heading in the opposite direction, then further analysis should be done using commands like PC and RV on the InfoWARE Market Data Terminal. Another command is ALERTS to set price triggers for possible exit is necessar
For more detailed analysis,
- On InfoWARE Market Data Terminal <BEARM> <GO>
- On InfoWARE Finance Mobile App ( Android , iPhone & iPad and Windows 10)
| Symbol | Price | %Chg | 15DMA | PE | EPS | DivY | MktCap | Vol | Trades | Value | LstTradeTime |
|---|---|---|---|---|---|---|---|---|---|---|---|
| AFRIPRUD | 15.40 | -3.90 | 15.73 | 19.57 | 0.61 | 1.27 | 30.80B | 2.06M | 153.00 | 31.27M | 03-Sep-2025 14:30:11.330 |
| REDSTAREX | 11.00 | -5.91 | 11.83 | 5.93 | 0.74 | 6.12 | 10.50B | 719.38K | 32.00 | 7.92M | 03-Sep-2025 14:30:16.200 |
| FGSUK2033S6 | 95.00 | -6.89 | 99.40 | 0.00 | 0.00 | 5.00K | 3.00 | 4.75M | 03-Sep-2025 14:30:48.113 | ||
| CAP | 65.00 | -8.00 | 68.79 | 12.92 | 2.90 | 4.13 | 52.96B | 181.32K | 33.00 | 11.71M | 03-Sep-2025 14:30:11.787 |
| LEARNAFRCA | 7.02 | -11.11 | 7.38 | 5.79 | 0.51 | 8.53 | 5.42B | 1.04M | 68.00 | 7.47M | 03-Sep-2025 14:30:14.397 |
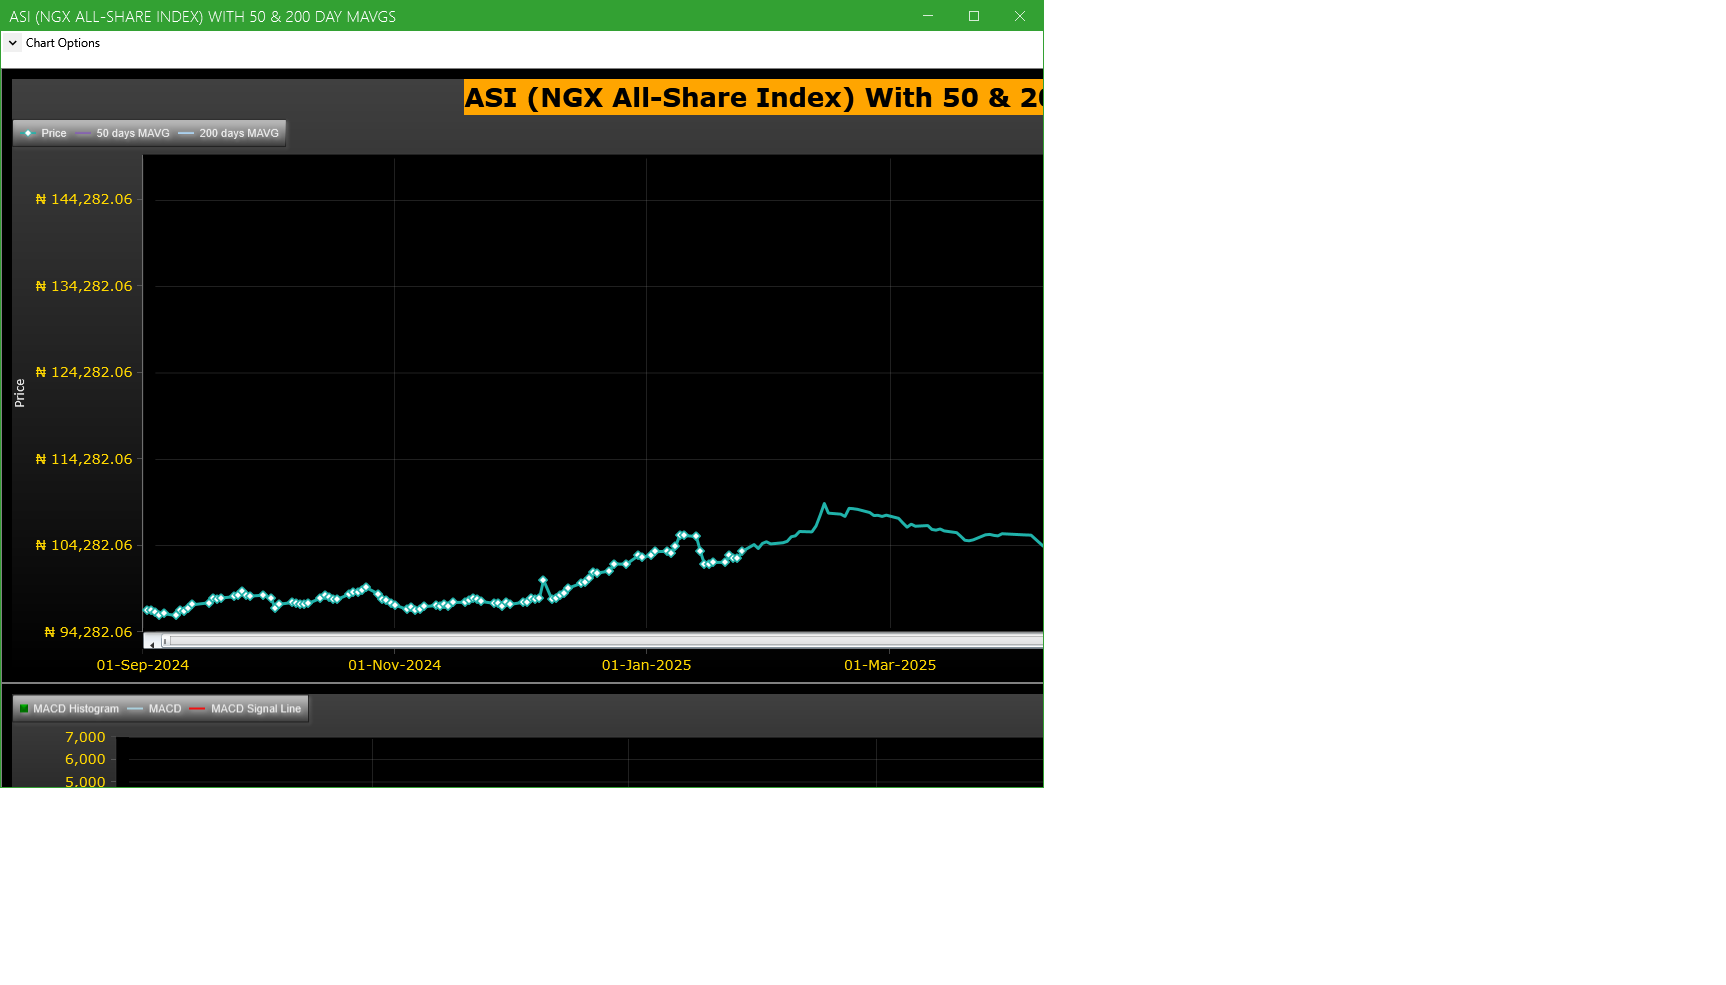
Market Trend - ASI (NGX All-Share-Index) With 50 & 200 Day MAvgs Chart
Technical traders typically use the 50 & 200 day moving averages to aid in choosing
where to enter or exit a position, which then causes these levels to act as strong
support or resistance. As a general guideline, if the price is above a moving average,
the trend is up. If the price is below a moving average, the trend is down.
It is important to note that critics of technical analysis say that moving averages act
as support and resistance because so many traders use these indicators to inform their
trading decisions. Also moving averages tend to work quite well in strong trending conditions
but poorly in choppy or ranging conditions.
Trading Strategies: Crossovers
Crossovers are one of the main moving average strategies. The first type is a price crossover,
which is when the price crosses above or below a moving average to signal a potential change
in trend. Another strategy is to apply two moving averages to a chart: one longer and one
shorter. When the shorter-term MA crosses above the longer-term MA, it is a buy signal, as
it indicates that the trend is shifting up. This is known as a golden cross. Meanwhile, when
the shorter-term MA crosses below the longer-term MA, it is a sell signal, as it indicates that
the trend is shifting down. This is known as a dead/death cross
For more detailed analysis,
- On InfoWARE Market Data Terminal <CI> <GO>
- On InfoWARE Finance Mobile App ( Android , iPhone & iPad and Windows 10) , "Research"
Unusual Volume: Volume traded is more than double the 90 day moving average (All exchanges; ASI & ASem). For more detailed analysis,
- On InfoWARE Market Data Terminal <UV> <GO>
- On InfoWARE Finance Mobile App ( Android , iPhone & iPad and Windows 10)
| Symbol | Name | Volume | 90DAvgVol | %VolChg | Price | LClose | %Chg | Trades | Value |
|---|---|---|---|---|---|---|---|---|---|
| DAARCOMM | DAAR COMMUNICATIONS PLC | 15.10M | 6.61M | 128.45 | 0.90 | 1.00 | -10.00 | 119 | 13.76M |
| ARADEL | ARADEL HOLDINGS PLC | 12.45M | 2.03M | 511.68 | 511.20 | 513.50 | -0.45 | 387 | 6.46B |
| REDSTAREX | RED STAR EXPRESS PLC | 719.38K | 311.96K | 130.60 | 11.00 | 11.65 | -5.58 | 32 | 7.92M |
| JOHNHOLT | JOHN HOLT PLC. | 705.94K | 291.89K | 141.85 | 6.80 | 6.30 | 7.94 | 71 | 4.68M |
| TRANSCOHOT | TRANSCORP HOTELS PLC | 271.17K | 90.33K | 200.22 | 164.60 | 164.60 | 0.00 | 93 | 40.52M |
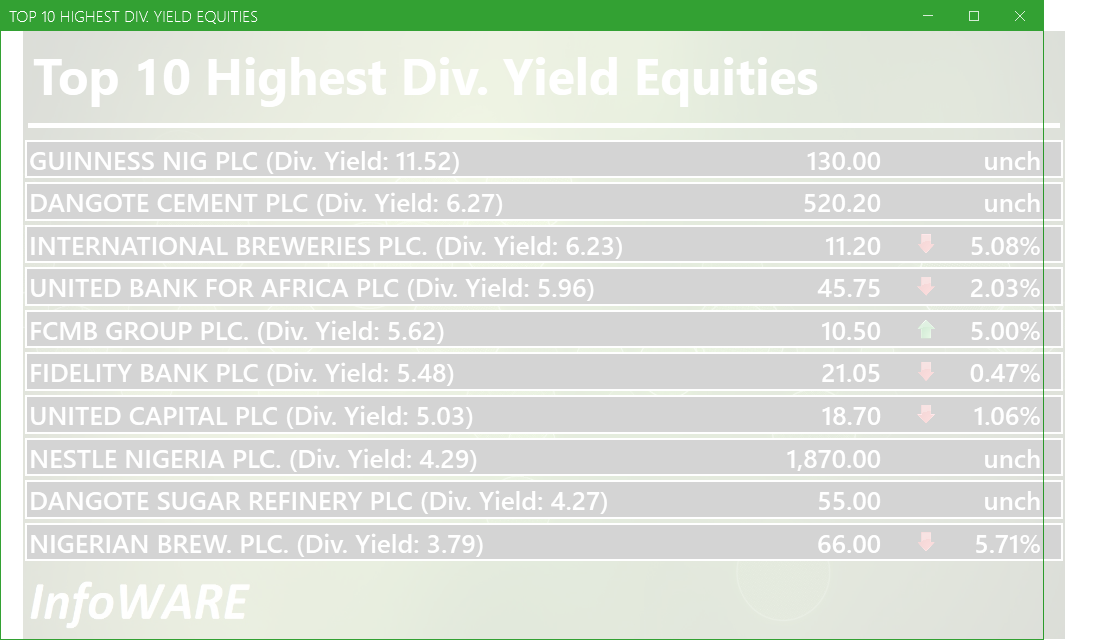
Investment Insights - High Div. Stocks
Dividend stocks distribute a portion of the company earnings to investors on a regular basis and they can a great choice for investors looking for regular income. As an investment or trading strategy, high dividend yield equities provide annual cash payments as against mostly capital gains in the price of a stock. The list in the table below represent the highest dividend paying stocks from the list of the most liquid stocks in the NSE top 30.
For more detailed analysis,
- On InfoWARE Market Data Terminal <HYIELD> <GO>
- On InfoWARE Finance Mobile App ( Android , iPhone & iPad and Windows 10) , "Research"
Investment Insights - Stocks outperforming the ASI but with approximately the same risk
These list of stocks represent equities that are less risky than the ASI but doing better than the ASI (All Shares Index) using the YTD (Year to Date) returns as the measure. The risk is measured by Beta. Beta is an assessment of a stock's tendency to undergo price changes, (its volatility), as well as its potential returns compared to the ASI. It is expressed as a ratio, where a score of 1 represents performance comparable to the ASI, and returns above or below the market may receive scores greater or lower than 1.
For a full list of both positively and negatively corelated stocks visit InfoWARE Market Data Terminal
- On InfoWARE Market Data Terminal <BANL> <GO>
- On InfoWARE Finance Mobile App ( Android , iPhone & iPad and Windows 10)
| Symbol | DivYield | PE | EPS | Beta | %ChgYTD | ASIYTDReturn | BetaDiff |
|---|---|---|---|---|---|---|---|
| HONYFLOUR | 1.40 | 16.28 | 0.31 | 0.99 | 204.91 | 33.90 | 0.01 |
| CAVERTON | 5.52 | 1.15 | 1.57 | 0.98 | 139.22 | 33.90 | 0.02 |
| ROYALEX | 7.81 | 0.00 | 0.00 | 0.96 | 55.45 | 33.90 | 0.04 |
| CORNERST | 5.28 | 8.62 | 0.35 | 0.93 | 65.40 | 33.90 | 0.07 |
| DEAPCAP | 13.76 | 188.84 | 0.01 | 0.89 | 40.00 | 33.90 | 0.11 |
| UNIVINSURE | 0.00 | 0.00 | 0.00 | 0.83 | 56.94 | 33.90 | 0.17 |
| FTNCOCOA | 1.60 | 0.00 | 0.00 | 0.79 | 210.11 | 33.90 | 0.21 |
| NB | 3.79 | 16.95 | 1.60 | 0.79 | 106.25 | 33.90 | 0.21 |
| MAYBAKER | 3.75 | 58.94 | 0.14 | 0.78 | 92.02 | 33.90 | 0.22 |
| UNILEVER | 2.81 | 67.09 | 0.40 | 0.75 | 102.78 | 33.90 | 0.25 |
African Markets
| Name | LClose | Change | %Chg |
|---|---|---|---|
| BRVM Stock Exchange | 319.27 | -0.19 | -0.06 |
| Botswana Stock Exchange | 10,566.38 | 6.34 | 0.06 |
| Egyptian Exchange | 35,156.93 | -3.52 | -0.01 |
| Ghana Stock Exchange | 7,310.17 | -20.53 | -0.28 |
| Lusaka Stock Exchange | 24,366.58 | -100.31 | -0.41 |
| Casablanca Stock Exchange | 20,118.53 | 46.17 | 0.23 |
| Malawi Stock Exchange | 537,219.89 | 1,980.39 | 0.37 |
| Nigeria Stock Exchange | 138,737.64 | -978.01 | -0.70 |
| Nairobi Securities Exchange | 175.21 | 1.56 | 0.90 |
| Rwanda Stock Exchange | 178.88 | 0.00 | 0.00 |
| Uganda Securities Exchange | 1,436.63 | -2.73 | -0.19 |
Nigeria Market Indexes
| Symbol | LClose | %Chg | WTD% | MTD% | QTD% | YTD% | MktCap | Trades |
|---|---|---|---|---|---|---|---|---|
| ASI | 138,157.14 | -0.42 | -1.12 | -1.12 | 15.38 | 33.90 | 26,685 | |
| NGX30 | 5,045.48 | -0.33 | -1.01 | -1.01 | 6.81 | 32.26 | 14,683 | |
| NGXAFRBVI | 3,431.48 | -1.19 | -1.55 | -1.55 | -3.16 | 38.32 | 6,488 | |
| NGXAFRHDYI | 22,227.05 | -0.68 | -1.35 | -1.35 | 6.28 | 30.54 | 7,222 | |
| NGXASEM | 1,538.10 | 0.00 | 0.00 | 0.00 | -3.57 | -2.88 | 10 | |
| NGXBNK | 1,490.76 | -0.55 | -1.37 | -1.37 | -1.33 | 37.09 | 6,658 | |
| NGXCG | 3,975.62 | -0.90 | -1.46 | -1.46 | 15.61 | 40.52 | 14,929 | |
| NGXCNSMRGDS | 3,105.06 | -1.32 | -2.65 | -2.65 | -10.48 | 79.03 | 3,115 | |
| NGXCOMMDTY | 1,067.29 | -0.08 | -0.07 | -0.07 | 1.91 | 6.73 | ||
| NGXGROWTH | 11,191.92 | 0.19 | -0.07 | -0.07 | 17.69 | 44.17 | 193 | |
| NGXINDUSTR | 4,871.00 | 0.23 | -1.25 | -1.25 | 38.27 | 36.38 | 2,326 | |
| NGXINS | 1,198.30 | -4.46 | -6.60 | -6.60 | 62.24 | 52.42 | 2,317 | |
| NGXLOTUSISLM | 11,274.46 | 0.05 | -1.27 | -1.27 | 17.75 | 61.81 | 4,851 | |
| NGXMAINBOARD | 6,703.61 | -0.55 | -1.23 | -1.23 | 13.64 | 33.97 | 18,865 | |
| NGXMERIGRW | 9,823.71 | 1.12 | -1.90 | -1.90 | 1.78 | 50.60 | 3,232 | |
| NGXMERIVAL | 13,137.55 | -0.85 | -1.74 | -1.74 | 9.96 | 25.95 | 7,814 | |
| NGXOILGAS | 2,362.44 | -0.44 | -0.35 | -0.35 | -1.24 | -12.86 | 398 | |
| NGXPENBRD | 2,568.46 | -0.28 | -0.84 | -0.84 | 11.70 | 40.23 | 21,905 | |
| NGXPENSION | 6,553.71 | -0.54 | -1.00 | -1.00 | 3.13 | 44.55 | 16,884 | |
| NGXPREMIUM | 13,640.67 | -0.16 | -0.88 | -0.88 | 18.93 | 40.15 | 7,627 | |
| NGXSOVBND | 659.23 | 0.10 | 0.05 | 0.05 | 0.88 | 9.59 | 0 |
For more detailed analysis,
- On InfoWARE Market Data Terminal <MKTINS> <GO>
- On InfoWARE Finance Mobile App ( Android, iPhone & iPad and Windows 10) , "Market Indexes"
Find the topic interesting? Will like to comment? Contact Us at solutions@infowarelimited.com
Top News

Chart Of The Day - ASI Chart Vs ASI Advance Decline Line (YTD) (03-Sep-2025 15:07:49.802)
InfoWARE AI Analyst Daily Market Report: 03-Sep-2025

[MERGROWTH]>> DAILY INDICATIVE PRICES
[SIAMLETF40]>> DAILY INDICATIVE PRICES
[VSPBONDETF]>> DAILY INDICATIVE PRICES
[XNSA]>> CORDROS MILESTONE FUNDS' BID & OFFER PRICES
[XNSA]>> NGX FIXED INCOME INDICATIVE PRICE LIST FOR SEP 03, 2025
[XNSA]>> CLOSING GONG CEREMONY AND FACTS BEHIND THE FIGURES BY DANGOTE CEMENT
[XNSA]>> LIFTING OF SUSPENSION - UNIVERSAL INSURANCE PLC
[XNSA]>> REGISTRATION FOR BATCH TWO- 2025 DEALING CLERKSHIP CERTIFICATION PROGRA
[XNSA]>> UPDATED- SAVE THE DATE: 29TH ANNUAL STOCKBROKERS CONFERENCE
[XNSA]>> NOTIFICATION OF PRICE ADJUSTMENT
[XNSA]>> FGN SAVINGS BOND OFFER SEPTEMBER 2025
Chart Of The Day - ASI Chart Vs ASI Advance Decline Line (YTD) (02-Sep-2025 16:57:57.009)
InfoWARE Analyst Daily Market Report (02-Sep-2025 16:57:52.407)
[XNSA]>> OFF MARKET TRADE
[MERGROWTH]>> DAILY INDICATIVE PRICES
[VETINDETF]>> DAILY INDICATIVE PRICES
[XNSA]>> NGX FIXED INCOME INDICATIVE PRICE LIST FOR SEP 02, 2025
[XNSA]>> CORDROS MILESTONE FUNDS' BID & OFFER PRICES
[XNSA]>> REGISTRATION FOR BATCH TWO- 2025 DEALING CLERKSHIP CERTIFICATION PROGRA
[XNSA]>> UPDATED- SAVE THE DATE: 29TH ANNUAL STOCKBROKERS CONFERENCE
[SIAMLETF40]>> DAILY INDICATIVE PRICES
Chart Of The Day - ASI Chart Vs ASI Advance Decline Line (YTD) (01-Sep-2025 15:08:17.063)
InfoWARE AI Analyst Daily Market Report: 01-Sep-2025
[XNSA]>> EMERGING AFRICA DAILY MUTUAL FUND PRICES
SUSPENSION OF THREE (3) LISTED COMPANIES
[VETBANK]>> DAILY INDICATIVE PRICES
[XNSA]>> CORDROS MILESTONE FUNDS' BID & OFFER PRICES
[XNSA]>> NGX FIXED INCOME INDICATIVE PRICE LIST FOR SEP 01, 2025
Get IDIA - the stock trading app for the modern investor
Solutions by Business
Product Suites
Company
Contacts
- 8th Floor,
- South Atlantic Petroleum Towers,
- 1 Adeola Odeku Street,
- Victoria Island,
- Lagos, Nigeria.
- Email: solutions@infowarelimited.com
Follow Us
 |
 |
 |
 |