


InfoWARE AI Analyst Daily Market Report: 01-Sep-2025 | InfoWARE Finance
Get IDIA - the stock trading app for the modern investor


InfoWARE AI Analyst Daily Market Report: 01-Sep-2025
(Source: InfoWARE Terminal, Date: 01-Sep-2025)
Dear Investor,
NGX Daily Market Summary: Monday, September 1, 2025
The NGX All Share Index (ASI) dipped by -0.41% today, settling at 140,295.50. This marks a mild retracement from recent highs, yet the YTD return remains an impressive 35.42%. Market turnover saw a modest uptick of +1.13%, totaling 9.09B Naira, even as breadth weakened with only 17 advancers against 39 decliners (breadth ratio: 0.44x). Trading activity was brisk, with total volume rising to 374.55M shares. Notably, some stocks posted significant price moves and extraordinary volume—a sign of heightened investor sentiment despite broader caution. The Naira appreciated slightly, climbing 0.07% to ₦1,535/$1.
🔍 Significant Market Breadth & Trends
- Market Breadth: Just 17 advancers vs. 39 decliners—risk appetite is selective despite broader liquidity and higher turnover.
- Volume Rotation: Volume was higher for 64 stocks but down for 75; this suggests more concentration in select high-momentum or speculative names.
- Turnover Up Yet Winners Fewer: Rising turnover (+1.13%) paired with negative breadth—liquidity is supporting profit-taking or repositioning as opposed to sustained upside.
- ETF Volatility: Notice today’s top moves came from ETFs (e.g., VETGRIF30, VSPBONDETF, STANBICETF30), which can signify portfolio adjustments or asset-allocation shifts by institutions.
🏆 Top Daily Gainers & Losers
| Symbol | Name | %Change | RSI | MACD | 15DMA/50DMA |
|---|---|---|---|---|---|
| SOVRENINS | SOVEREIGN TRUST INSURANCE PLC | +10.00% | 53.28 | 0.21 | 15DMA (> 50DMA) |
| VETGRIF30 | VETIVA GRIFFIN 30 ETF | +10.00% | 50.85 | 0.94 | 15DMA (> 50DMA) |
| SCOA | S C O A NIG. PLC. | +9.83% | 90.11 (overbought!) | 0.17 | Bullish crossover |
| CORNERST | CORNERSTONE INSURANCE CO. | +7.98% | 51.71 | 0.43 | - |
| GUINEAINS | GUINEA INSURANCE PLC. | +7.75% | 51.44 | 0.14 | - |
| Symbol | Name | %Change | RSI | MACD | 15DMA/50DMA |
|---|---|---|---|---|---|
| VSPBONDETF | VETIVA S & P NIGERIA SOV. BOND ETF | -15.07% | 48.08 | -26.25 | Below 15DMA |
| STANBICETF30 | STANBIC IBTC ETF 30 | -10.00% | 41.64 | -14.93 | Below 15DMA |
| ELLAHLAKES | ELLAH LAKES PLC. | -10.00% | 53.34 | 1.13 | - |
| ETERNA | ETERNA PLC. | -10.00% | 18.40 | -0.75 | Below 15DMA |
| VERITASKAP | VERITAS KAP ASSURANCE PLC | -10.00% | 56.33 | 0.18 | - |
Notable Gainers: SCOA continues dramatic momentum (RSI 90.1, up 219.9% YTD), strong bull signal. SOVRENINS up 10% with 120% YTD gain. VETGRIF30 ETF is both today's top gainer and a recent YTD outperformer.
Notable Losers: ETERNA plunged 10.00%, with an RSI 18.4 (deeply oversold). VSPBONDETF shed 15.07% (biggest faller, extreme MACD), confirming heavy institutional pressure.
📰 Momentum Insights & Patterns
-
Bullish Momentum: SCOA, SOVRENINS, and VETGRIF30 all show price above 15DMA and strong RSI readings. SCOA’s RSI at 90.1 signals potential for exhaustion/overbought—traders should watch for pullbacks or reversals soon.
(Sparkline: SCOA: 15DMA ↑ 50DMA) - Bearish Momentum: ETERNA stands out with RSI 18.4 and further slide below its 15DMA, indicating heavy selling and possible short-term bottoming soon. VSPBONDETF's sustained drop flags sustained capital flight from bonds/defensives.
-
YTD Top Gainers Shine: SCOA (219.9% YTD), SOVRENINS (120%), LEARNAFRCA, and NEM remain on a roll, but caution is warranted with overbought signals.
Several daily winners also appear in the 5-day and YTD charts: classic trend-following opportunity, but RSI over-extensions warrant trailing stops. - YTD Top Losers Pressure: ELLAHLAKES (-321.6% YTD), VSPBONDETF (-39.7%)—continually weak, avoid unless contrarian rebound signs emerge.
-
Unusual Volume:
- SCOA traded over 6.4x its average volume (+544% surprise), with price momentum intact—likely speculative activity or position accumulation.
- ARADEL and NSLTECH also had massive volume spikes (>4x, >2x average), portending further price action or news flows soon.
🔔 Contrarian Signals: Watch These Paradoxical Setups
- VETGRIF30 ETF: Gained 10%, MACD positive, price above 15DMA—but RSI only ~51 (neutral)—rally could exhaust soon without stronger momentum.
- ELLAHLAKES: Both in today's losers (-10%) and YTD top losers (-321.6%), yet RSI at 53 (neutral/holding), with a positive MACD—bear capitulation could spark a squeeze.
- CHAMS: Only modestly oversold (RSI 53.4), but deep in YTD losers and trading below 15DMA. A bounce is possible after further washouts.
- ETERNA: Extremely oversold (RSI 18.4), significant YTD losses—contrarian traders often look for a temporary dead-cat bounce here.
🌐 Sector & Technical Heatmap
| Sector | Top Performer(s) | % Change | Leading Stock RSI | 15DMA vs 50DMA | Momentum |
|---|---|---|---|---|---|
| Diversified Industries | SCOA | +9.83% | 90.11 | Above (bullish) | Bullish |
| ETFs | VETGRIF30 VSPBONDETF |
+10.0% / -15.1% | 50.85 / 48.08 | Mixed | Volatile |
| Insurance | SOVRENINS CORNERST GUINEAINS |
+10.0% / +7.98% / +7.75% | 53.28 / 51.71 / 51.44 | Above | Bullish |
| Banking | UBA, ZENITHBANK (see trade flow) |
-2 to -3% | ~40-46 | Below | Weak/Bearish |
| Oil & Gas | ETERNA | -10.00% | 18.40 | Below | Severely Bearish |
📈 Dividend–Beta Matrix: Defensive Screen
| Stock | Dividend Yield | Beta | Risk Narrative |
|---|---|---|---|
| NASCON | 3.09% | 1.24 | High yield, slightly above-market risk; attractive for income but volatile. |
| UCAP | 5.03% | 0.74 | Attractive payout with low Beta; suitable for defensive yield seekers. |
| DEAPCAP | 13.76% | 0.89 | Exceptional yield, moderate risk—caution: technical trend is currently bearish. |
| UBA | 5.96% | 1.56 | Top-tier bank with strong dividend but higher Beta. |
| AFRIPRUD* | 1.27% | 0.64 | Defensive with stability—lower Beta, modest yield. |
🏦 Institutional Clustering Alerts
- ZENITHBANK: Institutional investors own 20.17% of the trade value share today—likely core repositioning; tight liquidity could spark price breakouts (up or down).
- WAPCO, ACCESSCORP, UBA, GTCO: Strong institutional activity (trade value dominance in these names) correlates with volume and leaders in the banking/financial sector.
- ETF Concentration: Multiple ETFs traded with volatility, probably driven by large portfolio reallocations.
💡 High Dividend Yield in Bull/Bear Tables
- DEAPCAP (13.76% yield): Bearish momentum, price fell below 15DMA. Yield chasers risk capital loss if negative price trend persists—wait for stability before entry.
- UCAP (5.03% yield): Also bearish (price below 15DMA). Defensive income only if technicals stabilize.
- NASCON (3.09% yield): Appears in bullish momentum (price above 15DMA), offering both yield and upward technical bias; defensive/income portfolios may consider nibbling.
- UBA (5.96% yield): Healthy dividend, but near-term momentum is bearish—collect dividends with caution.
🚦 Trading Opportunities & Cautions
- SCOA: Still trending up with massive volume; overbought RSI demands tight stop-losses—good for short-term trade, risky to chase here.
- ETERNA: Deeply oversold; bottom-fishing possible with tight risk controls—watch for reversal; avoid unless daily reversal bar appears.
- ETFs: Given concentrated trade, volatility is likely to persist in the next sessions—short-term tactical traders can exploit swings.
- Unusual Volume Candidates: Watch ARADEL, NSLTECH—gains may accelerate if volumes sustain, but monitor for news triggers.
- Yield Stocks with Caution: Many high-yielders (UCAP, DEAPCAP) trend bearish; don't buy for yield alone—wait for a technical floor.
📊 Tuesday/Wednesday YTD Top Gainers & Losers
Today's Top Year-To-Date Gainers:| Symbol | Name | Price | YTD %Chg | RSI |
|---|---|---|---|---|
| SCOA | S C O A NIG. PLC. | 6.00 | 219.90% | 90.11 |
| SOVRENINS | SOVEREIGN TRUST INS. | 2.60 | 120.00% | 53.28 |
| NEM | N.E.M INSURANCE CO | 31.20 | 160.00% | 60.37 |
| LEARNAFRCA | LEARN AFRICA PLC | 7.80 | 54.76% | 73.33 |
| UNIONDICON | UNION DICON SALT | 12.10 | 65.75% | 68.06 |
| Symbol | Name | Price | YTD %Chg | RSI |
|---|---|---|---|---|
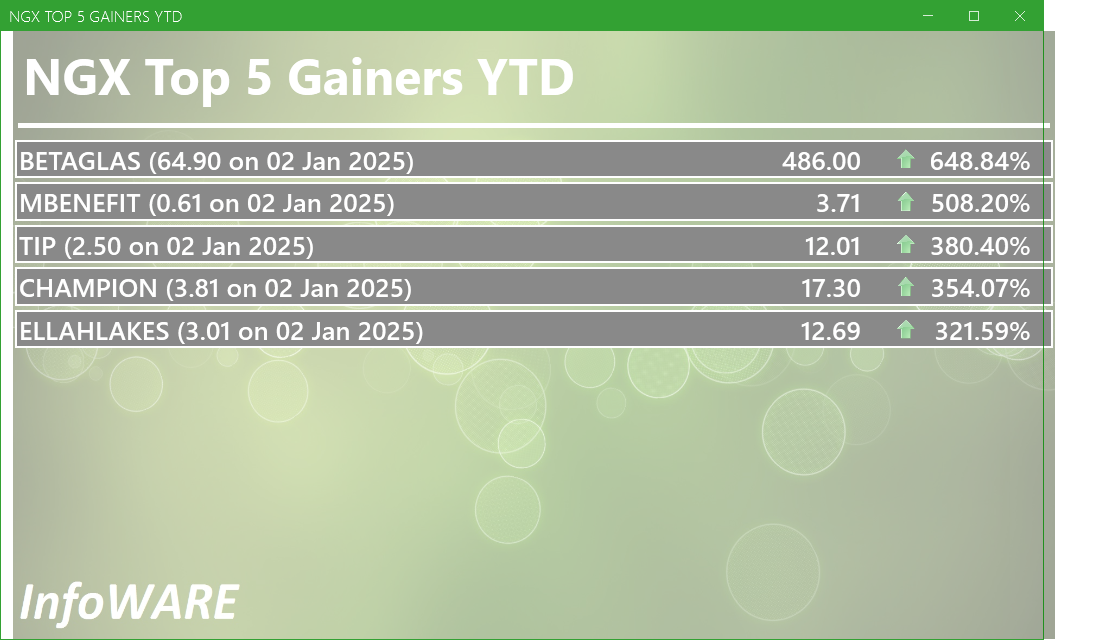
| ELLAHLAKES | ELLAH LAKES PLC. | 14.10 | -321.59% | 53.34 |
| VSPBONDETF | VETIVA S&P NIG.SO.BOND ETF | 248.57 | -39.68% | 48.08 |
| OANDO | OANDO PLC | 51.20 | -27.05% | 46.66 |
| JOHNHOLT | JOHN HOLT PLC | 6.30 | -19.13% | 27.69 |
| ETERNA | ETERNA PLC. | 38.00 | 40.74% | 18.40 |
🗓️ Last Week’s Market Recap
Last week saw the NGX ASI consolidating near new all-time highs, with a five-day churn as traders digested profit-taking and rotated into select industrials and insurers. Key outperformers included SCOA, NEM, and LEARNAFRCA. However, breadth began softening late week—setting the stage for today’s mixed, rotation-heavy session.
🧮 Market Activity Trends & Trade Flows
- Retail vs. Institutional:
- Institutional investors accounted for only 1,710 trades (36%) but captured a dominant 56.51% of volume and 85.52% of value; Retail traders executed most trades (64% by count), but just 14.48% of total value. Implication: Big-money flows dictate price even as retail provides liquidity.
- Top 5 Most Traded Symbols—Institutional Investors:
- ZENITHBANK (20.17% trade value)—Heavyweights favor large banks for reallocation. Despite negative price moves, high-value institutional activity suggests positioning for medium-term recovery or pre-dividend accumulation.
- WAPCO, ACCESSCORP, UBA, GTCO—All major banks/fins, reflecting a sector-wide shift or hedging. All had declining prices today—potential mean reversion candidates.
- Top 5 Most Traded Symbols—Retail Investors:
- ZENITHBANK, GTCO, ACCESSCORP, MTNN, UBA—Retail trading mirrors institutional focus on tier-1 banks and signals herd-following or "chase the flow” tactics.
- Retail/Institutional overlap conveys broad-based market focus—expect volatility clusters in these names.
- Stocks with largest % volume surprise (SCOA, NSLTECH, ARADEL) do not overlap with these top volume names—speculative traders focusing on these may be early to news or event moves.
- Hidden Insight: When institutions dominate value traded and focus on sector leaders while high-volume anomalies arise elsewhere (SCOA, ARADEL), it’s often a sign of sector rotation and hot money flows—Expect short-term trend reversals in highly traded banks but speculative runs in volume outliers.
🚩 Hidden Insights & Takeaways
- Momentum Outliers: Both multi-week gainers and high-volume names show excessive readings—mean reversion risk increases. Don't chase parabolic moves without stops.
- ETFs as Liquidity Tools: Massive swings in ETFs signal strategic allocation; could foretell coming sector shifts—track theme-following stocks accordingly.
- Defensive Stocks: Yield and low Beta (e.g., UCAP, AFRIPRUD) remain useful hedges if volatility rises—watch for stabilization in bearish momentum names.
- Contrarian Opportunities: Deeply oversold stocks (ETERNA, VSPBONDETF) may be prepping for bounce. Risk-tolerant traders can scout short-term mean reversion setups pending confirmation.
- Retail vs. Institutional: Retail crowd is following institutions; unusual volume stocks are ideal hunting ground for nimble traders ahead of crowds.
💡 Suggestions for Traders
- Use bounce strategies on severely oversold names (RSI < 20) only after reversal confirmation (e.g., ETERNA).
- For hot momentum plays (like SCOA), trail stops to protect profits, don’t get greedy.
- Monitor ETFs for direction—they’re driving flows.
- Cautious entry recommended on yield stocks currently below 15DMA, wait for stabilization if entering for dividends.
- Watch for sector rotations out of large caps (banks) into high-volatility speculative plays. Move fast if joining such rotations.
- Keep an eye on abnormal volume spikes—they often precede news-driven moves or breakout attempts.
🚀 Fast Recap
The market showed classic rotation: institutions dominate value, ETFs and banks lead turnover, and speculative fever surges in select gainers. But the breadth remains soft despite the liquidity—a sign the bull leg may be pausing. Stay nimble, guard profits, look for re-entry on oversold bounces or sector rotation setups.
|
Top ASI Gainers Over Last 5 Trading Days
|
Top ASI Losers Over Last 5 Trading Days
|
For more detailed analysis, on InfoWARE Market Data Terminal <NSEPERF> <GO>
On InfoWARE Finance Mobile App (Android, iPhone & iPad, Windows Phone and Windows 8/10), "Top Gainers & Losers"
SOVEREIGN TRUST INSURANCE PLC (SOVRENINS) topped the advancers list closing at N2.86 with a gain of 10.00% followed by VETIVA GRIFFIN 30 ETF (VETGRIF30) which closed at N56.10 with a gain of 10.00%.
On the flip side VETIVA S & P NIGERIA SOVEREIGN BOND ETF (VSPBONDETF) and VERITAS KAPITAL ASSURANCE PLC (VERITASKAP) topped the decliners log with a loss of -15.07% at a close of N211.11, and -10.00% to close the day at N1.89 respectively.
| Symbol | LClose | %Chg |
|---|---|---|
| SOVRENINS | 2.86 | 10.00 |
| VETGRIF30 | 56.10 | 10.00 |
| SCOA | 6.59 | 9.83 |
| CORNERST | 6.90 | 7.98 |
| GUINEAINS | 1.53 | 7.75 |
| Symbol | LClose | %Chg |
|---|---|---|
| VSPBONDETF | 211.11 | -15.07 |
| VERITASKAP | 1.89 | -10.00 |
| STANBICETF30 | 378.00 | -10.00 |
| ELLAHLAKES | 12.69 | -10.00 |
| ETERNA | 34.20 | -10.00 |
For more detailed analysis,
- On InfoWARE Market Data Terminal <TOPG> <GO>
- On InfoWARE Finance Mobile App ( Android, iPhone & iPad and Windows 10) , "Top Gainers & Losers"
Currency Market
In the currency market, the Naira appreciated 0.07%(1.08) against the Dollar to settle at 1 to 1Investment Insights - Top 5 Gainers YTD
These stocks are the best performers whose price has risen faster than the market as a whole with the best returns year to date. Momentum investors believe that stocks that have outperformed the market will often continue to do so because the factors that caused them to outperform will not suddenly disappear. In addition, other investors seeking to benefit from the stock’s outperformance will often purchase the stock, further bidding its price higher and pushing the stock higher still
For more detailed analysis,
- On InfoWARE Market Data Terminal <T5YTD2> <GO>
- On InfoWARE Finance Mobile App ( Android , iPhone & iPad and Windows 10) , "Research"
NSE: Bull Signal - Price crossed above 15 Day MA
This signal implies these stocks are under buying pressure and the price might continue to rise and therefore positions should be monitored closely. Further suggested analysis include looking at the overall market (ASI) to see if the uptrend is market wide, sector wide or specific to the stock. Portfolio managers tend to use this as a signal to do more research to add to their positions or lock in some profits. Typically further analysis should be done using commands like PC and RV on the InfoWARE Market Data Terminal. Another command is ALERTS to set price triggers for possible exit or entry as necessary
For more detailed analysis,
- On InfoWARE Market Data Terminal <NSEPERF> <GO>
- On InfoWARE Finance Mobile App ( Android , iPhone & iPad and Windows 10) , "Top Gainers & Losers"
NSE: BEAR Signal - Price crossed below 15 Day MA
This signal implies these stocks are under selling pressure and the price might continue to slide and therefore positions should be monitored closely. Further suggested analysis include looking at the overall market (ASI) to see if the downtrend is market wide, sector wide or specific to the stock. If the overal market trend is upwards, then since these stocks are heading in the opposite direction, then further analysis should be done using commands like PC and RV on the InfoWARE Market Data Terminal. Another command is ALERTS to set price triggers for possible exit is necessar
For more detailed analysis,
- On InfoWARE Market Data Terminal <BEARM> <GO>
- On InfoWARE Finance Mobile App ( Android , iPhone & iPad and Windows 10)
| Symbol | Price | %Chg | 15DMA | PE | EPS | DivY | MktCap | Vol | Trades | Value | LstTradeTime |
|---|---|---|---|---|---|---|---|---|---|---|---|
| NGXGROWTH | 11,200.10 | 0.00 | 11,228.81 | 18.83 | 0.18 | 0.00 | 0.00 | 1.26M | 271.00 | 12.48M | 01-Sep-2025 14:30:17.180 |
| UCAP | 18.95 | -1.85 | 19.22 | 19.15 | 0.93 | 5.03 | 113.70B | 3.62M | 325.00 | 68.89M | 01-Sep-2025 14:30:13.490 |
| UBA | 47.25 | -2.96 | 48.23 | 8.29 | 4.05 | 5.96 | 1,615.92B | 11.89M | 1,614.00 | 571.14M | 01-Sep-2025 14:30:31.717 |
| FGSUK2033S6 | 95.00 | -5.24 | 99.43 | 0.00 | 0.00 | 5.00K | 2.00 | 4.75M | 01-Sep-2025 14:30:32.787 | ||
| DEAPCAP | 1.71 | -5.85 | 1.72 | 188.84 | 0.01 | 13.76 | 2.57B | 6.32M | 92.00 | 10.79M | 01-Sep-2025 14:30:29.550 |
| CHAMS | 2.65 | -10.57 | 2.80 | 27.02 | 0.07 | 1.56 | 12.44B | 5.48M | 378.00 | 15.75M | 01-Sep-2025 14:30:29.540 |
| VSPBONDETF | 211.11 | -17.74 | 226.42 | 0.00 | 0.00 | 1.12K | 12.00 | 310.40K | 01-Sep-2025 14:30:30.050 |
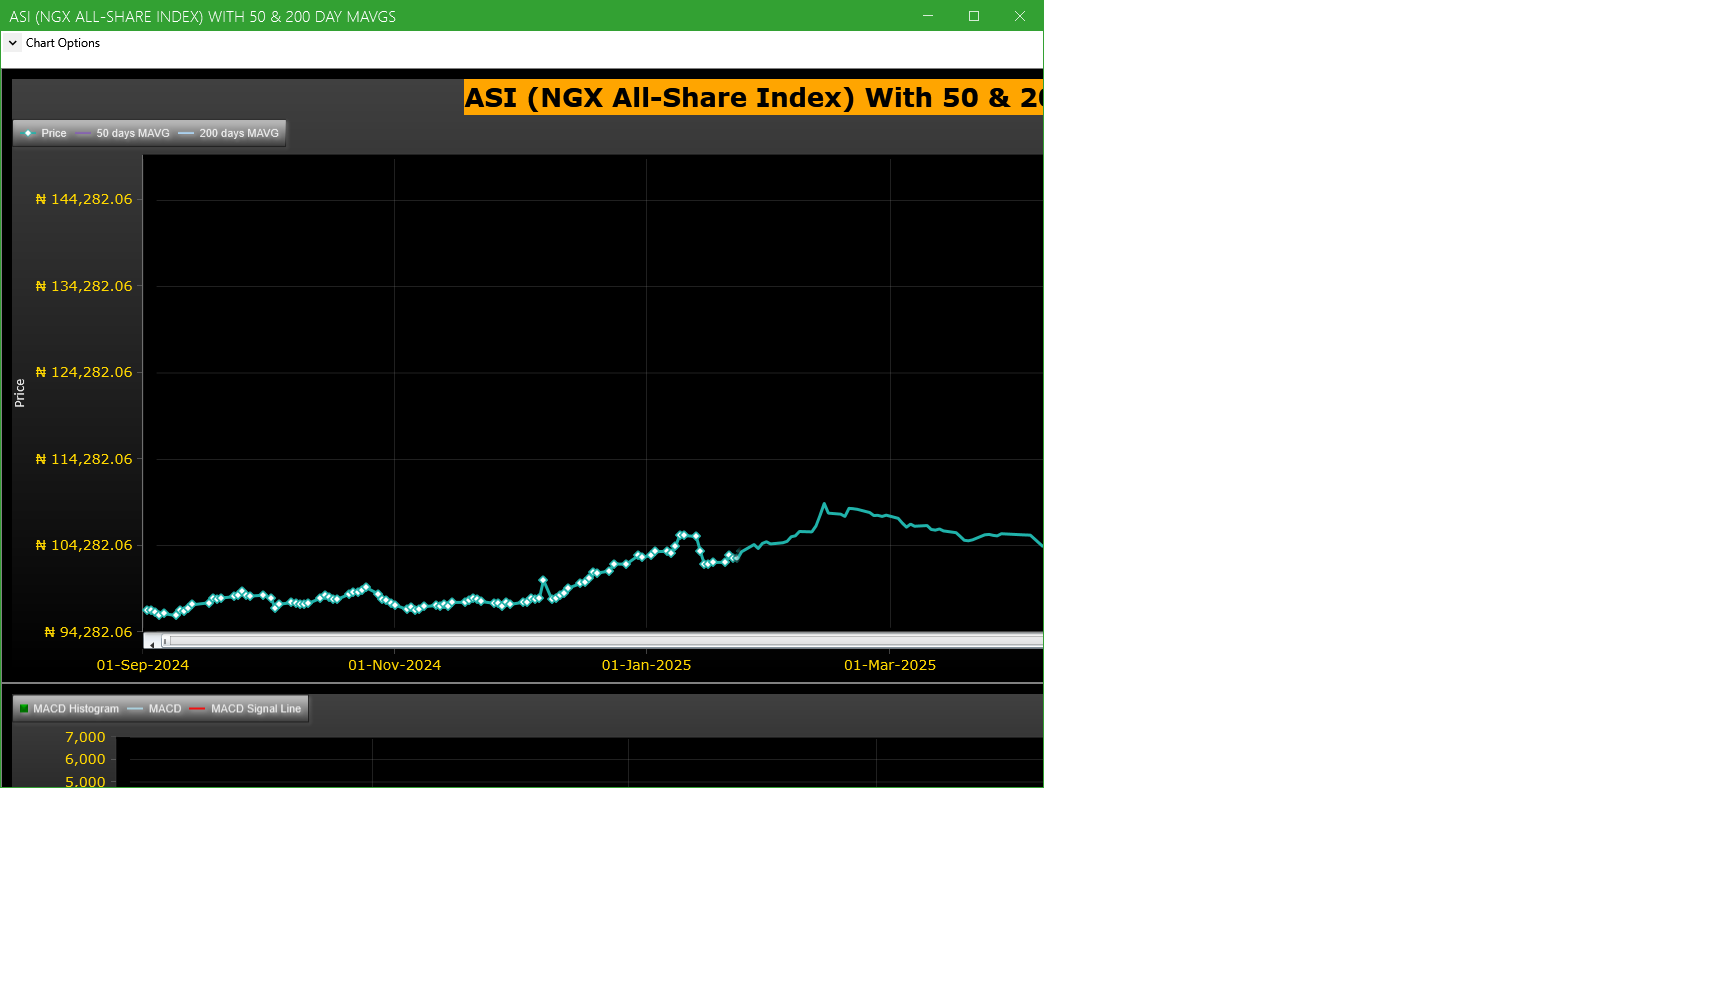
Market Trend - ASI (NGX All-Share-Index) With 50 & 200 Day MAvgs Chart
Technical traders typically use the 50 & 200 day moving averages to aid in choosing
where to enter or exit a position, which then causes these levels to act as strong
support or resistance. As a general guideline, if the price is above a moving average,
the trend is up. If the price is below a moving average, the trend is down.
It is important to note that critics of technical analysis say that moving averages act
as support and resistance because so many traders use these indicators to inform their
trading decisions. Also moving averages tend to work quite well in strong trending conditions
but poorly in choppy or ranging conditions.
Trading Strategies: Crossovers
Crossovers are one of the main moving average strategies. The first type is a price crossover,
which is when the price crosses above or below a moving average to signal a potential change
in trend. Another strategy is to apply two moving averages to a chart: one longer and one
shorter. When the shorter-term MA crosses above the longer-term MA, it is a buy signal, as
it indicates that the trend is shifting up. This is known as a golden cross. Meanwhile, when
the shorter-term MA crosses below the longer-term MA, it is a sell signal, as it indicates that
the trend is shifting down. This is known as a dead/death cross
For more detailed analysis,
- On InfoWARE Market Data Terminal <CI> <GO>
- On InfoWARE Finance Mobile App ( Android , iPhone & iPad and Windows 10) , "Research"
Unusual Volume: Volume traded is more than double the 90 day moving average (All exchanges; ASI & ASem). For more detailed analysis,
- On InfoWARE Market Data Terminal <UV> <GO>
- On InfoWARE Finance Mobile App ( Android , iPhone & iPad and Windows 10)
| Symbol | Name | Volume | 90DAvgVol | %VolChg | Price | LClose | %Chg | Trades | Value |
|---|---|---|---|---|---|---|---|---|---|
| NSLTECH | SECURE ELECTRONIC TECHNOLOGY PLC | 22.36M | 8.70M | 156.98 | 0.89 | 0.85 | 4.71 | 237 | 19.52M |
| ARADEL | ARADEL HOLDINGS PLC | 10.34M | 1.90M | 444.66 | 513.50 | 510.00 | 0.69 | 411 | 5.31B |
| SCOA | S C O A NIG. PLC. | 758.89K | 117.77K | 544.41 | 6.59 | 6.00 | 9.83 | 171 | 4.88M |
| ENAMELWA | NIGERIAN ENAMELWARE PLC. | 200.41K | 82.36K | 143.35 | 39.00 | 39.00 | 0.00 | 18 | 7.85M |
| LOTUSHAL15 | LOTUS HALAL EQUITY ETF | 14.36K | 5.35K | 168.32 | 57.00 | 63.10 | -9.67 | 14 | 909.01K |
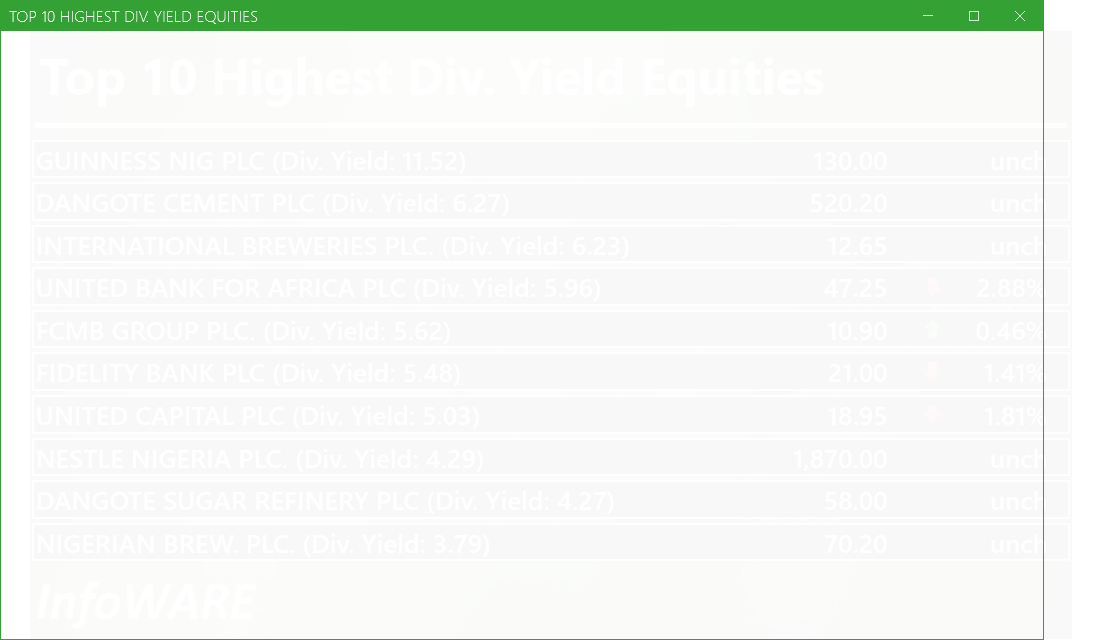
Investment Insights - High Div. Stocks
Dividend stocks distribute a portion of the company earnings to investors on a regular basis and they can a great choice for investors looking for regular income. As an investment or trading strategy, high dividend yield equities provide annual cash payments as against mostly capital gains in the price of a stock. The list in the table below represent the highest dividend paying stocks from the list of the most liquid stocks in the NSE top 30.
For more detailed analysis,
- On InfoWARE Market Data Terminal <HYIELD> <GO>
- On InfoWARE Finance Mobile App ( Android , iPhone & iPad and Windows 10) , "Research"
Investment Insights - Stocks outperforming the ASI but with approximately the same risk
These list of stocks represent equities that are less risky than the ASI but doing better than the ASI (All Shares Index) using the YTD (Year to Date) returns as the measure. The risk is measured by Beta. Beta is an assessment of a stock's tendency to undergo price changes, (its volatility), as well as its potential returns compared to the ASI. It is expressed as a ratio, where a score of 1 represents performance comparable to the ASI, and returns above or below the market may receive scores greater or lower than 1.
For a full list of both positively and negatively corelated stocks visit InfoWARE Market Data Terminal
- On InfoWARE Market Data Terminal <BANL> <GO>
- On InfoWARE Finance Mobile App ( Android , iPhone & iPad and Windows 10)
| Symbol | DivYield | PE | EPS | Beta | %ChgYTD | ASIYTDReturn | BetaDiff |
|---|---|---|---|---|---|---|---|
| HONYFLOUR | 1.40 | 16.28 | 0.31 | 0.99 | 212.14 | 35.42 | 0.01 |
| CAVERTON | 5.52 | 1.15 | 1.57 | 0.98 | 158.82 | 35.42 | 0.02 |
| ROYALEX | 7.81 | 0.00 | 0.00 | 0.96 | 89.09 | 35.42 | 0.04 |
| CORNERST | 5.28 | 8.62 | 0.35 | 0.93 | 74.24 | 35.42 | 0.07 |
| DEAPCAP | 13.76 | 188.84 | 0.01 | 0.89 | 42.50 | 35.42 | 0.11 |
| UNIVINSURE | 0.00 | 0.00 | 0.00 | 0.83 | 73.61 | 35.42 | 0.17 |
| FTNCOCOA | 1.60 | 0.00 | 0.00 | 0.79 | 234.57 | 35.42 | 0.21 |
| NB | 3.79 | 16.95 | 1.60 | 0.79 | 119.38 | 35.42 | 0.21 |
| MAYBAKER | 3.75 | 58.94 | 0.14 | 0.78 | 92.02 | 35.42 | 0.22 |
| WAPIC | 2.56 | 72.55 | 0.02 | 0.76 | 39.68 | 35.42 | 0.24 |
African Markets
| Name | LClose | Change | %Chg |
|---|---|---|---|
| BRVM Stock Exchange | 320.53 | 1.53 | 0.48 |
| Botswana Stock Exchange | 10,560.08 | 0.00 | 0.00 |
| Egyptian Exchange | 35,727.19 | 49.95 | 0.14 |
| Ghana Stock Exchange | 7,330.37 | -9.54 | -0.13 |
| Johannesburg Stock Exchange | 101,835.59 | -20.37 | -0.02 |
| Lusaka Stock Exchange | 24,172.67 | 117.87 | 0.49 |
| Casablanca Stock Exchange | 20,054.88 | -82.56 | -0.41 |
| Malawi Stock Exchange | 535,303.19 | 2,238.87 | 0.42 |
| Nigeria Stock Exchange | 140,295.49 | -267.07 | -0.19 |
| Nairobi Securities Exchange | 172.60 | 0.55 | 0.32 |
| Namibian Stock Exchange | 1,829.80 | -11.60 | -0.63 |
| Rwanda Stock Exchange | 178.88 | 0.00 | 0.00 |
| Tunis Stock Exchange | 11,914.72 | 10.71 | 0.09 |
| Uganda Securities Exchange | 1,433.89 | -7.64 | -0.53 |
Nigeria Market Indexes
| Symbol | LClose | %Chg | WTD% | MTD% | QTD% | YTD% | MktCap | Trades |
|---|---|---|---|---|---|---|---|---|
| ASI | 139,722.19 | -0.41 | 0.00 | 0.00 | 16.69 | 35.42 | 32,151 | |
| NGX30 | 5,096.81 | -0.38 | 0.00 | 0.00 | 7.90 | 33.61 | 16,976 | |
| NGXAFRBVI | 3,485.38 | -1.41 | 0.00 | 0.00 | -1.64 | 40.49 | 7,211 | |
| NGXAFRHDYI | 22,531.63 | -0.94 | 0.00 | 0.00 | 7.74 | 32.32 | 8,289 | |
| NGXASEM | 1,538.10 | 0.00 | 0.00 | 0.00 | -3.57 | -2.88 | 11 | |
| NGXBNK | 1,511.47 | -1.12 | 0.00 | 0.00 | 0.05 | 39.00 | 7,495 | |
| NGXCG | 4,034.71 | -0.87 | 0.00 | 0.00 | 17.33 | 42.61 | 17,009 | |
| NGXCNSMRGDS | 3,189.62 | -0.03 | 0.00 | 0.00 | -8.04 | 83.91 | 3,529 | |
| NGXCOMMDTY | 1,068.09 | 0.12 | 0.00 | 0.00 | 1.99 | 6.81 | ||
| NGXGROWTH | 11,200.10 | 0.00 | 0.00 | 0.00 | 17.78 | 44.28 | 271 | |
| NGXINDUSTR | 4,932.47 | -0.85 | 0.00 | 0.00 | 40.01 | 38.10 | 3,266 | |
| NGXINS | 1,282.95 | -0.05 | 0.00 | 0.00 | 73.70 | 63.19 | 2,711 | |
| NGXLOTUSISLM | 11,419.05 | -0.58 | 0.00 | 0.00 | 19.26 | 63.88 | 5,894 | |
| NGXMAINBOARD | 6,787.01 | -0.17 | 0.00 | 0.00 | 15.05 | 35.63 | 23,312 | |
| NGXMERIGRW | 10,014.47 | 0.07 | 0.00 | 0.00 | 3.75 | 53.52 | 4,172 | |
| NGXMERIVAL | 13,370.04 | -1.75 | 0.00 | 0.00 | 11.90 | 28.18 | 8,996 | |
| NGXOILGAS | 2,370.66 | -0.45 | 0.00 | 0.00 | -0.90 | -12.56 | 535 | |
| NGXPENBRD | 2,590.19 | -0.38 | 0.00 | 0.00 | 12.65 | 41.41 | 26,640 | |
| NGXPENSION | 6,619.94 | -0.60 | 0.00 | 0.00 | 4.17 | 46.01 | 19,863 | |
| NGXPREMIUM | 13,762.31 | -0.85 | 0.00 | 0.00 | 19.99 | 41.40 | 8,568 | |
| NGXSOVBND | 658.87 | 0.00 | 0.00 | 0.00 | 0.82 | 9.53 | 0 |
For more detailed analysis,
- On InfoWARE Market Data Terminal <MKTINS> <GO>
- On InfoWARE Finance Mobile App ( Android, iPhone & iPad and Windows 10) , "Market Indexes"
Find the topic interesting? Will like to comment? Contact Us at solutions@infowarelimited.com
Top News

Chart Of The Day - ASI Chart Vs ASI Advance Decline Line (YTD) (01-Sep-2025 15:08:17.063)
InfoWARE AI Analyst Daily Market Report: 01-Sep-2025

[XNSA]>> EMERGING AFRICA DAILY MUTUAL FUND PRICES
SUSPENSION OF THREE (3) LISTED COMPANIES
[VETBANK]>> DAILY INDICATIVE PRICES
[XNSA]>> CORDROS MILESTONE FUNDS' BID & OFFER PRICES
[XNSA]>> NGX FIXED INCOME INDICATIVE PRICE LIST FOR SEP 01, 2025
[MERGROWTH]>> DAILY INDICATIVE PRICES
Breaking News! Bulls Momentum Alert (01-Sep-2025 10:21:13.274)
Breaking News! Bears Momentum Alert (01-Sep-2025 10:21:13.234)
InfoWARE Analyst Daily Market Report (01-Sep-2025 10:21:12.765)
[XNSA]>> REGISTRATION FOR BATCH TWO- 2025 DEALING CLERKSHIP CERTIFICATION PROGRA
[XNSA]>> UPDATED- SAVE THE DATE: 29TH ANNUAL STOCKBROKERS CONFERENCE
[STANBICETF30]>> DAILY INDICATIVE PRICES
InfoWARE AI Analyst Weekly Market Report: 29-Aug-2025
Chart Of The Day - ASI Chart Vs ASI Advance Decline Line (YTD) (29-Aug-2025 15:06:46.999)
InfoWARE AI Analyst Daily Market Report: 29-Aug-2025
[XNSA]>> CORDROS MILESTONE FUNDS' BID & OFFER PRICES
[VETGOODS]>> DAILY INDICATIVE PRICES
[XNSA]>> NGX FIXED INCOME INDICATIVE PRICE LIST FOR AUG 29, 2025
[XNSA]>> REGISTRATION FOR BATCH TWO- 2025 DEALING CLERKSHIP CERTIFICATION PROGRA
[XNSA]>> NGX NON-INTEREST FINANCE BOARD LAUNCH COMMUNIQUE
[XNSA]>> UPDATED- SAVE THE DATE: 29TH ANNUAL STOCKBROKERS CONFERENCE
[STANBICETF30]>> DAILY INDICATIVE PRICES
[XNSA]>> DAILY FUND PRICE SUBMISSION - FCMB ASSET MANAGEMENT LIMITED
Chart Of The Day - ASI Chart Vs ASI Advance Decline Line (YTD) (28-Aug-2025 15:07:47.937)
InfoWARE AI Analyst Daily Market Report: 28-Aug-2025
[XNSA]>> CORDROS MILESTONE FUNDS' BID & OFFER PRICES
[MERGROWTH]>> DAILY INDICATIVE PRICES
[XNSA]>> DAILY FUND PRICE SUBMISSION - FCMB ASSET MANAGEMENT LIMITED
Get IDIA - the stock trading app for the modern investor
Solutions by Business
Product Suites
Company
Contacts
- 8th Floor,
- South Atlantic Petroleum Towers,
- 1 Adeola Odeku Street,
- Victoria Island,
- Lagos, Nigeria.
- Email: solutions@infowarelimited.com
Follow Us
 |
 |
 |
 |