


InfoWARE AI Analyst Daily Market Report: 18-Sep-2025 | InfoWARE Finance
Get IDIA - the stock trading app for the modern investor


InfoWARE AI Analyst Daily Market Report: 18-Sep-2025
(Source: InfoWARE Terminal, Date: 18-Sep-2025)
Dear Investor,
NGX Market Close Summary – Thursday, September 18, 2025
The Nigerian equities market posted a modest +0.16% gain today, as the NGX All Share Index (ASI) settled at 142,036.25, marking a resilient year-to-date return of +37.88%. However, market activity trended sharply lower: turnover plummeted by -78.99% to just ₦3.53bn with 154.13m shares trading hands (versus nearly 1 billion yesterday). Despite lackluster liquidity, breadth remained positive (1.43x) with 33 advancers versus 23 decliners. Bullish momentum and a rotation into less liquid names defined the session, supported by impressive spikes in unusual volume stocks.
Key Trends & Breadth
- Market Breadth: Healthy at 1.43x with 33 gainers and 23 losers – a sustained bullish bias, supported by an uptick in the number of stocks building on short-term 15D/50D moving average crossovers.
- Turnover Collapse: Trading value dropped -78.99% from the prior session, a possible caution flag for sustained upward momentum as conviction wanes.
- Breadth by Activity: More stocks saw a drop in traded volume today (85 lower, 54 higher), suggesting selective accumulation rather than widespread bullish sentiment.
Top Gainers & Losers – Standouts
| Stock | Close | % Chg | RSI | MACD | 15D/50D Cross |
|---|---|---|---|---|---|
| GUINNESS NIG PLC | 176.00 | +10.00% | 58.88 | MACD: 6.01 | Yes (139.19 > 127.72) |
| EUNISELL INTERLINKED PLC | 30.55 | +9.89% | 57.40 | MACD: 1.33 | Yes (26.09 > 22.45) |
| REGALINS | 1.79 | +9.82% | 56.31 | MACD: 0.14 | Yes (1.47 > 1.20) |
| THOMASWY | 2.69 | +9.80% | 45.59 | MACD: -0.18 | Yes (2.75 > 3.18) |
| MCNICHOLS | 3.89 | +9.58% | 50.86 | MACD: 0.07 | Yes (3.69 < 3.89) |
| Stock | Close | % Chg | RSI | MACD |
|---|---|---|---|---|
| LOTUSHAL15 | 66.00 | -10.00% | NA | NA |
| CONHALLPLC | 4.02 | -7.59% | 52.33 | MACD: 0.08 |
| TIP | 12.00 | -7.48% | 54.03 | MACD: 0.00 |
| NEWGOLD | 51120.20 | -6.88% | 52.20 | MACD: 149.91 |
| SOVRENINS | 2.87 | -6.21% | 54.86 | MACD: 0.17 |
| OMATEK | 1.10 | -5.17% | 46.99 | MACD: -0.02 |
- GUINNESS delivered the day's most impressive run, closing +10%, boasting a 23.1% 5-day return and surging +150.5% YTD – momentum is underscored by a firm MACD and price riding above both 15D and 50D moving averages.
- OMATEK and TIP stood out for notable volume spikes against price declines (-5.2%, -7.5%), signaling potentially smart money exits or forced liquidation after speculative run-ups.
- AUSTINLAZ and EUNISELL posted exceptional relative volume trades (748% and 406% > 90D avg), indicating renewed market attention to less-liquid small caps.
Implications & Notable Patterns
- Turnover Drop: Sustained positive breadth despite a -79% fall in value traded could mean short-term profit-taking or wait-and-see stance by large funds. While retail activity dominates by deal count (63%), institutional investors still control value (81% of value, ₦7.49bn vs. ₦1.73bn).
-
Stocks With Unusual Volume (UV):
- OMATEK (-5.2%) and TIP (-7.5%) trade double+ their 90-day averages, with negative price action. This could presage further weakness as supply overwhelms demand; speculative buyers should tread with caution.
- THOMASWY (+9.8%) and EUNISELL (+9.9%): Big positive price/volume moves often indicate institutional entry or concerted accumulation—monitor for potential follow-through.
- Advancers vs. Decliners: Breadth stays positive, but the volume-weighted sentiment is neutral-to-cautious, as most price surges are on selective counters.
- Bearish Momentum Flags: Several insurance names (CONHALLPLC, SOVRENINS, PRESTIGE, LINKASSURE) are experiencing selling pressure—see below for sector breakdown.
- Bullish Momentum Names: MCNICHOLS and GUINNESS propelled by both price and technical signals (RSI rising; price breaking above the 15-day MA), confirming genuine bullish momentum, albeit on thin liquidity.
Momentum Trends: YTD Gainers, Losers & Technicals
-
YTD Gainers:
Stock YTD % 5D % RSI MACD DivY GUINNESS +150.53% +23.08% 58.88 6.01 11.52% EUNISELL +135.91% +20.28% 57.40 1.33 0.00% MULTIVERSE +65.09% +12.50% 73.29 0.79 0.85% CHELLARAM +294.59% +9.77% 63.70 0.90 1.99% MCNICHOLS +141.61% +9.58% 50.86 0.07 5.88% -
YTD Losers – rotational weakness in insurance, ETFs, and tech names:
Stock YTD % 5D % RSI DivY GREENWETF -56.84% -9.99% 44.47 0.00% OMATEK -37.50% -9.84% 46.99 0.00% CONHALLPLC -34.00% -8.64% 52.33 2.08% ROYAL EXCH. -81.82% -9.50% 49.45 7.81% MERISTEM VALUE ETF +0.15% -9.09% 50.59 -
Bullish Momentum Table (Breakout Candidates):
- MCNICHOLS (+8.74% today) and GUINEAINS boast recent closes above their 15DMA and positive RSI readings, indicating momentum play validity.
- Most bullish momentum stocks have RSI readings below overbought (sub-70), suggesting uptrends are not overextended. No immediate RSI>70 caution flags on the top gainers list, though MULTIVERSE (RSI: 73.29, not in today's top gainer) is one to watch for overheating.
-
Bearish Momentum:
- Today's losing stocks in insurance (e.g., CONHALLPLC, SOVRENINS, PRESTIGE, LINKASSURE) all triggered closing below 15DMA and have neutral RSI (40s-50s)—this could accelerate into further downside, especially if sector-wide.
- Banks and defensive ETFs showed signs of fatigue (ZENITHBANK -1.44%, NEWGOLD -6.88%) albeit with modest RSI levels, suggesting more "rest” than outright reversal.
-
Overlaps/Hidden Gems:
- Stocks appearing in both the "unusual volume” and "gainers” table (like EUNISELL, THOMASWY, MCNICHOLS) could offer near-term trading opportunities. Those with positive technical momentum and robust volume surges are classic short-term breakout candidates.
- Conversely, TIP and OMATEK saw high volumes and sharp declines, representing potential overhangs – a sell-the-rally scenario.
- Dividend Opportunities: MCNICHOLS offers a healthy 5.88% yield and is currently in the bullish list—could be attractive to conservative momentum hunters.
Contrarian Signals
-
CHAMPION (RSI: 54.4, MACD Bullish, -9.8% YTD):
- Despite a lackluster YTD performance, CHAMPION is showing a bullish MACD crossover and a positive break above the 15DMA, but without the overbought RSI. Contrarians may see this as a bottoming formation, but volume is thin and relative strength is mild – more confirmation needed.
- ZENITHBANK: Bearish breakdown below the 15DMA, but bank stocks are often the first to reverse on improved macro sentiment; institutional investors show high turnover share (20.17% see below), pointing to possible smart-money positioning.
Sector Heatmap & Flows
| Sector | Performance | Bullish Stocks | Bearish Stocks | Institutional/ Retail Action |
|---|---|---|---|---|
| Insurance | Weak | GUINEAINS | LINKASSURE, PRESTIGE, CONHALLPLC, SOVRENINS | Notably weak; selling by both retail & institutional |
| Food Products | Strong | MCNICHOLS, HONYFLOUR | Retail-led accumulation | |
| Banking | Mixed | ZENITHBANK, UBA, ACCESSCORP | Heavy institutional; smart money watching closely | |
| Specialty | Strong | EUNISELL | Unusual volume, price breakout | |
| Growth/Tech | Soft | OMATEK, TIP | Speculation unwinding, high volume on declines |
Dividend-Beta Matrix (Defensive Picks)
| Stock | Dividend Yield | Beta | PE | Momentum |
|---|---|---|---|---|
| MCNICHOLS | 5.88% | 0.11 | 26.8 | Bullish |
| AFRIPRUD | 1.27% | 0.64 | NA | NA |
| GUINNESS | 11.52% | 0.33 | 31.75 | Bullish |
| CONHALLPLC | 2.08% | 0.96 | 69.63 | Bearish |
- MCNICHOLS and GUINNESS stand out for offering both above-average yields and low beta, making them potentially attractive for yield-seeking defensive investors, with the added kicker of bullish momentum.
- CONHALLPLC has a decent yield (2.08%) but is mired in a bearish technical setup and sectoral outflows—avoid for now.
Institutional Clustering Alerts
- ZENITHBANK captured 20.17% of today’s institutional trade value (₦1.47bn out of market ₦7.49bn), signaling active Delta One and value fund positioning, despite a short-term technical breakdown (closed below 15DMA and price -1.44%). Watch for large block trades here as a precursor to re-rating.
- ARADEL and ACCESSCORP also appeared prominently in top institutional trades (₦998.8mn and ₦931.2mn), both trading in large volume blocks; these may serve as liquidity anchors in subsequent rebounds.
Traders' Insights & Tactical Suggestions
- Momentum Catchers: Seek follow-through opportunities in stocks combining unusual volume, positive price, and technical breakouts (e.g., EUNISELL, THOMASWY, MCNICHOLS).
- Contrarian Shorts: Speculative losers with outsized volume—TIP and OMATEK—may still have further downside; avoid catching falling knives until signs of reversal.
- Watch Insurance: Structural weaknesses persist; steer clear unless clear trend reversals or news flows appear.
- Defensive Rotation: Defensive yield stocks with low beta, such as MCNICHOLS and GUINNESS, are now outperforming and may see continued inflows as top-down risk signals escalate.
- Liquidity Caution: The dramatic slide in market turnover should be watched closely. Wait for confirmation of renewed buying before chasing new highs.
Market Activity & Trades Summary Analysis
- Retail vs. Institutional Activity: Retail investors made 63.27% of the day's trades but only accounted for 18.77% of total value. Institutions, with just 36.73% of trades, drove 81.23% of the market’s value—a classic "smart money moves silently" day, playing in block sizes and larger caps.
- Top 5 Institutional Trades: ZENITHBANK, ARADEL, MTNN, ACCESSCORP, UBA – all are financial and large-cap names, confirming the defensive posture and preference for liquid instruments among institutions during low turnover.
- Top 5 Retail Trades: MTNN, ZENITHBANK, UBA, ACCESSCORP, GTCO – the overlap indicates retail investors continue to mirror institutional flows, especially in the core banking sector.
-
Stock-Specific Flow:
- ZENITHBANK and MTNN top both retail and institutional lists, offering liquidity and relatively lower volatility on a day of thin trading—these are likely to remain market bellwethers.
- GTCO is prominent in retail trade but not institutional, suggesting some "hot money” chasing quick banking rally, rather than deep-pocketed buy-and-hold conviction.
-
Pattern/Correlation:
- Banks are central in both retail and institutional trades, usually a sign that the macroeconomic narrative is driving flows (FX, interest rates, defensive asset allocation).
- Unusual volumes observed in non-banking small caps (EUNISELL, THOMASWY, OMATEK) are likely speculative and short-term driven—not yet backed by institutional conviction.
Currency Market Snap
- Naira appreciated +0.21% to 1,496/$, supporting positive flows to the banking sector.
Summary Table: 5-Day YTD Gainers/Losers
| Top 5 YTD Gainers | +5D % | YTD % | Top 5 YTD Losers | -5D % | YTD % |
|---|---|---|---|---|---|
| CHELLARAM | +9.77% | +294.59% | ROYAL EXCHANGE | -9.50% | -81.82% |
| GUINNESS | +23.08% | +150.53% | GREENWETF | -9.99% | -56.84% |
| MCNICHOLS | +9.58% | +141.61% | OMATEK | -9.84% | -37.50% |
| EUNISELL | +20.28% | +135.91% | CONHALLPLC | -8.64% | -34.00% |
| MULTIVERSE | +12.50% | +65.09% | MERISTEM VALUE ETF | -9.09% | +0.15% |
Gainers remain heavily momentum-driven, but some may be stretched (e.g., GUINNESS). Losers, especially in insurance/ETF segments, show sectoral risk-off rotation.
Final Thoughts & Strategy
- Liquidity is drying up; don't chase breakouts with poor conviction—wait for volume-backed moves, especially as the market awaits the next catalysts.
- Keep an eye on sector divergences. Insurance and small-cap tech are under pressure; Food Products and select specialty names are the short-term alpha spots.
- Use defensive yield and technical confirmation (MCNICHOLS, GUINNESS) for new risk-on positions.
- Watch "institutional clusters” on ZENITHBANK and ACCESSCORP for potential rotation signals.
- Continue to monitor for reversal signals in oversold severe losers (OMATEK nearing technical exhaustion, but not yet bouncing).
- For short-term traders: Play momentum but honor stop-losses—volatility and low volumes can create outsized intraday swings with little warning.
|
Top ASI Gainers Over Last 5 Trading Days
|
Top ASI Losers Over Last 5 Trading Days
|
For more detailed analysis, on InfoWARE Market Data Terminal <NSEPERF> <GO>
On InfoWARE Finance Mobile App (Android, iPhone & iPad, Windows Phone and Windows 8/10), "Top Gainers & Losers"
GUINNESS NIG PLC (GUINNESS) topped the advancers list closing at N176.00 with a gain of 10.00% followed by LOTUS HALAL EQUITY ETF (LOTUSHAL15) which closed at N66.00 with a gain of 10.00%.
On the flip side CONSOLIDATED HALLMARK INSURANCE PLC (CONHALLPLC) and THE INITIATES PLC (TIP) topped the decliners log with a loss of -7.59% at a close of N4.02, and -7.48% to close the day at N12.00 respectively.
| Symbol | LClose | %Chg |
|---|---|---|
| GUINNESS | 176.00 | 10.00 |
| LOTUSHAL15 | 66.00 | 10.00 |
| EUNISELL | 30.55 | 9.89 |
| REGALINS | 1.79 | 9.82 |
| THOMASWY | 2.69 | 9.80 |
| Symbol | LClose | %Chg |
|---|---|---|
| CONHALLPLC | 4.02 | -7.59 |
| TIP | 12.00 | -7.48 |
| NEWGOLD | 51,120.20 | -6.88 |
| SOVRENINS | 2.87 | -6.21 |
| OMATEK | 1.10 | -5.17 |
For more detailed analysis,
- On InfoWARE Market Data Terminal <TOPG> <GO>
- On InfoWARE Finance Mobile App ( Android, iPhone & iPad and Windows 10) , "Top Gainers & Losers"
Currency Market
In the currency market, the Naira appreciated 0.21%(3.10) against the Dollar to settle at 1 to 1NSE: Bull Signal - Price crossed above 15 Day MA
This signal implies these stocks are under buying pressure and the price might continue to rise and therefore positions should be monitored closely. Further suggested analysis include looking at the overall market (ASI) to see if the uptrend is market wide, sector wide or specific to the stock. Portfolio managers tend to use this as a signal to do more research to add to their positions or lock in some profits. Typically further analysis should be done using commands like PC and RV on the InfoWARE Market Data Terminal. Another command is ALERTS to set price triggers for possible exit or entry as necessary
For more detailed analysis,
- On InfoWARE Market Data Terminal <NSEPERF> <GO>
- On InfoWARE Finance Mobile App ( Android , iPhone & iPad and Windows 10) , "Top Gainers & Losers"
| Symbol | Price | %Chg | 15DMA | PE | EPS | DivY | MktCap | Vol | Trades | Value | LstTradeTime |
|---|---|---|---|---|---|---|---|---|---|---|---|
| MCNICHOLS | 3.89 | 8.74 | 3.69 | 26.80 | 0.05 | 5.88 | 2.80B | 3.10M | 98.00 | 11.10M | 18-Sep-2025 14:30:37.720 |
| GUINEAINS | 1.63 | 8.59 | 1.56 | 66.79 | 0.01 | 1.96 | 10.01B | 1.36M | 65.00 | 2.21M | 18-Sep-2025 14:30:07.807 |
| UPDC | 6.13 | 5.71 | 5.94 | 0.00 | 0.00 | 34.25 | 113.77B | 1.70M | 131.00 | 9.88M | 18-Sep-2025 14:30:33.387 |
| LEGENDINT | 5.40 | 5.56 | 5.34 | 0.00 | 0.00 | 657.02K | 45.00 | 3.56M | 18-Sep-2025 14:30:07.997 | ||
| TANTALIZER | 2.49 | 2.01 | 2.44 | 0.00 | 0.00 | 1.50 | 8.00B | 1.18M | 59.00 | 2.94M | 18-Sep-2025 14:30:09.880 |
| CHAMPION | 16.50 | 1.33 | 16.39 | 412.83 | 0.01 | 0.41 | 129.19B | 1.44M | 112.00 | 23.67M | 18-Sep-2025 14:30:07.433 |
| NGXINDUSTR | 4,929.40 | 0.01 | 4,926.40 | 39.90 | 18.97 | 0.00 | 0.00 | 6.24M | 1,348.00 | 195.70M | 18-Sep-2025 14:30:13.503 |
| HONYFLOUR | 22.10 | 0.00 | 22.09 | 16.28 | 0.31 | 1.40 | 175.26B | 470.68K | 275.00 | 10.44M | 18-Sep-2025 14:30:07.847 |
| INTENEGINS | 3.34 | 0.00 | 3.33 | 0.52 | 2.85 | 3.40 | 4.29B | 0.00 | 0.00 | 0.00 | 18-Sep-2025 14:30:07.917 |
NSE: BEAR Signal - Price crossed below 15 Day MA
This signal implies these stocks are under selling pressure and the price might continue to slide and therefore positions should be monitored closely. Further suggested analysis include looking at the overall market (ASI) to see if the downtrend is market wide, sector wide or specific to the stock. If the overal market trend is upwards, then since these stocks are heading in the opposite direction, then further analysis should be done using commands like PC and RV on the InfoWARE Market Data Terminal. Another command is ALERTS to set price triggers for possible exit is necessar
For more detailed analysis,
- On InfoWARE Market Data Terminal <BEARM> <GO>
- On InfoWARE Finance Mobile App ( Android , iPhone & iPad and Windows 10)
| Symbol | Price | %Chg | 15DMA | PE | EPS | DivY | MktCap | Vol | Trades | Value | LstTradeTime |
|---|---|---|---|---|---|---|---|---|---|---|---|
| FGS202772 | 116.20 | 0.00 | 116.20 | 0.00 | 0.00 | 0.00 | 0.00 | 0.00 | 18-Sep-2025 14:30:12.533 | ||
| LINKASSURE | 2.14 | -1.40 | 2.15 | 59.89 | 0.02 | 5.56 | 29.96B | 4.23M | 37.00 | 9.17M | 18-Sep-2025 14:30:08.010 |
| ZENITHBANK | 66.00 | -1.44 | 66.30 | 3.33 | 13.30 | 2.25 | 2,072.17B | 24.27M | 1,475.00 | 1.60B | 18-Sep-2025 14:30:37.177 |
| PRESTIGE | 1.76 | -2.27 | 1.79 | 10.49 | 0.08 | 2.50 | 23.32B | 5.47M | 66.00 | 9.88M | 18-Sep-2025 14:30:08.363 |
| ELLAHLAKES | 13.05 | -2.68 | 13.22 | 0.00 | 0.00 | 0.00 | 26.10B | 4.43M | 343.00 | 58.65M | 18-Sep-2025 14:30:07.627 |
| SOVRENINS | 2.87 | -6.62 | 2.89 | 27.95 | 0.03 | 3.75 | 32.62B | 4.83M | 96.00 | 14.18M | 18-Sep-2025 14:30:09.813 |
| NEWGOLD | 51,120.20 | -7.39 | 53,621.43 | 0.00 | 0.00 | 0.00 | 0.00 | 2.00 | 1.00 | 102.24K | 18-Sep-2025 14:30:33.823 |
| TIP | 12.00 | -8.08 | 12.02 | 0.00 | 10.68B | 11.24M | 344.00 | 139.32M | 18-Sep-2025 14:30:38.567 | ||
| CONHALLPLC | 4.02 | -8.21 | 4.23 | 69.63 | 0.03 | 2.08 | 43.03B | 4.47M | 107.00 | 18.22M | 18-Sep-2025 14:30:07.483 |
| FGSUK2032S5 | 91.00 | -12.64 | 94.13 | 0.00 | 0.00 | 999.00 | 3.00 | 909.13K | 18-Sep-2025 14:30:39.200 |
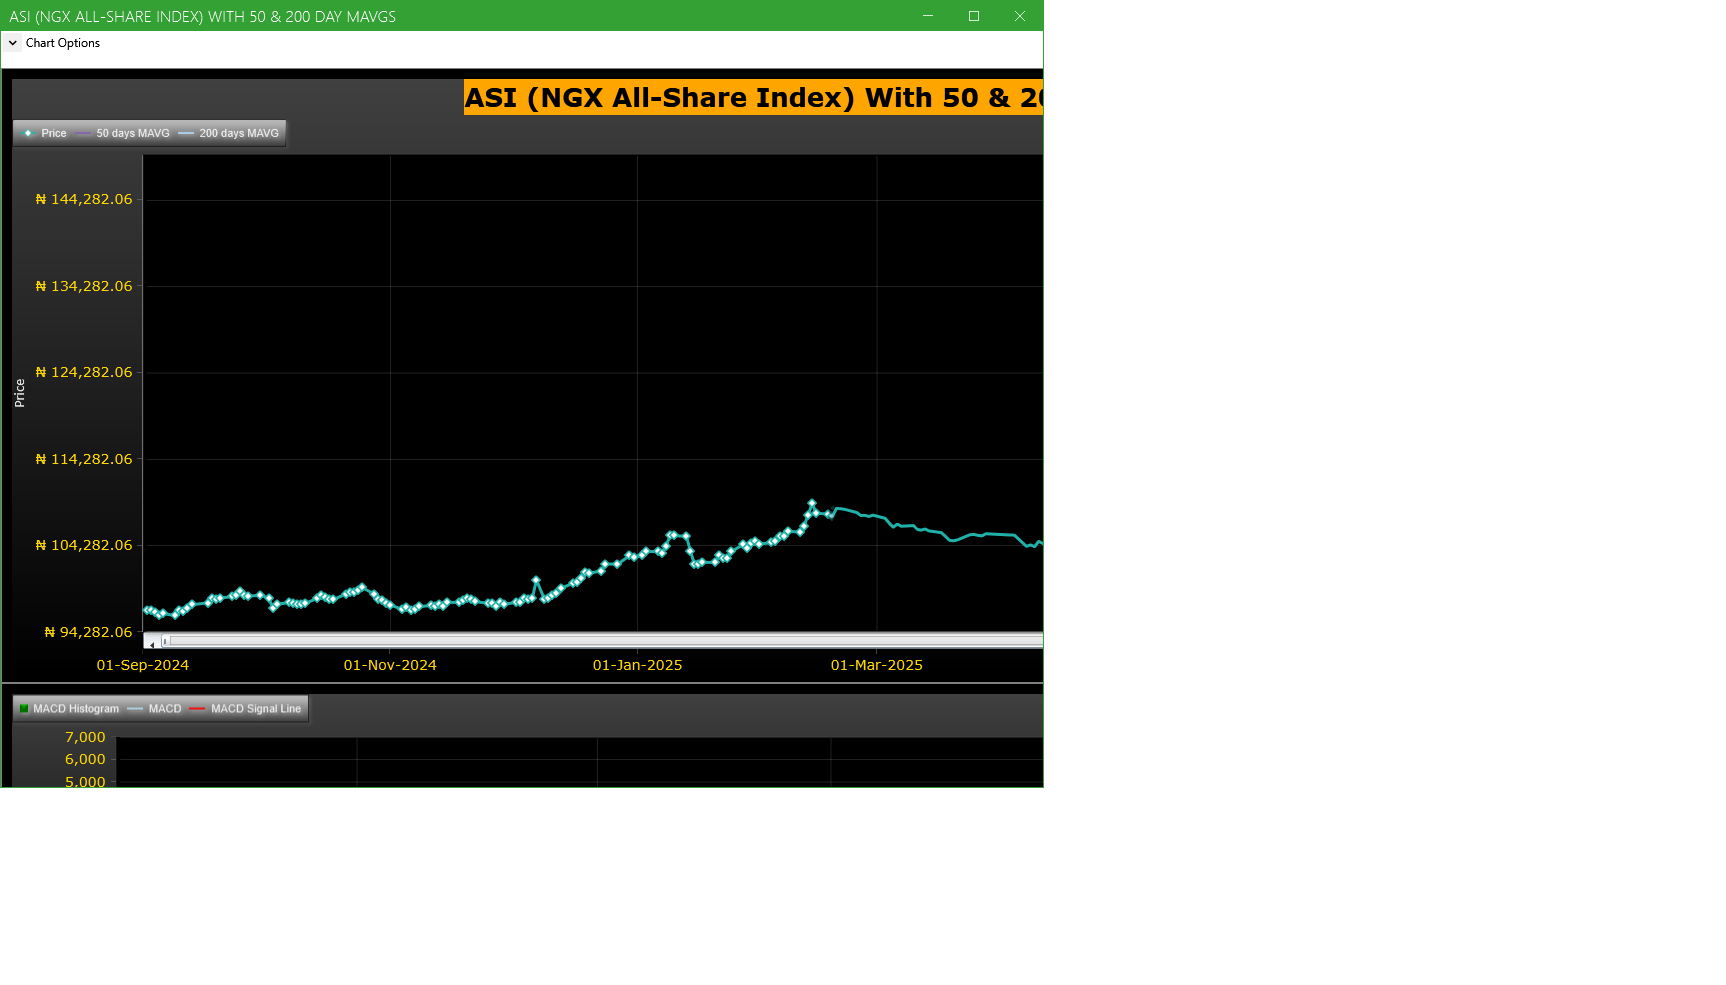
Market Trend - ASI (NGX All-Share-Index) With 50 & 200 Day MAvgs Chart
Technical traders typically use the 50 & 200 day moving averages to aid in choosing
where to enter or exit a position, which then causes these levels to act as strong
support or resistance. As a general guideline, if the price is above a moving average,
the trend is up. If the price is below a moving average, the trend is down.
It is important to note that critics of technical analysis say that moving averages act
as support and resistance because so many traders use these indicators to inform their
trading decisions. Also moving averages tend to work quite well in strong trending conditions
but poorly in choppy or ranging conditions.
Trading Strategies: Crossovers
Crossovers are one of the main moving average strategies. The first type is a price crossover,
which is when the price crosses above or below a moving average to signal a potential change
in trend. Another strategy is to apply two moving averages to a chart: one longer and one
shorter. When the shorter-term MA crosses above the longer-term MA, it is a buy signal, as
it indicates that the trend is shifting up. This is known as a golden cross. Meanwhile, when
the shorter-term MA crosses below the longer-term MA, it is a sell signal, as it indicates that
the trend is shifting down. This is known as a dead/death cross
For more detailed analysis,
- On InfoWARE Market Data Terminal <CI> <GO>
- On InfoWARE Finance Mobile App ( Android , iPhone & iPad and Windows 10) , "Research"
Unusual Volume: Volume traded is more than double the 90 day moving average (All exchanges; ASI & ASem). For more detailed analysis,
- On InfoWARE Market Data Terminal <UV> <GO>
- On InfoWARE Finance Mobile App ( Android , iPhone & iPad and Windows 10)
| Symbol | Name | Volume | 90DAvgVol | %VolChg | Price | LClose | %Chg | Trades | Value |
|---|---|---|---|---|---|---|---|---|---|
| OMATEK | OMATEK VENTURES PLC | 14.82M | 5.68M | 161.09 | 1.10 | 1.16 | -5.17 | 305 | 16.08M |
| TIP | THE INITIATES PLC | 11.24M | 3.40M | 230.80 | 12.00 | 12.97 | -7.48 | 344 | 139.32M |
| AUSTINLAZ | AUSTIN LAZ & COMPANY PLC | 4.42M | 521.72K | 747.72 | 2.97 | 2.95 | 0.68 | 123 | 12.00M |
| THOMASWY | THOMAS WYATT NIG. PLC. | 2.61M | 1.17M | 122.93 | 2.69 | 2.45 | 9.80 | 53 | 6.91M |
| EUNISELL | EUNISELL INTERLINKED PLC | 901.06K | 178.24K | 405.55 | 30.55 | 27.80 | 9.89 | 39 | 24.43M |
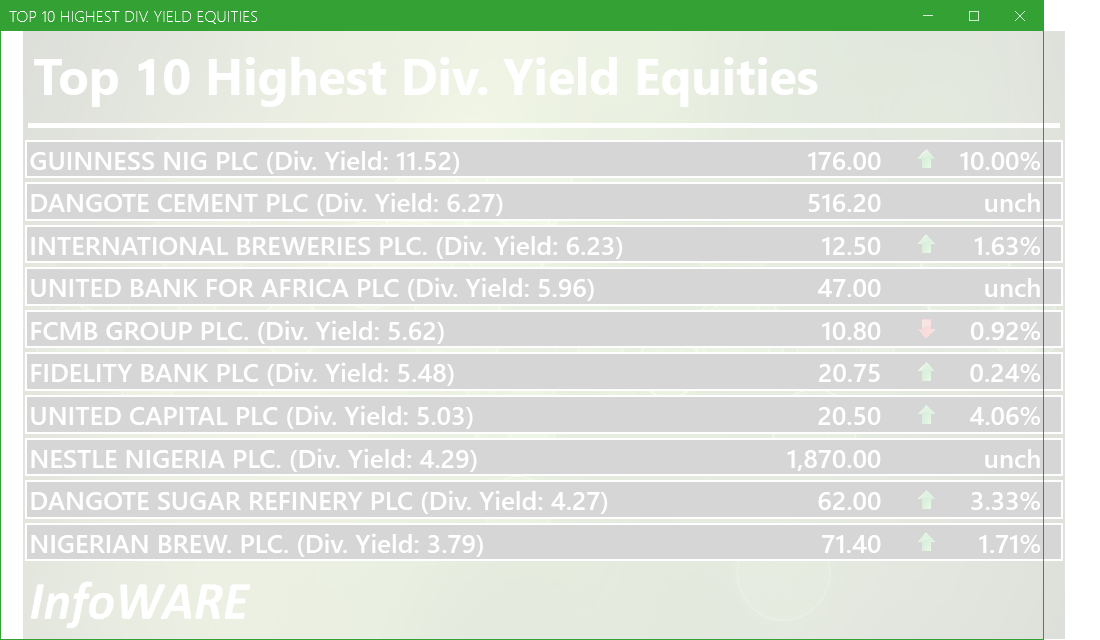
Investment Insights - High Div. Stocks
Dividend stocks distribute a portion of the company earnings to investors on a regular basis and they can a great choice for investors looking for regular income. As an investment or trading strategy, high dividend yield equities provide annual cash payments as against mostly capital gains in the price of a stock. The list in the table below represent the highest dividend paying stocks from the list of the most liquid stocks in the NSE top 30.
For more detailed analysis,
- On InfoWARE Market Data Terminal <HYIELD> <GO>
- On InfoWARE Finance Mobile App ( Android , iPhone & iPad and Windows 10) , "Research"
African Markets
| Name | LClose | Change | %Chg |
|---|---|---|---|
| BRVM Stock Exchange | 322.42 | 0.42 | 0.13 |
| Botswana Stock Exchange | 10,611.86 | 0.00 | 0.00 |
| Egyptian Exchange | 34,840.82 | -323.51 | -0.92 |
| Johannesburg Stock Exchange | 105,367.88 | 482.47 | 0.46 |
| Lusaka Stock Exchange | 24,722.17 | -27.22 | -0.11 |
| Casablanca Stock Exchange | 19,586.47 | -58.94 | -0.30 |
| Malawi Stock Exchange | 561,867.54 | 673.43 | 0.12 |
| Nairobi Securities Exchange | 177.60 | -0.46 | -0.26 |
| Namibian Stock Exchange | 1,901.72 | -8.79 | -0.46 |
| Rwanda Stock Exchange | 179.11 | 0.00 | 0.00 |
| Tunis Stock Exchange | 12,344.21 | 129.48 | 1.06 |
| Uganda Securities Exchange | 1,440.22 | -1.01 | -0.07 |
Nigeria Market Indexes
| Symbol | LClose | %Chg | WTD% | MTD% | QTD% | YTD% | MktCap | Trades |
|---|---|---|---|---|---|---|---|---|
| ASI | 142,263.12 | 0.16 | 0.43 | 1.82 | 18.81 | 37.88 | 15,676 | |
| NGX30 | 5,181.21 | 0.11 | 0.34 | 1.66 | 9.69 | 35.82 | 9,172 | |
| NGXAFRBVI | 3,546.46 | -0.22 | -1.20 | 1.75 | 0.08 | 42.96 | 2,891 | |
| NGXAFRHDYI | 23,018.48 | 0.61 | 0.18 | 2.16 | 10.06 | 35.18 | 3,685 | |
| NGXASEM | 1,538.10 | 0.00 | 0.00 | 0.00 | -3.57 | -2.88 | 2 | |
| NGXBNK | 1,520.68 | -0.23 | -0.69 | 0.61 | 0.66 | 39.84 | 3,990 | |
| NGXCG | 4,081.79 | 0.11 | -0.01 | 1.17 | 18.70 | 44.27 | 7,858 | |
| NGXCNSMRGDS | 3,337.91 | 0.75 | 1.26 | 4.65 | -3.77 | 92.46 | 2,124 | |
| NGXCOMMDTY | 1,112.02 | 0.16 | 1.41 | 4.11 | 6.18 | 11.20 | 1,313 | |
| NGXGROWTH | 12,761.99 | -0.35 | 1.78 | 13.95 | 34.20 | 64.40 | 301 | |
| NGXINDUSTR | 4,929.40 | 0.01 | 0.06 | -0.06 | 39.92 | 38.02 | 1,348 | |
| NGXINS | 1,265.19 | -1.07 | -3.22 | -1.38 | 71.30 | 60.93 | 1,183 | |
| NGXLOTUSISLM | 11,801.31 | 0.23 | 0.90 | 3.35 | 23.26 | 69.37 | 3,875 | |
| NGXMAINBOARD | 6,968.74 | 0.34 | 0.73 | 2.68 | 18.14 | 39.26 | 10,696 | |
| NGXMERIGRW | 10,014.31 | 0.27 | -0.37 | 0.00 | 3.75 | 53.52 | 1,758 | |
| NGXMERIVAL | 13,612.89 | -0.12 | -0.85 | 1.82 | 13.94 | 30.51 | 3,392 | |
| NGXOILGAS | 2,489.91 | 0.28 | 3.01 | 5.03 | 4.09 | -8.16 | 1,166 | |
| NGXPENBRD | 2,641.48 | 0.13 | 0.34 | 1.98 | 14.88 | 44.21 | 12,888 | |
| NGXPENSION | 6,736.41 | 0.14 | 0.45 | 1.76 | 6.01 | 48.57 | 9,853 | |
| NGXPREMIUM | 13,785.02 | -0.19 | -0.17 | 0.17 | 20.18 | 41.63 | 4,330 | |
| NGXSOVBND | 657.27 | 0.00 | 0.38 | -0.24 | 0.58 | 9.26 | 0 |
For more detailed analysis,
- On InfoWARE Market Data Terminal <MKTINS> <GO>
- On InfoWARE Finance Mobile App ( Android, iPhone & iPad and Windows 10) , "Market Indexes"
Find the topic interesting? Will like to comment? Contact Us at solutions@infowarelimited.com
Top News

Chart Of The Day - ASI Chart Vs ASI Advance Decline Line (YTD) (18-Sep-2025 15:10:03.338)
InfoWARE AI Analyst Daily Market Report: 18-Sep-2025

[XNSA]>> CORDROS MILESTONE FUNDS' BID & OFFER PRICES
[XNSA]>> SUPRA COMMERCIAL TRUST LIMITED - APPOINTMENT OF A DIRECTOR
[MERVALUE]>> DAILY INDICATIVE PRICES
[VSPBONDETF]>> DAILY INDICATIVE PRICES
[XNSA]>> NGX FIXED INCOME INDICATIVE PRICE LIST FOR SEP 18, 2025
[XNSA]>> INVITATION TO FACTS BEHIND THE FIGURES PRESENTATION
[XNSA]>> REGISTRATION FOR BATCH TWO- 2025 DEALING CLERKSHIP CERTIFICATION PROGRA
[XNSA]>> DAILY FUND PRICE SUBMISSION - FCMB ASSET MANAGEMENT LIMITED
[XNSA]>> UPDATED- SAVE THE DATE: 29TH ANNUAL STOCKBROKERS CONFERENCE
[SIAMLETF40]>> DAILY INDICATIVE PRICES
[XNSA]>> NOTIFICATION OF PRICE ADJUSTMENT
[LOTUSHAL15]>> DAILY INDICATIVE PRICES
Chart Of The Day - ASI Chart Vs ASI Advance Decline Line (YTD) (17-Sep-2025 15:25:56.139)
InfoWARE Analyst Daily Market Report (17-Sep-2025 15:25:35.606)
InfoWARE AI Analyst Daily Market Report: 17-Sep-2025
[MERGROWTH]>> DAILY INDICATIVE PRICES
[LOTUSHAL15]>> DAILY INDICATIVE PRICES
[VSPBONDETF]>> DAILY INDICATIVE PRICES
[XNSA]>> CORDROS MILESTONE FUNDS' BID & OFFER PRICES
[XNSA]>> INVITATION TO FACTS BEHIND THE FIGURES PRESENTATION
[XNSA]>> NGX FIXED INCOME INDICATIVE PRICE LIST FOR SEP 17, 2025
[XNSA]>> DAILY FUND PRICE SUBMISSION - FCMB ASSET MANAGEMENT LIMITED
[XNSA]>> REGISTRATION FOR BATCH TWO- 2025 DEALING CLERKSHIP CERTIFICATION PROGRA
[XNSA]>> UPDATED- SAVE THE DATE: 29TH ANNUAL STOCKBROKERS CONFERENCE
[SIAMLETF40]>> DAILY INDICTIVE PRICES
[XNSA]>> CHANGE OF COMPANY NAME -QUALINVEST CAPITAL LIMITED
Chart Of The Day - ASI Chart Vs ASI Advance Decline Line (YTD) (16-Sep-2025 15:06:43.632)
InfoWARE AI Analyst Daily Market Report: 16-Sep-2025
Get IDIA - the stock trading app for the modern investor
Solutions by Business
Product Suites
Company
Contacts
- 8th Floor,
- South Atlantic Petroleum Towers,
- 1 Adeola Odeku Street,
- Victoria Island,
- Lagos, Nigeria.
- Email: solutions@infowarelimited.com
Follow Us
 |
 |
 |
 |