


InfoWARE AI Analyst Daily Market Report: 16-Sep-2025 | InfoWARE Finance
Get IDIA - the stock trading app for the modern investor


InfoWARE AI Analyst Daily Market Report: 16-Sep-2025
(Source: InfoWARE Terminal, Date: 16-Sep-2025)
Dear Investor,
NGX Daily Market Summary: Tuesday, September 16, 2025
The Nigerian Stock Exchange (NGX) All Share Index (ASI) edged -0.08% lower today, closing at 141,659.00, with the YTD return still an impressive 37.18%. However, the day was marked by notably thinner trading as market turnover fell by -47.53% to ₦12.12B and volume declined 27% to 391.3M units. Market breadth was almost balanced (0.96x), with 27 advancers and 28 decliners. CUSTODIAN AND ALLIED PLC led gainers after surging +9.94%, while MULTIVERSE PLC topped decliners, dropping -9.68%. Tellingly, a number of top-performing YTD names are exhibiting technical signals suggesting sentiment is shifting, while some lagging stocks are flashing early contrarian interest. Institutions continued to dominate value traded, but retail volumes remained significant, particularly in financials.
Key Market Trends
- Market Breadth: Slightly negative, with decliners (28) just outnumbering advancers (27); volume increased for 63 stocks but fell for 78.
- Dramatic Drop in Turnover: Market value traded fell -47.53%, signaling a potentially cautious or "wait-and-see” attitude following recent rallies.
- Notable Winners:
- CUSTODIAN AND ALLIED PLC (CUSTODIAN): +9.94% (RSI: 52.95, MACD crossing up), price surging well above the 15D and 50D moving averages – continued bullish sentiment.
- MULTIVERSE PLC (MULTIVERSE): +9.68% (RSI: 56.81), strong technicals but recent volatility persists.
- E-TRANZACT (ETRANZACT): +9.45% (RSI: 65.7), one of the market’s YTD top gainers and massive +1633% spike in trading volume (highest among unusual volume stocks).
- EUNISELL INTERLINKED PLC (EUNISELL): +9.45% after closing above its 15DMA—bullish crossover, but Beta slightly negative, suggesting modest market risk exposure.
- Biggest Losers:
- GREENWICH ASSET ETF (GREENWETF): -9.99% (RSI: 47.18, deeply negative MACD), significant YTD and short-term underperformance.
- DEAP CAPITAL (DEAPCAP): -5.56% now also appearing in the bearish 15DMA breakdown table, signaling persistent weakness despite a moderately high RSI (53.62).
- FTN COCOA (FTNCOCOA): -4.84% and also below 15DMA—selling pressure remains.
Top 5 Year-To-Date (YTD) Gainers & Losers
| Stock | YTD % Chg | 5D % | 1D % | RSI |
|---|---|---|---|---|
| ETRANZACT | 176.15 | 31.99 | 9.45 | 65.71 |
| REGALINS | 117.50 | 15.23 | -4.40 | 61.02 |
| MULTIVERSE | 68.94 | 18.26 | 9.67 | 56.81 |
| LIVINGTRUST | 21.00 | 14.72 | 4.33 | 54.83 |
| CHAMS | 61.43 | 11.51 | -1.74 | 57.49 |
| Stock | YTD %Chg | 1D % | RSI |
|---|---|---|---|
| GREENWETF | -56.84 | -9.99 | 47.18 |
| CHAMPION | -53.00 | -4.26 | 54.40 |
| OMATEK | -52.50 | 0.00 | 48.47 |
| INTBREW | -17.27 | -4.17 | 49.33 |
| ROYALEX | -93.64 | -3.62 | 52.58 |
Insights & Predictions
- Turnover Drop: A -47.53% drop in turnover on a barely lower ASI and nearly balanced breadth may signal consolidation—investors are pausing after strong YTD gains, possibly awaiting new catalysts.
- Advancers/Decliners: Slightly more decliners, but the gap is minimal, and gainers’ magnitude (many >9%) continues to suggest strong pockets of momentum, especially in financials and technical outperformers.
- Unusual Volumes:
- ETRANZACT stands out—volume up +1633% vs its 90-Day avg, with strong price follow-through, suggesting ongoing institutional interest.
- GUINNESS also saw a significant +586% surge, rising +6.92%: new institutional demand could push this further if sentiment persists.
- UNILEVER and NSLTECH flagged with volumes up more than 150% – possible accumulation phase for both.
- Momentum Stocks
- Bullish Momentum: EUNISELL, NEWGOLD ETF, JAIZBANK, and WAPIC – all closed above their 15DMA, indicating buying pressure. Notably, none have extreme RSI (>70), so potential for further upside remains.
- Bearish Momentum: SOVRENINS, FIDELITYBK, UBA, FTNCOCOA and DEAPCAP all broke below their 15DMA—some overlap with top daily losers. Persistent declines in UBA and FIDELITYBK warrant close watch as both are bellwether financials.
- Overlaps: FTNCOCOA and DEAPCAP appear both among top daily losers and bearish momentum stocks—a warning sign of accelerating downside.
- Technical Overbought/Oversold:
- No trigger stocks today in extreme RSI zones (≥70 or ≤30). However, ETRANZACT is near, with RSI at 65.7 and clear MACD bullish cross, suggesting trend-following investors could still find opportunities as momentum builds.
Contrarian Signals
-
CHAMPION (CHAMPION BREW PLC):
- RSI at 54.4 (neutral); -53.0% YTD and -4.26% today.
- Bullish MACD crossover forms despite persistent YTD decline.
- Suggests short-term buy interests are emerging in a battered stock. Contrarian traders could monitor for potential mean-reversion plays if volume increases. -
REGALINS:
- YTD gain 117.5%, but today’s drop -4.40% and a high RSI (61.02) raise the possibility of profit-taking after a strong run. -
GREENWETF:
- Deep YTD fall -56.84%, RSI only 47 (not oversold), continuing to show bearish MACD – avoids a dead-cat bounce for now.
Sector Heatmap
| Sector | Advancers | Decliners | Total Value (₦bn) | Technical Trend |
|---|---|---|---|---|
| Banking | 4 | 6 | 5.23 | Bearish: UBA, FIDELITYBK (Below 15DMA), moderate RSI |
| Insurance | 3 | 2 | 1.11 | Mixed: REGALINS (strong YTD), WAPIC (above 15DMA) |
| Industrial | 2 | 2 | 0.35 | CUSTODIAN strong above 15DMA, spurring bullish sentiment |
| Consumer | 2 | 3 | 0.49 | UNILEVER, GUINNESS show high volume; possible sector rotation |
| ETF / Specialty | 1 | 2 | 2.15 | GREENWETF deep slump continues |
Dividend-Beta Matrix: Defensive Play Opportunities
| Stock | Div. Yield (%) | Beta | Comment |
|---|---|---|---|
| FIDELITYBK | 5.48 | 0.89 | High yield, below 1 beta (defensive profile), but currently bearish momentum |
| UBA | 5.96 | 1.56 | High yield, but higher beta and bearish signal today |
| WAPIC | 2.56 | 0.76 | Above 15DMA, moderate yield, stable beta—longer-term potential. |
| SOVRENINS | 3.75 | 1.12 | Bearish (below 15DMA), but decent yield and near-market risk |
| AFRIPRUD* | 1.27 | 0.64 | Defensive, but out of today’s momentum stocks. |
*AFRIPRUD from context; not in today’s leaders but included for defensive monitoring.
Institutional Clustering Alerts
- ZENITHBANK: Institutions accounted for 20.2% of institutional value traded today (₦1.13B), with top 5 institutional trade value concentrated in UBA, ZENITHBANK, MTNN, ARADEL, GTCO.
- UBA: Heaviest by institutional volume, but also among the day’s notable losers and with downward momentum – potential institutional rotation or short-term exit.
- GTCO/MTNN: Both feature strongly in both institutional and retail most-traded lists—points to wide institutional AND retail interest. Monitor closely for volatility spikes.
Stocks with High Dividend Yield in Bullish/Bearish Tables
- SOVRENINS has a 3.75% yield but appeared in the bearish momentum table, suggesting caution—yield chasers could see further price hits if the bearish trend persists.
- FIDELITYBK (5.48% yield, Beta 0.89) looks attractive fundamentally, but technical breakdown (price below 15DMA) warns of more near-term downside. Value investors may want to wait for technical stabilization before entry.
- UBA offers high yield (5.96%) but also below 15DMA and losing short-term momentum.
Trading Suggestions
- Bulls: ETRANZACT’s barrage of volume and multi-week outperformance, coupled with a bullish MACD and strong RSI, make it a prime candidate for trend followers—but watch for profit-taking as RSI nears 70.
- Bears: FTNCOCOA, DEAPCAP, GREENWETF are caught in falling price/volume momentum; short sellers or exit strategies may be prudent.
- Contrarians: Consider CHAMPION—unloved all year, but technicals are bottoming. Watch for confirmed reversal with higher volume and price holding above key moving averages.
- Monitor high dividend yield names with caution if in current technical downtrends; for long-term, accumulating in tranches may be prudent.
- Institutional concentration in ZENITHBANK, UBA, and GTCO means newsflow or large block trades here could drive near-term market direction.
- Avoid chasing momentum in low-volume, illiquid stocks; prefer names where technicals and volume support the move.
Trade Flow & Activity Summary
- Institutionals made up 54.7% of today’s market volume and a dominant 85.7% of market value, versus retail at 14.3%.
- Top 5 Institutional Trades: UBA, ZENITHBANK, MTNN, ARADEL, GTCO — all large caps, heavy in banking and telecoms.
- Top 5 Retail Trades: UBA, ZENITHBANK, MTNN, ACCESSCORP, GTCO — retail is crowding into the same set as institutions (especially financials), suggesting either heavy retail-to-institutional flows or echo trading.
- Pattern Insights:
- Stocks with both retail and institutional heavy flow (UBA, ZENITHBANK, GTCO, MTNN) could see outsized volatility as both camps reposition.
- This clustering increases the potential for sharp moves on news or technical triggers.
Hidden Insights: Several YTD leaders (ETRANZACT, MULTIVERSE) continue to attract volume, while technical weakness among some high-dividend financials presents a tactical caution for yield-seeking investors. With institutions dominating trade value but retail remaining active in the same large-cap names, volatility in the largest banks is likely to remain elevated. Monitor technical signals closely—momentum is shifting, and patience may be rewarded as clarity emerges.
|
Top ASI Gainers Over Last 5 Trading Days
|
Top ASI Losers Over Last 5 Trading Days
|
For more detailed analysis, on InfoWARE Market Data Terminal <NSEPERF> <GO>
On InfoWARE Finance Mobile App (Android, iPhone & iPad, Windows Phone and Windows 8/10), "Top Gainers & Losers"
CUSTODIAN AND ALLIED PLC (CUSTODIAN) topped the advancers list closing at N44.80 with a gain of 9.94% followed by MULTIVERSE PLC (MULTIVERSE) which closed at N13.60 with a gain of 9.68%.
On the flip side GREENWICH ASSET ETF (GREENWETF) and AUSTIN LAZ & COMPANY PLC (AUSTINLAZ) topped the decliners log with a loss of -10.00% at a close of N230.45, and -6.27% to close the day at N2.69 respectively.
| Symbol | LClose | %Chg |
|---|---|---|
| CUSTODIAN | 44.80 | 9.94 |
| MULTIVERSE | 13.60 | 9.68 |
| ETRANZACT | 17.95 | 9.45 |
| EUNISELL | 27.80 | 9.45 |
| UNIONDICON | 10.30 | 8.42 |
For more detailed analysis,
- On InfoWARE Market Data Terminal <TOPG> <GO>
- On InfoWARE Finance Mobile App ( Android, iPhone & iPad and Windows 10) , "Top Gainers & Losers"
Currency Market
In the currency market, the Naira was unchanged against the dollar at 1 to 1NSE: Bull Signal - Price crossed above 15 Day MA
This signal implies these stocks are under buying pressure and the price might continue to rise and therefore positions should be monitored closely. Further suggested analysis include looking at the overall market (ASI) to see if the uptrend is market wide, sector wide or specific to the stock. Portfolio managers tend to use this as a signal to do more research to add to their positions or lock in some profits. Typically further analysis should be done using commands like PC and RV on the InfoWARE Market Data Terminal. Another command is ALERTS to set price triggers for possible exit or entry as necessary
For more detailed analysis,
- On InfoWARE Market Data Terminal <NSEPERF> <GO>
- On InfoWARE Finance Mobile App ( Android , iPhone & iPad and Windows 10) , "Top Gainers & Losers"
| Symbol | Price | %Chg | 15DMA | PE | EPS | DivY | MktCap | Vol | Trades | Value | LstTradeTime |
|---|---|---|---|---|---|---|---|---|---|---|---|
| FGSUK2031S4 | 96.94 | 24.65 | 81.33 | 0.00 | 0.00 | 1.00 | 1.00 | 969.40 | 16-Sep-2025 14:30:26.453 | ||
| EUNISELL | 27.80 | 8.63 | 25.59 | 0.00 | 0.00 | 0.31 | 6.58B | 268.29K | 25.00 | 7.37M | 16-Sep-2025 14:30:22.710 |
| NEWGOLD | 55,400.00 | 5.23 | 53,420.08 | 0.00 | 0.00 | 0.00 | 0.00 | 7.00 | 5.00 | 371.50K | 16-Sep-2025 14:30:24.033 |
| VETBANK | 15.25 | 1.64 | 15.14 | 0.00 | 0.00 | 5.00 | 1.00 | 76.25 | 16-Sep-2025 14:30:24.057 | ||
| JAIZBANK | 4.58 | 1.53 | 4.51 | 83.05 | 0.03 | 1.67 | 158.20B | 6.99M | 524.00 | 32.01M | 16-Sep-2025 14:30:26.293 |
| WAPIC | 3.50 | 1.43 | 3.48 | 72.55 | 0.02 | 2.56 | 83.97B | 1.21M | 76.00 | 4.23M | 16-Sep-2025 14:30:11.250 |
| VFDGROUP | 11.10 | 0.90 | 11.01 | 0.00 | 0.00 | 0.00 | 0.00 | 3.45M | 218.00 | 38.09M | 16-Sep-2025 14:30:11.227 |
| FG192053S3 | 98.38 | 0.00 | 98.38 | 0.00 | 0.00 | 0.00 | 0.00 | 0.00 | 16-Sep-2025 14:30:12.117 |
NSE: BEAR Signal - Price crossed below 15 Day MA
This signal implies these stocks are under selling pressure and the price might continue to slide and therefore positions should be monitored closely. Further suggested analysis include looking at the overall market (ASI) to see if the downtrend is market wide, sector wide or specific to the stock. If the overal market trend is upwards, then since these stocks are heading in the opposite direction, then further analysis should be done using commands like PC and RV on the InfoWARE Market Data Terminal. Another command is ALERTS to set price triggers for possible exit is necessar
For more detailed analysis,
- On InfoWARE Market Data Terminal <BEARM> <GO>
- On InfoWARE Finance Mobile App ( Android , iPhone & iPad and Windows 10)
| Symbol | Price | %Chg | 15DMA | PE | EPS | DivY | MktCap | Vol | Trades | Value | LstTradeTime |
|---|---|---|---|---|---|---|---|---|---|---|---|
| SOVRENINS | 2.85 | -1.05 | 2.86 | 27.95 | 0.03 | 3.75 | 32.39B | 2.11M | 123.00 | 6.21M | 16-Sep-2025 14:30:10.950 |
| FIDELITYBK | 20.55 | -2.19 | 20.95 | 13.24 | 1.17 | 5.48 | 595.43B | 7.77M | 812.00 | 162.33M | 16-Sep-2025 14:30:07.960 |
| UBA | 47.25 | -2.33 | 47.66 | 8.29 | 4.05 | 5.96 | 1,615.92B | 26.22M | 1,479.00 | 1.24B | 16-Sep-2025 14:30:24.163 |
| FTNCOCOA | 5.90 | -5.08 | 6.10 | 0.00 | 0.00 | 1.60 | 23.01B | 1.06M | 155.00 | 6.24M | 16-Sep-2025 14:30:08.020 |
| DEAPCAP | 1.70 | -5.88 | 1.75 | 188.84 | 0.01 | 13.76 | 2.55B | 1.16M | 40.00 | 1.99M | 16-Sep-2025 14:30:07.710 |
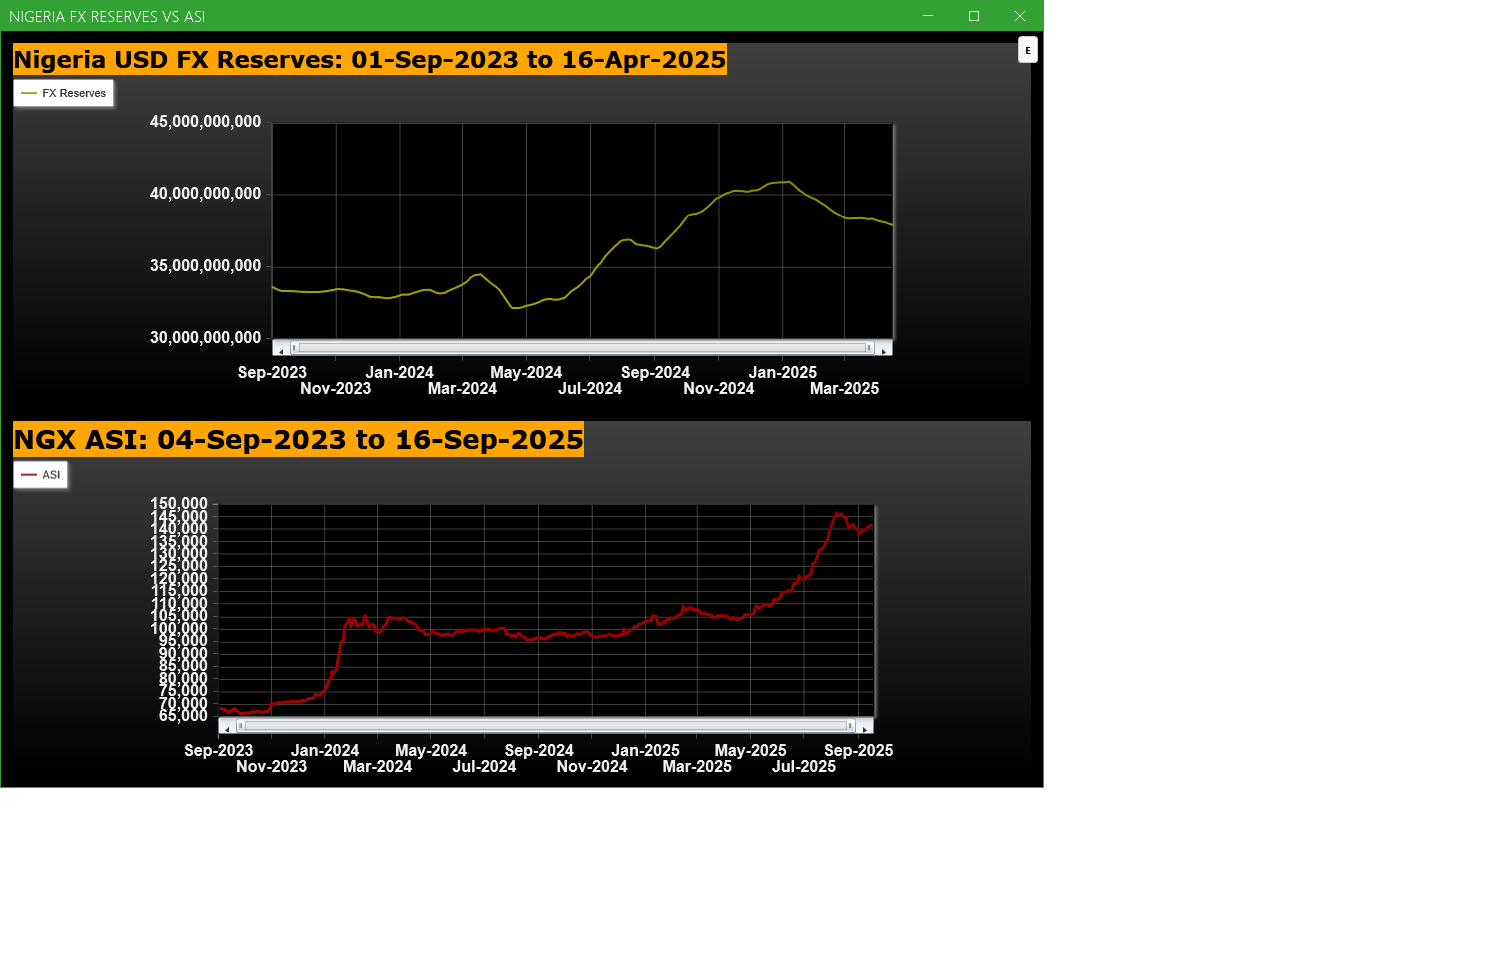
Economic Indicators - Nigeria FX Reserves Vs ASI Chart
Nigeria FX Reserves are assets held on reserve by CBN in foreign currencies. These reserves are used to back liabilities and influence monetary policy. Given the nature of the Nigeria economy, FX Reserves can appear to have an outsize influence on the economy and hence on the capital market. The chart below allows comparison of FX Reserves against the ASI to make investment decisions
For more detailed analysis,
- On InfoWARE Market Data Terminal <CI> <GO>
- On InfoWARE Finance Mobile App ( Android , iPhone & iPad and Windows 10) , "Research"
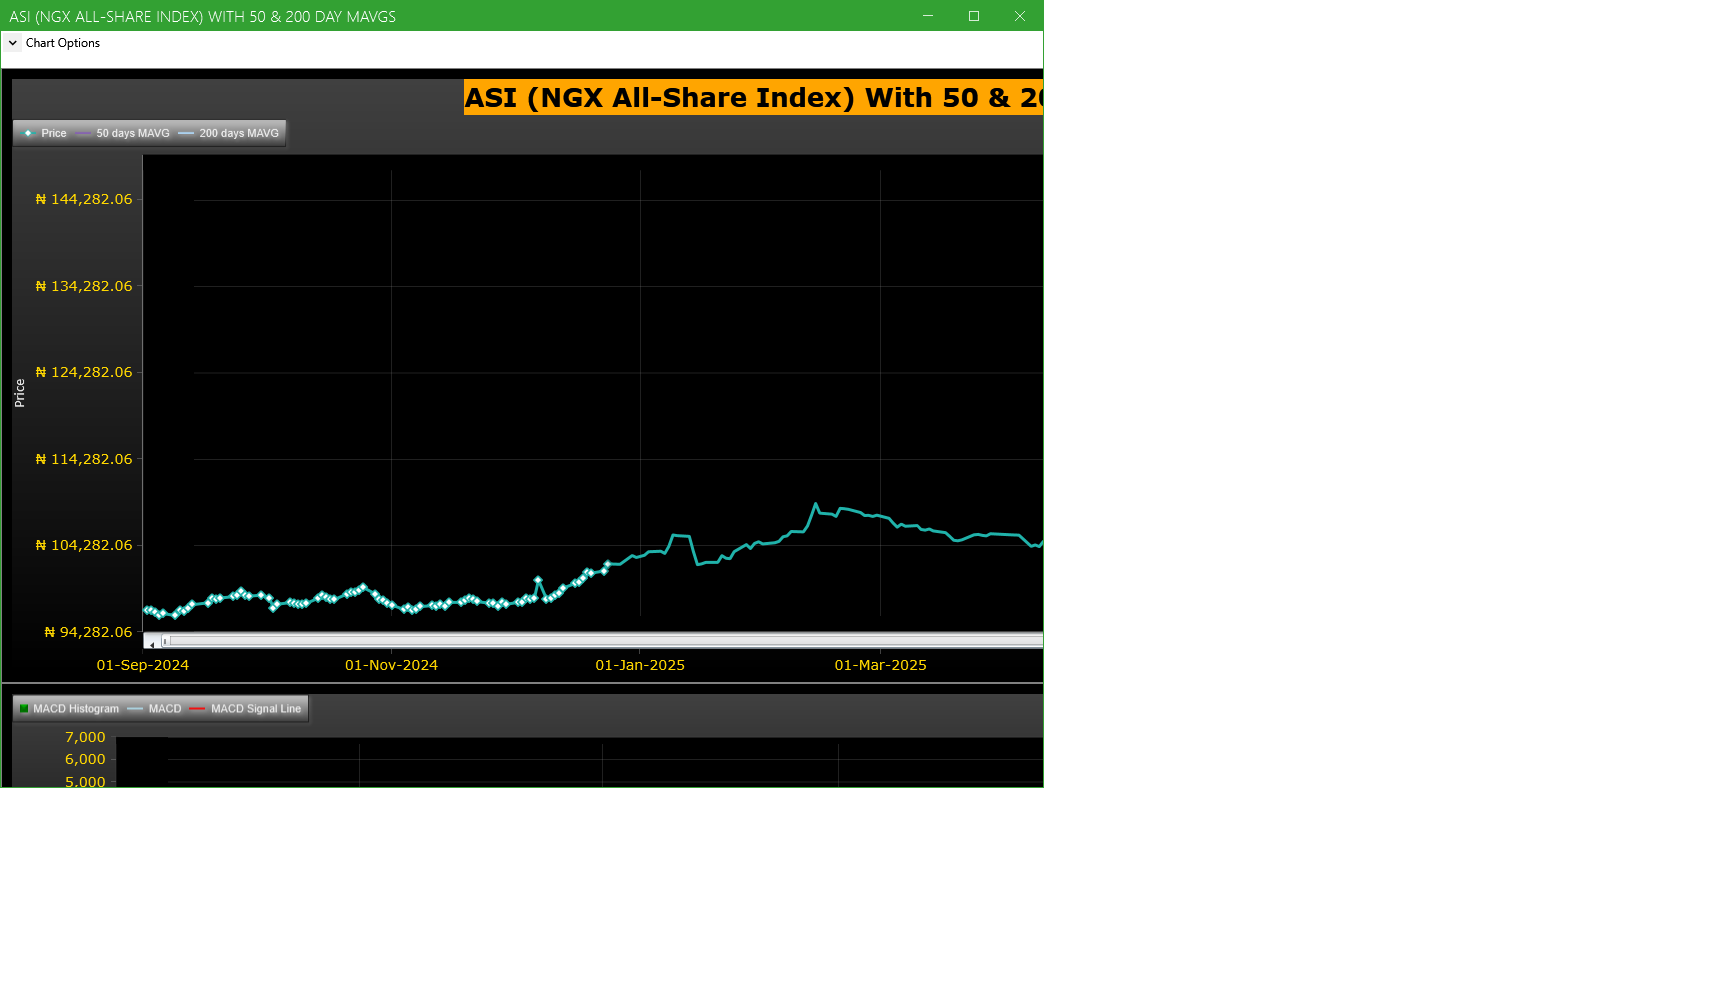
Market Trend - ASI (NGX All-Share-Index) With 50 & 200 Day MAvgs Chart
Technical traders typically use the 50 & 200 day moving averages to aid in choosing
where to enter or exit a position, which then causes these levels to act as strong
support or resistance. As a general guideline, if the price is above a moving average,
the trend is up. If the price is below a moving average, the trend is down.
It is important to note that critics of technical analysis say that moving averages act
as support and resistance because so many traders use these indicators to inform their
trading decisions. Also moving averages tend to work quite well in strong trending conditions
but poorly in choppy or ranging conditions.
Trading Strategies: Crossovers
Crossovers are one of the main moving average strategies. The first type is a price crossover,
which is when the price crosses above or below a moving average to signal a potential change
in trend. Another strategy is to apply two moving averages to a chart: one longer and one
shorter. When the shorter-term MA crosses above the longer-term MA, it is a buy signal, as
it indicates that the trend is shifting up. This is known as a golden cross. Meanwhile, when
the shorter-term MA crosses below the longer-term MA, it is a sell signal, as it indicates that
the trend is shifting down. This is known as a dead/death cross
For more detailed analysis,
- On InfoWARE Market Data Terminal <CI> <GO>
- On InfoWARE Finance Mobile App ( Android , iPhone & iPad and Windows 10) , "Research"
Unusual Volume: Volume traded is more than double the 90 day moving average (All exchanges; ASI & ASem). For more detailed analysis,
- On InfoWARE Market Data Terminal <UV> <GO>
- On InfoWARE Finance Mobile App ( Android , iPhone & iPad and Windows 10)
| Symbol | Name | Volume | 90DAvgVol | %VolChg | Price | LClose | %Chg | Trades | Value |
|---|---|---|---|---|---|---|---|---|---|
| NSLTECH | SECURE ELECTRONIC TECHNOLOGY PLC | 32.49M | 11.04M | 194.25 | 0.82 | 0.83 | -1.20 | 225 | 26.37M |
| OMATEK | OMATEK VENTURES PLC | 14.43M | 5.53M | 161.16 | 1.22 | 1.22 | 0.00 | 226 | 17.36M |
| ETRANZACT | E-TRANZACT INTERNATIONAL PLC | 9.26M | 534.38K | 1,633.21 | 17.95 | 16.40 | 9.45 | 774 | 163.32M |
| GUINNESS | GUINNESS NIG PLC | 3.81M | 555.24K | 586.29 | 152.90 | 143.00 | 6.92 | 191 | 561.11M |
| UNILEVER | UNILEVER NIGERIA PLC. | 1.96M | 732.90K | 167.75 | 73.00 | 72.80 | 0.27 | 154 | 143.33M |
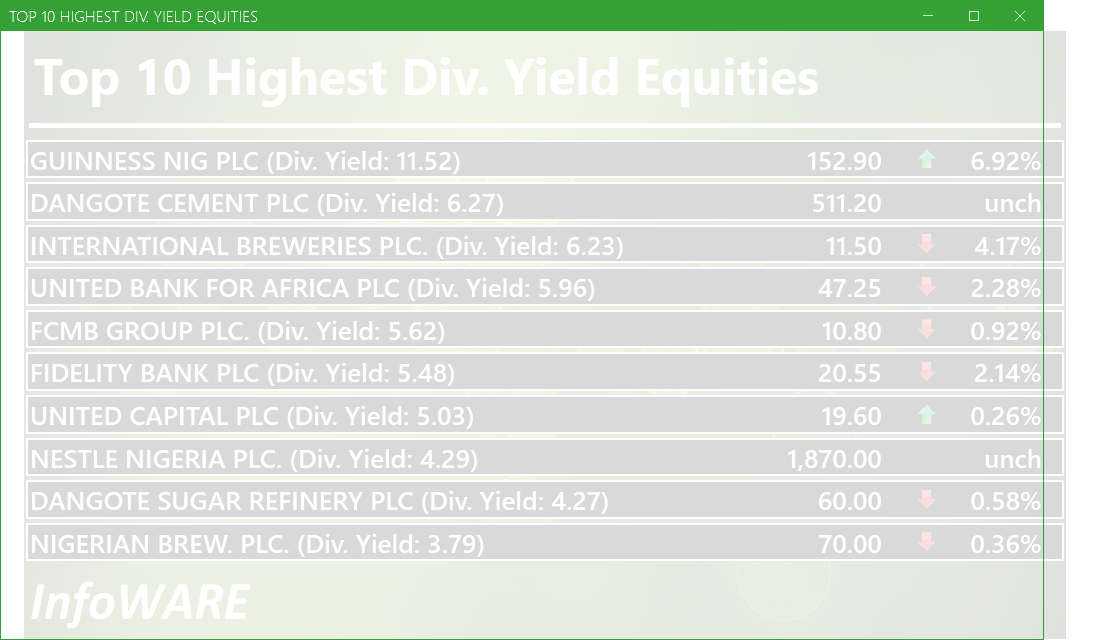
Investment Insights - High Div. Stocks
Dividend stocks distribute a portion of the company earnings to investors on a regular basis and they can a great choice for investors looking for regular income. As an investment or trading strategy, high dividend yield equities provide annual cash payments as against mostly capital gains in the price of a stock. The list in the table below represent the highest dividend paying stocks from the list of the most liquid stocks in the NSE top 30.
For more detailed analysis,
- On InfoWARE Market Data Terminal <HYIELD> <GO>
- On InfoWARE Finance Mobile App ( Android , iPhone & iPad and Windows 10) , "Research"
African Markets
| Name | LClose | Change | %Chg |
|---|---|---|---|
| BRVM Stock Exchange | 322.09 | 0.42 | 0.13 |
| Botswana Stock Exchange | 10,611.86 | 0.00 | 0.00 |
| Egyptian Exchange | 35,165.84 | 52.67 | 0.15 |
| Ghana Stock Exchange | 7,316.08 | 46.53 | 0.64 |
| Johannesburg Stock Exchange | 104,675.38 | 219.36 | 0.21 |
| Lusaka Stock Exchange | 24,757.57 | 81.43 | 0.33 |
| Casablanca Stock Exchange | 19,609.77 | -220.11 | -1.11 |
| Malawi Stock Exchange | 561,198.78 | 11,111.76 | 2.02 |
| Nigeria Stock Exchange | 141,659.00 | 1,110.33 | 0.79 |
| Nairobi Securities Exchange | 179.02 | 0.32 | 0.18 |
| Namibian Stock Exchange | 1,904.83 | -2.86 | -0.15 |
| Rwanda Stock Exchange | 179.11 | 0.00 | 0.00 |
| Tunis Stock Exchange | 12,154.13 | 80.89 | 0.67 |
| Uganda Securities Exchange | 1,444.64 | 2.60 | 0.18 |
Nigeria Market Indexes
| Symbol | LClose | %Chg | WTD% | MTD% | QTD% | YTD% | MktCap | Trades |
|---|---|---|---|---|---|---|---|---|
| ASI | 141,546.78 | -0.08 | -0.08 | 1.31 | 18.21 | 37.18 | 23,951 | |
| NGX30 | 5,155.53 | -0.15 | -0.15 | 1.15 | 9.14 | 35.14 | 12,527 | |
| NGXAFRBVI | 3,581.49 | -0.22 | -0.22 | 2.76 | 1.07 | 44.37 | 5,094 | |
| NGXAFRHDYI | 22,963.98 | -0.06 | -0.06 | 1.92 | 9.80 | 34.86 | 5,927 | |
| NGXASEM | 1,538.10 | 0.00 | 0.00 | 0.00 | -3.57 | -2.88 | 4 | |
| NGXBNK | 1,526.70 | -0.30 | -0.30 | 1.01 | 1.05 | 40.40 | 5,979 | |
| NGXCG | 4,078.54 | -0.09 | -0.09 | 1.09 | 18.61 | 44.16 | 12,546 | |
| NGXCNSMRGDS | 3,283.57 | -0.39 | -0.39 | 2.95 | -5.34 | 89.32 | 3,277 | |
| NGXCOMMDTY | 1,096.56 | 0.00 | 0.00 | 2.67 | 4.71 | 9.65 | ||
| NGXGROWTH | 12,640.44 | 0.81 | 0.81 | 12.86 | 32.93 | 62.83 | 289 | |
| NGXINDUSTR | 4,926.22 | 0.00 | 0.00 | -0.13 | 39.83 | 37.93 | 1,807 | |
| NGXINS | 1,299.72 | -0.58 | -0.58 | 1.31 | 75.97 | 65.32 | 2,039 | |
| NGXLOTUSISLM | 11,699.50 | 0.03 | 0.03 | 2.46 | 22.19 | 67.91 | 4,099 | |
| NGXMAINBOARD | 6,914.97 | -0.05 | -0.05 | 1.89 | 17.22 | 38.19 | 17,658 | |
| NGXMERIGRW | 10,051.99 | 0.01 | 0.01 | 0.37 | 4.14 | 54.09 | 3,262 | |
| NGXMERIVAL | 13,694.78 | -0.25 | -0.25 | 2.43 | 14.62 | 31.30 | 6,677 | |
| NGXOILGAS | 2,420.47 | 0.14 | 0.14 | 2.10 | 1.18 | -10.72 | 352 | |
| NGXPENBRD | 2,632.79 | 0.01 | 0.01 | 1.64 | 14.50 | 43.74 | 19,593 | |
| NGXPENSION | 6,699.90 | -0.10 | -0.10 | 1.21 | 5.43 | 47.77 | 14,209 | |
| NGXPREMIUM | 13,786.48 | -0.16 | -0.16 | 0.18 | 20.20 | 41.65 | 6,004 | |
| NGXSOVBND | 654.78 | 0.00 | 0.00 | -0.62 | 0.19 | 8.85 | 0 |
For more detailed analysis,
- On InfoWARE Market Data Terminal <MKTINS> <GO>
- On InfoWARE Finance Mobile App ( Android, iPhone & iPad and Windows 10) , "Market Indexes"
Find the topic interesting? Will like to comment? Contact Us at solutions@infowarelimited.com
Top News

Chart Of The Day - ASI Chart Vs ASI Advance Decline Line (YTD) (16-Sep-2025 15:06:43.632)
InfoWARE AI Analyst Daily Market Report: 16-Sep-2025

[VSPBONDETF]>> DAILY INDICATIVE PRICES
[XNSA]>> CHAMS HOLDING COMPANY PLC: EXTENSION FOR TRADING IN RIGHTS
[XNSA]>> CORDROS MILESTONE FUNDS' BID & OFFER PRICES
[XNSA]>> NGX FIXED INCOME INDICATIVE PRICE LIST FOR SEP 16, 2025
[XNSA]>> REGISTRATION FOR BATCH TWO- 2025 DEALING CLERKSHIP CERTIFICATION PROGRA
[XNSA]>> UPDATED- SAVE THE DATE: 29TH ANNUAL STOCKBROKERS CONFERENCE
Chart Of The Day - ASI Chart Vs ASI Advance Decline Line (YTD) (15-Sep-2025 15:09:04.617)
InfoWARE AI Analyst Daily Market Report: 15-Sep-2025
[MERVALUE]>> DAILY INDICATIVE PRICES
[XNSA]>> CORDROS MILESTONE FUNDS' BID & OFFER PRICES
[VSPBONDETF]>> DAILY INDICATIVE PRICES
[XNSA]>> NGX FIXED INCOME INDICATIVE PRICE LIST FOR SEP 15, 2025
[XNSA]>> DAILY FUND PRICE SUBMISSION - FCMB ASSET MANAGEMENT LIMITED
[XNSA]>> REGISTRATION FOR BATCH TWO- 2025 DEALING CLERKSHIP CERTIFICATION PROGRA
[XNSA]>> UPDATED- SAVE THE DATE: 29TH ANNUAL STOCKBROKERS CONFERENCE
[XNSA]>> LISTING OF NGX30H6 AND NGXPENSIONH6 FUTURES CONTRACTS
[SIAMLETF40]>> DAILY INDICATIVE PRICES
[XNSA]>> NOTIFICATION OF PRICE ADJUSTMENT
InfoWARE AI Analyst Weekly Market Report: 12-Sep-2025
Chart Of The Day - ASI Chart Vs ASI Advance Decline Line (YTD) (12-Sep-2025 15:10:12.694)
InfoWARE AI Analyst Daily Market Report: 12-Sep-2025
[MERGROWTH]>> DAILY INDICATIVE PRICES
[VETINDETF]>> DAILY INDICATIVE PRICES
[XNSA]>> NGX FIXED INCOME INDICATIVE PRICE LIST FOR SEP 12, 2025
[XNSA]>> REGISTRATION FOR BATCH TWO- 2025 DEALING CLERKSHIP CERTIFICATION PROGRA
[XNSA]>> UPDATED- SAVE THE DATE: 29TH ANNUAL STOCKBROKERS CONFERENCE
[XNSA]>> CLOSING GONG CEREMONY IN HONOUR OF ISSB DELEGATION
[SIAMLETF40]>> DAILY INDICATIVE PRICES
Get IDIA - the stock trading app for the modern investor
Solutions by Business
Product Suites
Company
Contacts
- 8th Floor,
- South Atlantic Petroleum Towers,
- 1 Adeola Odeku Street,
- Victoria Island,
- Lagos, Nigeria.
- Email: solutions@infowarelimited.com
Follow Us
 |
 |
 |
 |