


InfoWARE AI Analyst Daily Market Report: 07-Oct-2025 | InfoWARE Finance
Get IDIA - the stock trading app for the modern investor


InfoWARE AI Analyst Daily Market Report: 07-Oct-2025
(Source: InfoWARE Terminal, Date: 07-Oct-2025)
Dear Investor,
NGX Daily Market Summary – Tuesday, October 7, 2025
Today, the Nigerian Exchange (NGX) All Share Index (ASI) closed at 144,822.78, inching up by +0.12%. The index continues its impressive Year-To-Date (YTD) journey, now boasting a cumulative return of +40.53%. Despite the positive index movement, market turnover slid by -17.45% to ₦10.72B, while trading volume softened to 468.80M shares. Market breadth was narrowly positive at 1.03x, with 41 advancers to 40 decliners, signaling a highly contested session. The insurance sector came alive, propelling CORNERSTONE INSURANCE PLC (CORNERST, +9.92%) to the top as today’s best performer, while CONSOLIDATED HALLMARK INSURANCE PLC (CONHALLPLC, -9.52%) suffered the steepest fall. Both also signaled bullish momentum, supported by 15DMA breakouts.
Amid these undercurrents, remarkable activity emerged in select names, with several stocks flashing strong, and at times, contradictory signals across technical, volume, sectoral, and smart money (institutional vs retail) metrics.
-
Market Breadth & Trends:
- Advancers narrowly outpaced decliners (41 vs 40); overall market breadth at 1.03x—indicative of hesitancy or consolidation in the short run.
- Volume rose in 71 stocks and fell in 67—volume dispersion reflects selective participation rather than broad-based exuberance.
- Turnover’s sizable drop (-17.45%) typically forewarns a near-term volatility lull or brewing reversal risk—watch for a possible pause or even profit-taking into Wednesday’s session.
-
Top Gainers:
- CORNERSTONE INSURANCE PLC (CORNERST): +9.92% to ₦6.65. RSI at 47.58, robust 9% price move, and close above 15DMA indicate emerging bullish trend. Insurance sector standout, supported by bullish technicals and strong relative volume.
- CHAMS PLC: +9.22%, YTD return at a stunning +120%, RSI rising to 66.25, bullish MACD, and dramatically up over the last week—momentum remains formidable (see YTD chart below).
- VFD GROUP PLC: +9.17%, signaling appetite for financials outside main banks.
- INTENEGINS: +8.82%; just below mid-level RSI, small cap insurance with technical breakout implications.
-
Top Losers:
- NEWGOLD ETF: -11.01%, continues its YTD slump (-11.32%), and triggered a major technical breakdown—sends retreat signal for "hard asset” fans; staggering MACD divergence flags ongoing downtrend.
- LIVINGTRUST MORTGAGE BANK: -10.0% (RSI 69.2): An example of overbought profile breaking down abruptly, reinforcing caution post-euphoria.
- AUSTIN LAZ & COMPANY: -9.74%, high RSI (65.2) but steeper losses—hinting at failed breakout or profit-taking after recent run-up.
YTD Top 5 Gainers & Losers
| YTD Top 5 Gainers | ||||||
|---|---|---|---|---|---|---|
| Stock | Price | YTD % | 5D % | RSI | MACD | DivYield |
| CHAMS PLC | 4.23 | +120.0% | +28.7% | 66.3 | 0.27 | 1.56% |
| SOVRENINS | 3.02 | +151.2% | +13.6% | 53.4 | 0.087 | 3.75% |
| MANSARD | 15.84 | +88.5% | +18.1% | 52.9 | 0.003 | 4.59% |
| WEMABANK | 19.80 | +119.8% | +15.6% | 50.1 | -0.71 | 5.81% |
| ELLAHLAKES | 14.81 | +388.4% | +20.0% | 58.1 | 0.10 | 0.00% |
| YTD Top 5 Losers | ||||||
|---|---|---|---|---|---|---|
| Stock | Price | YTD % | 5D % | RSI | MACD | DivYield |
| THOMASWY | 2.99 | -57.9% | -16.2% | 49.7 | 0.13 | 1.05% |
| NEWGOLD | 57,799 | -11.3% | -11.3% | 54.8 | 731.6* | 0.00% |
| MERVALUE | 161.28 | -19.2% | -10.0% | 38.2 | -5.40 | 0.00% |
| MCNICHOLS | 3.20 | -99.4% | -9.58% | 44.9 | -0.00 | 5.88% |
| JOHNHOLT | 7.20 | -7.6% | -9.43% | 46.7 | 0.16 | 1.25% |
Momentum Watchlist (Bullish & Bearish Candidates)
| Stock | Direction | Last Price | 15DMA | 50DMA | RSI | MACD | Signal Notes |
|---|---|---|---|---|---|---|---|
| CORNERST | Bullish | 6.65 | 6.29 ▲ | 6.46 | 47.6 | -0.09 | Pierced 15DMA; Moderate RSI. Early trend with room to run. |
| CONHALLPLC | Bullish | 4.37 | 4.04 ▲ | 4.16 | 49.6 | -0.01 | Breaks 15DMA; near neutral RSI, possible continuation if sector holds bid. |
| NEWGOLD | Bearish | 51,433 | 53,770 ▼ | 54,049 | 54.8 | 731.6 | Below both moving averages; breakdown with volume drain. |
| FIDELITYBK | Bearish | 20.05 | 20.44 ▼ | n/a | 13.2 | - | Accelerated loss; RSI at low end indicaing oversold risk short term. |
| TANTALIZER | Bearish | 2.32 | 2.43 ▼ | 2.51 | 51.8 | 0.0049 | Ongoing selling pressure in hospitality; below 15/50DMA. |
-
Hidden Insights:
- Noticeable overlap: CHAMS PLC tops both daily and YTD gainers, and is near bullish RSI territory (66.3), MACD positive and rising, and has consistently traded above its 15DMA—momentum remains strong.
- NEWGOLD ETF stands out as top loser both today and YTD; momentum remains decisively negative, possibly reflecting shifting macro expectations, profit taking, or exogenous catalyst.
- Stocks with price closing above 15DMA (bullish)—all have moderate to slightly elevated RSI, suggesting further upside is possible (not yet overbought).
- Bullish momentum (based on 15DMA/50DMA and RSI): Momentum leaders are beginning runs at sustainable, rather than "blow-off” levels. This appears conducive for swing trades but may favor scaling in over chasing.
- Bearish momentum (closing below 15DMA): Several stocks (NEWGOLD, FTNCOCOA, TANTALIZER, etc.) have RSI readings closer to midline (not yet oversold), implying more downside may yet materialize before mean-reversion buyers emerge.
Contrarian Signals
- CHAMS PLC: Despite an RSI of 66.3 (approaching overbought), price and MACD remain strongly positive, and it leads the gainers. Momentum traders may ride further, but risk of a snapback grows. Contrarian traders could start monitoring for topping signals.
- LIVINGTRUST: RSI at 69.2 (almost overbought levels) while experiencing a sudden -10% drop – a classic complacency-to-correction pattern; that can sometimes trigger further downside.
- NEWGOLD ETF: Rare combination of high RSI (54.8), huge negative MACD, and ongoing price breakdown; continued ETF selling despite technical strength is a red flag.
Sector Heatmap Comparison
| Sector | Perf. Today | Volume Change | Retail/Inst. Activity | Bullish/Bearish Notes |
|---|---|---|---|---|
| Insurance | Strong + | Rising (CORNERST, CONHALLPLC) | Mixed/High | Top 2 daily gainers both flashed bullish 15DMA crossovers |
| Banking | Mostly Flat/Weak | Mixed | Access, GTCO, Sterling | Retail highly active; Fidelity, Zenith slipping (bearish crossovers) |
| ETFs/Other | Weak | Shrinking (NEWGOLD selloff) | Institutional | ETF momentum breakdown, possibly a rotation out of defensive assets |
| Food Products | Mixed | Up (MCNICHOLS unusual volume +452%) | Retail | Unusual volume triggers, but price remains soft overall |
| Energy | Up | Skyrocketing (ARADEL, +600%) | Institutional Heavy | ARADEL dominated value/trade; possible institutional repositioning |
Dividend–Beta Matrix: Defensive Opportunities
| Stock | Dividend Yield | Beta | YTD Perf | Momentum Signal | Comment |
|---|---|---|---|---|---|
| MANSARD | 4.59% | 0.62 | +88.5% | Bullish (near YTD highs, 18% 5D gain) | Low beta, high yield—appealing for cautious swing traders |
| WEMABANK | 5.81% | 1.25 | +119.8% | Strong, but high beta = riskier for defensive portfolios | |
| SOVRENINS | 3.75% | 1.12 | +151.2% | Bullish (13.6% 5D gain, MACD positive) | Yield and momentum, but higher beta—watch risk |
| FTNCOCOA | 1.60% | 0.79 | -193.1% | Bearish (below 15DMA/50DMA, soft RSI) | High yield but technicals weak; avoid chasing yield alone |
Institutional Clustering Alerts
- ARADEL: Dominated institutional activity (22.46M shares, +600% vs 90D avg), representing over 52.7% of institutional value traded. Unusual institutional concentration and value—possible insider-driven or pipeline event.
- ZENITHBANK: Accounted for 20.17% of institutional value trade (₦368M+). Technicals diverged (trending down, -0.58% today), watch for support at moving averages.
- ACCESSCORP: High in both retail and institutional trade tables; neutral/flat price, suggesting "hand off” or accumulation in progress.
- ELLAHLAKES: Significant in both retail and institutional volumes. High volatility, YTD momentum, suggests continued speculative attention.
-
High Dividend Yield Crosschecked with Momentum Tables:
- MANSARD: Yield at 4.59%, high YTD and 5D gain, technicals still bullish—blend of defense and offense.
- FTNCOCOA: High yield, but sits on bearish momentum table—dividend trap risk; wait for reversal signal before considering as defensive play.
- Note: Many high dividend stocks (like SOVRENINS, WEMABANK) also have high beta—defensive investors should confirm risk appetite before entry.
Tuesday Focus: Top 3–5 YTD Outliers
| YTD Top Gainers | Perf. | Notes |
|---|---|---|
| ELLAHLAKES | +388.4% | Biggest momentum/volatility magnet, but speculative. |
| SOVRENINS | +151.2% | Small cap insurance, technicals improving. |
| CHAMS PLC | +120.0% | Stellar move, confirmed by daily gains; could test overbought soon. |
| WEMABANK | +119.8% | Pays to ride, but signs of retail froth. |
| YTD Top Losers | Perf. | Notes |
|---|---|---|
| MCNICHOLS | -99.4% | Unusual volume spike today but no price traction. |
| THOMASWY | -57.9% | Sustained downtrend; avoid until confirmed base forms. |
| MERVALUE | -19.2% | ETF, continued selling, macro proxy risk. |
| NEWGOLD | -11.3% | ETF, fresh breakdown, technical caution. |
Market Activity Insights: Institutional vs Retail Behavior
-
Trade Participation:
- Retail investors accounted for 59.7% of total trades—yet only 38.6% of volume and 9.05% of value, reinforcing that institutions exert much greater influence on volume and especially large-value trades.
- Institutions contributed just 40.3% of trades, but dominated volume (61.4%) and value (90.95%).
-
Top 5 Most Traded (Institutional):
- ARADEL: 22.46M shares (over 600% > 90D avg), value ₦13.16B; signals institutional accumulation or a block event. Aggressive movement outpaces sectoral peers.
- ACCESSCORP: Both institutional and retail favorite; flat price with high volume suggests positioning ahead of potential catalyst.
- ELLAHLAKES: 27M+ institutional, YTD momentum leader—continued volatility expected.
- DANGCEM: Cement major, steady institutional interest; safe haven or macro-driven flow.
- ZENITHBANK: Bank mainstay, modest slip, but heavy on institutional books.
-
Top 5 Most Traded (Retail):
- STERLINGNG: Most retail trades, yet price fell (-4.2%); retail chasing weakness or panic.
- MTNN: Heavy retail flow, but no follow-through on price; possible rotation from institutions to retail hands.
- ACCESSCORP: Appears on both lists—tug of war evident, on watch for future breakout candidate.
- GTCO: Similar trend, loses ground, but remains heavily traded—potential overextension by retail.
- ELLAHLAKES: High on retail radar; volatile and speculative, caution advised unless riding trend with stops.
-
Discernible Patterns:
- Names with highest institutional volumes often appear as gainers, leaders, or volatility hotspots (ARADEL, ACCESSCORP, ELLAHLAKES).
- Stocks deeply traded by retail (STERLINGNG, GTCO) suffered price declines, suggesting possible "late buying” or exhaustion risk.
- Overlap in most-traded symbols between retail and institutional lists (ACCESSCORP, ELLAHLAKES) points to "hot” names where trend can accelerate quickly, but also reverse without warning.
Suggestions & Trading Cautions
- For momentum traders: Consider sticking with top relative strength names (CHAMS, ELLAHLAKES, SOVRENINS), but trail stops as some are nearing overbought territory.
- Defensive investors: Seek out high yield, low to mid beta winners (MANSARD), and beware of names where high yield is paired with negative price momentum (FTNCOCOA).
- Watch for reversals in a handful of YTD losers (esp. MCNICHOLS, NEWGOLD) with unsustainable selling and potential institutional entry on flush points.
- Unusual volume: ARADEL’s spike is institutional—possible M&A, deal, or smart money positioning; retail should be alert but not chase parabolic moves unless confirmed by news/corporate action.
- Sector overlay: Insurance displays leadership—if breadth widens, could offer early sector rotation opportunities.
Key Takeaway: The NGX remains in a broad uptrend, but beneath the surface selective leadership, technical breakouts, and institutional clustering hint at potential volatility and sector rotation. Retail exuberance is most potent in second-tier financials and insurance, while institutionally-driven value and ETF sectors may be due for a shakeup. Stay nimble, confirm technicals, and let volume lead you to the next opportunity.
|
Top ASI Gainers Over Last 5 Trading Days
|
Top ASI Losers Over Last 5 Trading Days
|
For more detailed analysis, on InfoWARE Market Data Terminal <NSEPERF> <GO>
On InfoWARE Finance Mobile App (Android, iPhone & iPad, Windows Phone and Windows 8/10), "Top Gainers & Losers"
CORNERSTONE INSURANCE COMPANY PLC. (CORNERST) topped the advancers list closing at N6.65 with a gain of 9.92% followed by CONSOLIDATED HALLMARK INSURANCE PLC (CONHALLPLC) which closed at N4.37 with a gain of 9.52%.
On the flip side NEWGOLD EXCHANGE TRADED FUND (ETF) (NEWGOLD) and LIVINGTRUST MORTGAGE BANK PLC (LIVINGTRUST) topped the decliners log with a loss of -11.01% at a close of N51,433.00, and -10.00% to close the day at N5.94 respectively.
| Symbol | LClose | %Chg |
|---|---|---|
| CORNERST | 6.65 | 9.92 |
| CONHALLPLC | 4.37 | 9.52 |
| CHAMS | 4.62 | 9.22 |
| VFDGROUP | 11.90 | 9.17 |
| INTENEGINS | 2.96 | 8.82 |
| Symbol | LClose | %Chg |
|---|---|---|
| NEWGOLD | 51,433.00 | -11.01 |
| LIVINGTRUST | 5.94 | -10.00 |
| AUSTINLAZ | 3.15 | -9.74 |
| JULI | 8.95 | -9.60 |
| LIVESTOCK | 7.40 | -7.50 |
For more detailed analysis,
- On InfoWARE Market Data Terminal <TOPG> <GO>
- On InfoWARE Finance Mobile App ( Android, iPhone & iPad and Windows 10) , "Top Gainers & Losers"
Currency Market
In the currency market, the Naira was unchanged against the dollar at 1 to 1NSE: Bull Signal - Price crossed above 15 Day MA
This signal implies these stocks are under buying pressure and the price might continue to rise and therefore positions should be monitored closely. Further suggested analysis include looking at the overall market (ASI) to see if the uptrend is market wide, sector wide or specific to the stock. Portfolio managers tend to use this as a signal to do more research to add to their positions or lock in some profits. Typically further analysis should be done using commands like PC and RV on the InfoWARE Market Data Terminal. Another command is ALERTS to set price triggers for possible exit or entry as necessary
For more detailed analysis,
- On InfoWARE Market Data Terminal <NSEPERF> <GO>
- On InfoWARE Finance Mobile App ( Android , iPhone & iPad and Windows 10) , "Top Gainers & Losers"
| Symbol | Price | %Chg | 15DMA | PE | EPS | DivY | MktCap | Vol | Trades | Value | LstTradeTime |
|---|---|---|---|---|---|---|---|---|---|---|---|
| CORNERST | 6.65 | 9.02 | 6.29 | 8.62 | 0.35 | 5.28 | 120.81B | 1.25M | 83.00 | 8.08M | 07-Oct-2025 14:31:34.587 |
| CONHALLPLC | 4.37 | 8.70 | 4.04 | 69.63 | 0.03 | 2.08 | 46.78B | 3.13M | 80.00 | 13.06M | 07-Oct-2025 14:31:34.477 |
| VSPBONDETF | 220.00 | 6.36 | 208.08 | 0.00 | 0.00 | 22.00 | 1.00 | 4.84K | 07-Oct-2025 14:33:28.957 | ||
| BERGER | 38.85 | 4.76 | 38.72 | 14.18 | 1.22 | 1.15 | 11.26B | 503.11K | 76.00 | 18.92M | 07-Oct-2025 14:31:33.577 |
| NASCON | 97.90 | 1.74 | 96.76 | 24.28 | 1.33 | 3.09 | 259.38B | 767.59K | 95.00 | 74.67M | 07-Oct-2025 14:31:35.810 |
| MBENEFIT | 3.85 | 1.30 | 3.83 | 5.43 | 0.11 | 3.28 | 77.24B | 9.92M | 198.00 | 36.53M | 07-Oct-2025 14:31:35.643 |
| JAPAULGOLD | 2.68 | 1.12 | 2.65 | 0.19 | 12.01 | 0.90 | 16.78B | 19.93M | 206.00 | 53.24M | 07-Oct-2025 14:33:25.070 |
| ACCESSCORP | 26.00 | 0.00 | 25.99 | 8.56 | 2.81 | 1.87 | 924.18B | 45.86M | 1,412.00 | 1.20B | 07-Oct-2025 14:33:30.673 |
NSE: BEAR Signal - Price crossed below 15 Day MA
This signal implies these stocks are under selling pressure and the price might continue to slide and therefore positions should be monitored closely. Further suggested analysis include looking at the overall market (ASI) to see if the downtrend is market wide, sector wide or specific to the stock. If the overal market trend is upwards, then since these stocks are heading in the opposite direction, then further analysis should be done using commands like PC and RV on the InfoWARE Market Data Terminal. Another command is ALERTS to set price triggers for possible exit is necessar
For more detailed analysis,
- On InfoWARE Market Data Terminal <BEARM> <GO>
- On InfoWARE Finance Mobile App ( Android , iPhone & iPad and Windows 10)
| Symbol | Price | %Chg | 15DMA | PE | EPS | DivY | MktCap | Vol | Trades | Value | LstTradeTime |
|---|---|---|---|---|---|---|---|---|---|---|---|
| RTBRISCOE | 3.59 | 0.00 | 3.60 | 0.00 | 0.00 | 4.35 | 4.22B | 457.94K | 26.00 | 1.64M | 07-Oct-2025 14:31:36.393 |
| FGSUK2032S5 | 96.00 | -2.08 | 96.04 | 0.00 | 0.00 | 2.00K | 1.00 | 1.92M | 07-Oct-2025 14:33:32.117 | ||
| FIDELITYBK | 20.05 | -4.49 | 20.44 | 13.24 | 1.17 | 5.48 | 580.94B | 10.84M | 552.00 | 217.71M | 07-Oct-2025 14:33:25.040 |
| FTNCOCOA | 5.51 | -6.17 | 5.75 | 0.00 | 0.00 | 1.60 | 21.49B | 5.61M | 245.00 | 32.56M | 07-Oct-2025 14:31:35.080 |
| TANTALIZER | 2.32 | -6.90 | 2.43 | 0.00 | 0.00 | 1.50 | 7.45B | 3.87M | 155.00 | 9.12M | 07-Oct-2025 14:31:42.003 |
| LIVESTOCK | 7.40 | -8.11 | 7.75 | 0.00 | 0.00 | 2.94 | 22.20B | 2.19M | 144.00 | 16.83M | 07-Oct-2025 14:31:35.543 |
| NEWGOLD | 51,433.00 | -12.38 | 53,770.22 | 0.00 | 0.00 | 0.00 | 0.00 | 3.00 | 3.00 | 166.63K | 07-Oct-2025 14:33:28.837 |
| FGSUK2031S4 | 75.00 | -58.67 | 92.34 | 0.00 | 0.00 | 3.00K | 2.00 | 2.25M | 07-Oct-2025 14:33:32.097 |
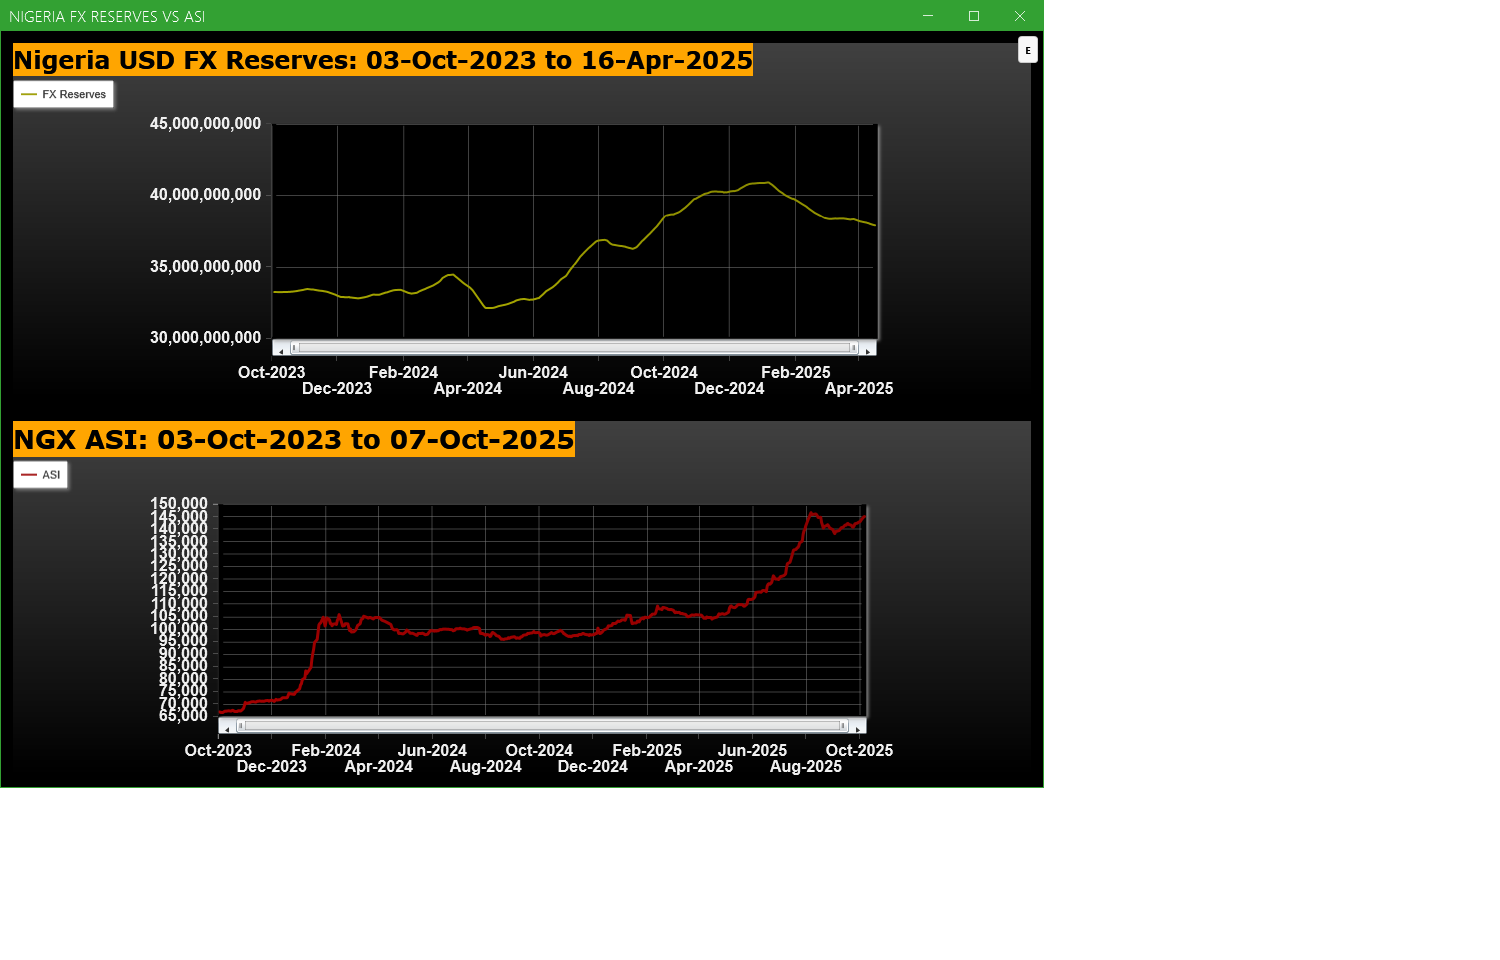
Economic Indicators - Nigeria FX Reserves Vs ASI Chart
Nigeria FX Reserves are assets held on reserve by CBN in foreign currencies. These reserves are used to back liabilities and influence monetary policy. Given the nature of the Nigeria economy, FX Reserves can appear to have an outsize influence on the economy and hence on the capital market. The chart below allows comparison of FX Reserves against the ASI to make investment decisions
For more detailed analysis,
- On InfoWARE Market Data Terminal <CI> <GO>
- On InfoWARE Finance Mobile App ( Android , iPhone & iPad and Windows 10) , "Research"
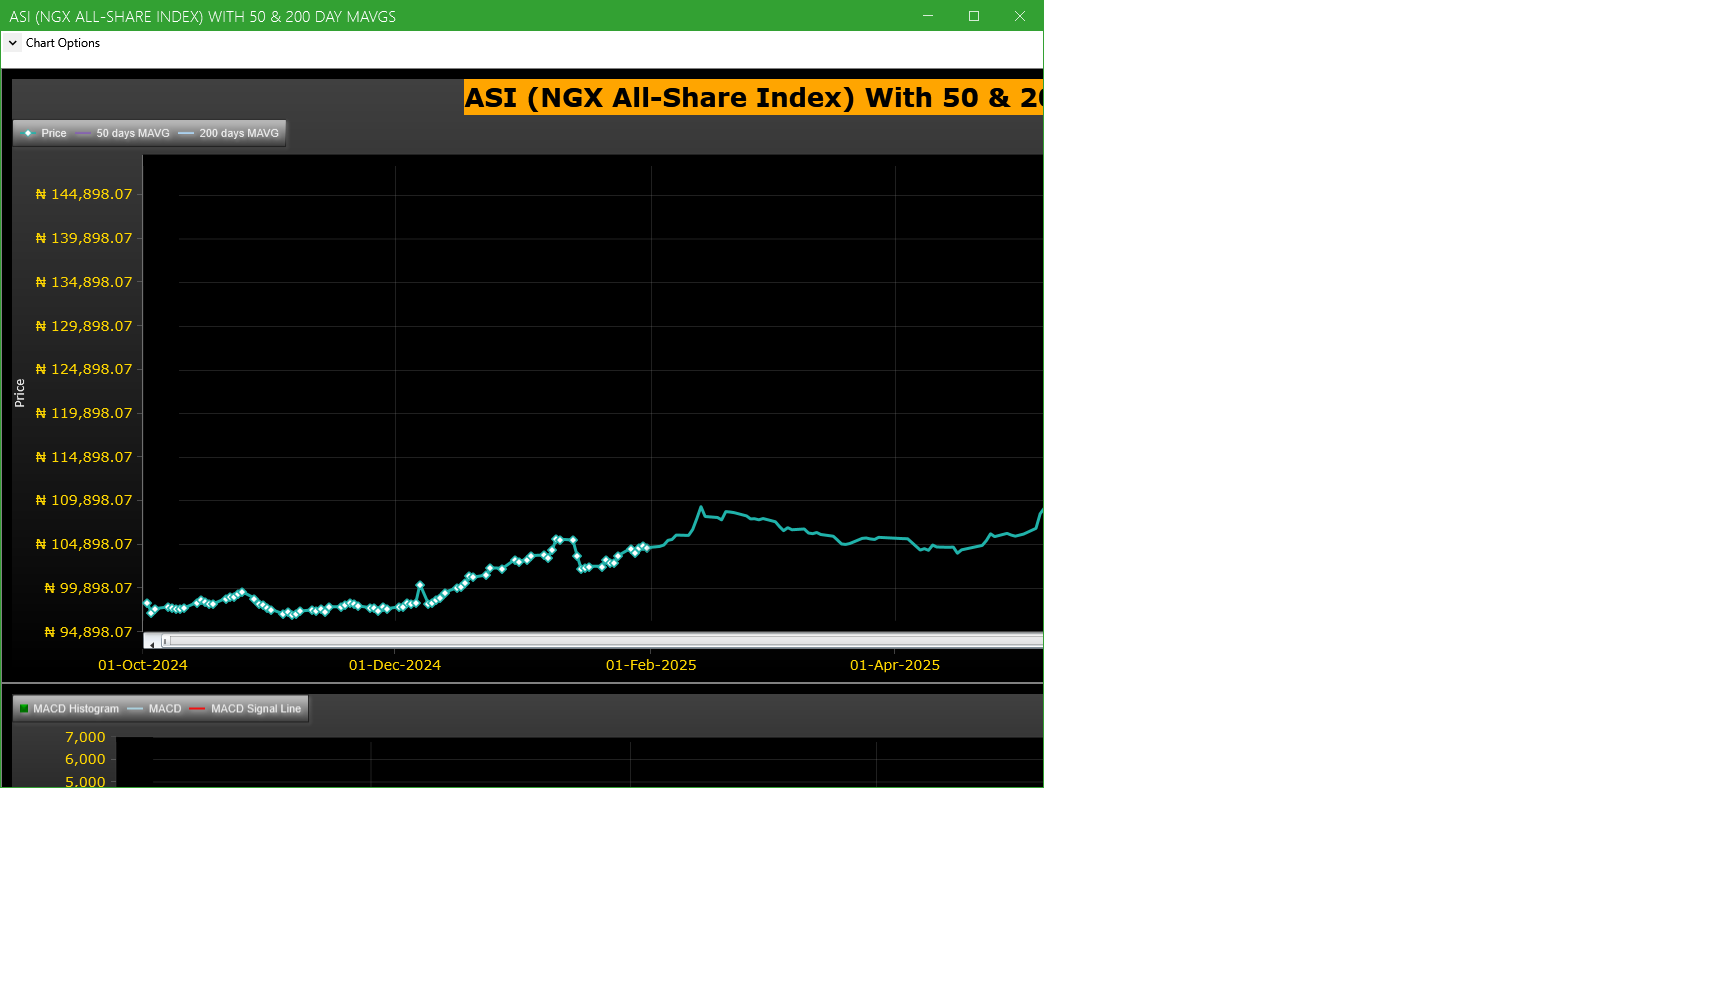
Market Trend - ASI (NGX All-Share-Index) With 50 & 200 Day MAvgs Chart
Technical traders typically use the 50 & 200 day moving averages to aid in choosing
where to enter or exit a position, which then causes these levels to act as strong
support or resistance. As a general guideline, if the price is above a moving average,
the trend is up. If the price is below a moving average, the trend is down.
It is important to note that critics of technical analysis say that moving averages act
as support and resistance because so many traders use these indicators to inform their
trading decisions. Also moving averages tend to work quite well in strong trending conditions
but poorly in choppy or ranging conditions.
Trading Strategies: Crossovers
Crossovers are one of the main moving average strategies. The first type is a price crossover,
which is when the price crosses above or below a moving average to signal a potential change
in trend. Another strategy is to apply two moving averages to a chart: one longer and one
shorter. When the shorter-term MA crosses above the longer-term MA, it is a buy signal, as
it indicates that the trend is shifting up. This is known as a golden cross. Meanwhile, when
the shorter-term MA crosses below the longer-term MA, it is a sell signal, as it indicates that
the trend is shifting down. This is known as a dead/death cross
For more detailed analysis,
- On InfoWARE Market Data Terminal <CI> <GO>
- On InfoWARE Finance Mobile App ( Android , iPhone & iPad and Windows 10) , "Research"
Unusual Volume: Volume traded is more than double the 90 day moving average (All exchanges; ASI & ASem). For more detailed analysis,
- On InfoWARE Market Data Terminal <UV> <GO>
- On InfoWARE Finance Mobile App ( Android , iPhone & iPad and Windows 10)
| Symbol | Name | Volume | 90DAvgVol | %VolChg | Price | LClose | %Chg | Trades | Value |
|---|---|---|---|---|---|---|---|---|---|
| ARADEL | ARADEL HOLDINGS PLC | 22.58M | 3.22M | 600.78 | 620.00 | 630.00 | -1.59 | 696 | 13.16B |
| MCNICHOLS | MCNICHOLS PLC | 11.35M | 2.05M | 452.47 | 3.21 | 3.20 | 0.31 | 130 | 36.54M |
| PZ | P Z CUSSONS NIGERIA PLC. | 6.65M | 2.88M | 130.76 | 40.20 | 42.00 | -4.29 | 480 | 264.69M |
| UPDCREIT | UPDC REAL ESTATE INVESTMENT TRUST | 3.81M | 1.61M | 136.86 | 7.30 | 7.50 | -2.67 | 190 | 27.82M |
| ETERNA | ETERNA PLC. | 938.43K | 388.33K | 141.66 | 38.80 | 37.50 | 3.47 | 106 | 35.31M |
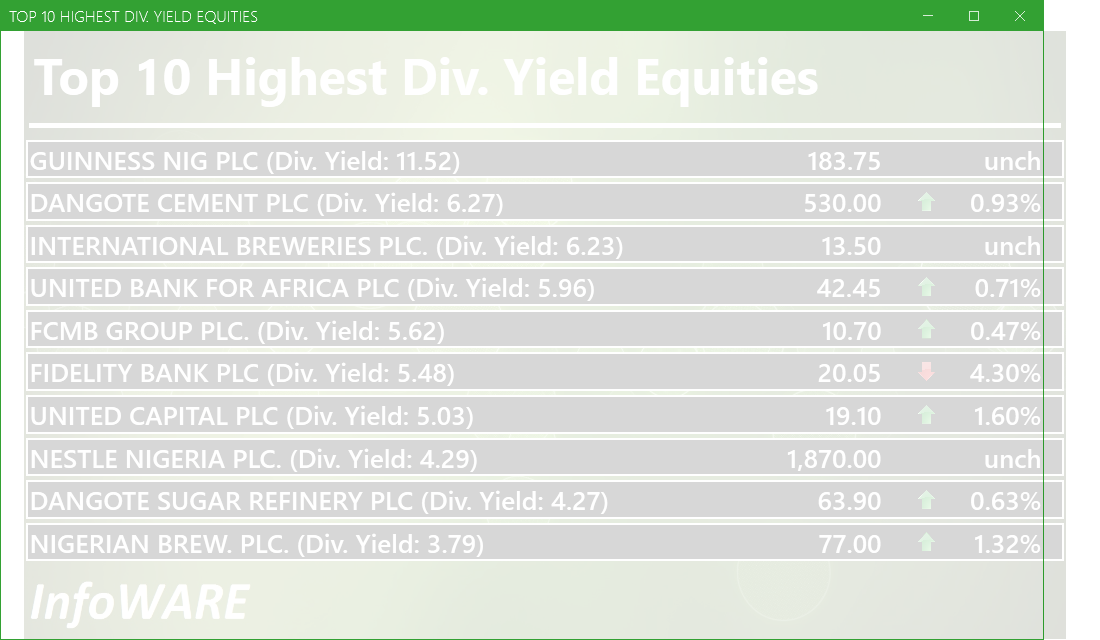
Investment Insights - High Div. Stocks
Dividend stocks distribute a portion of the company earnings to investors on a regular basis and they can a great choice for investors looking for regular income. As an investment or trading strategy, high dividend yield equities provide annual cash payments as against mostly capital gains in the price of a stock. The list in the table below represent the highest dividend paying stocks from the list of the most liquid stocks in the NSE top 30.
For more detailed analysis,
- On InfoWARE Market Data Terminal <HYIELD> <GO>
- On InfoWARE Finance Mobile App ( Android , iPhone & iPad and Windows 10) , "Research"
African Markets
| Name | LClose | Change | %Chg |
|---|---|---|---|
| BRVM Stock Exchange | 329.65 | 4.52 | 1.39 |
| Botswana Stock Exchange | 10,612.68 | 2.12 | 0.02 |
| Egyptian Exchange | 37,094.80 | -115.35 | -0.31 |
| Ghana Stock Exchange | 8,422.19 | 11.77 | 0.14 |
| Johannesburg Stock Exchange | 109,925.90 | 142.72 | 0.13 |
| Lusaka Stock Exchange | 25,366.74 | 90.99 | 0.36 |
| Casablanca Stock Exchange | 19,084.25 | 263.49 | 1.40 |
| Malawi Stock Exchange | 605,572.13 | 5,103.98 | 0.85 |
| Nigeria Stock Exchange | 144,822.77 | 1,234.86 | 0.86 |
| Nairobi Securities Exchange | 177.67 | -0.82 | -0.46 |
| Namibian Stock Exchange | 1,983.27 | 20.61 | 1.05 |
| Rwanda Stock Exchange | 179.26 | 0.00 | 0.00 |
| Tunis Stock Exchange | 12,323.07 | 34.41 | 0.28 |
| Uganda Securities Exchange | 1,462.37 | -4.40 | -0.30 |
Nigeria Market Indexes
| Symbol | LClose | %Chg | WTD% | MTD% | QTD% | YTD% | MktCap | Trades |
|---|---|---|---|---|---|---|---|---|
| ASI | 144,995.26 | 0.12 | 0.12 | 1.41 | 1.41 | 40.53 | 28,968 | |
| NGX30 | 5,285.94 | 0.14 | 0.14 | 1.30 | 1.30 | 38.56 | 15,161 | |
| NGXAFRBVI | 3,526.81 | -1.43 | -1.43 | -0.64 | -0.64 | 42.16 | 5,226 | |
| NGXAFRHDYI | 22,085.68 | -0.42 | -0.42 | -0.78 | -0.78 | 29.71 | 6,715 | |
| NGXASEM | 1,392.88 | -9.44 | -9.44 | -9.44 | -9.44 | -12.05 | 15 | |
| NGXBNK | 1,515.91 | -1.33 | -1.33 | -0.06 | -0.06 | 39.40 | 6,793 | |
| NGXCG | 4,116.87 | -0.54 | -0.54 | 1.63 | 1.63 | 45.51 | 13,997 | |
| NGXCNSMRGDS | 3,414.23 | 0.26 | 0.26 | 0.93 | 0.93 | 96.86 | 4,157 | |
| NGXCOMMDTY | 1,150.18 | -0.31 | -0.31 | 2.53 | 2.53 | 15.02 | ||
| NGXGROWTH | 14,918.71 | -2.04 | -2.04 | -1.02 | -1.02 | 92.18 | 354 | |
| NGXINDUSTR | 5,113.28 | 0.69 | 0.69 | 0.90 | 0.90 | 43.16 | 2,245 | |
| NGXINS | 1,275.43 | 1.98 | 1.98 | 6.63 | 6.63 | 62.23 | 2,257 | |
| NGXLOTUSISLM | 12,073.61 | 0.32 | 0.32 | 1.71 | 1.71 | 73.28 | 4,898 | |
| NGXMAINBOARD | 7,079.77 | -0.36 | -0.36 | 0.50 | 0.50 | 41.48 | 22,112 | |
| NGXMERIGRW | 10,124.55 | -0.21 | -0.21 | 2.24 | 2.24 | 55.21 | 4,913 | |
| NGXMERIVAL | 13,639.53 | 0.06 | 0.06 | 2.03 | 2.03 | 30.77 | 7,187 | |
| NGXOILGAS | 2,648.41 | -0.87 | -0.87 | 4.85 | 4.85 | -2.31 | 521 | |
| NGXPENBRD | 2,694.15 | 0.20 | 0.20 | 1.62 | 1.62 | 47.09 | 23,052 | |
| NGXPENSION | 6,817.09 | -0.40 | -0.40 | 1.18 | 1.18 | 50.35 | 17,305 | |
| NGXPREMIUM | 14,157.10 | 1.06 | 1.06 | 3.40 | 3.40 | 45.46 | 6,502 | |
| NGXSOVBND | 658.20 | 0.00 | 0.00 | 0.14 | 0.14 | 9.42 | 0 |
For more detailed analysis,
- On InfoWARE Market Data Terminal <MKTINS> <GO>
- On InfoWARE Finance Mobile App ( Android, iPhone & iPad and Windows 10) , "Market Indexes"
Find the topic interesting? Will like to comment? Contact Us at solutions@infowarelimited.com
Top News

Chart Of The Day - ASI Chart Vs ASI Advance Decline Line (YTD) (09-Oct-2025 15:11:54.102)
InfoWARE AI Analyst Daily Market Report: 09-Oct-2025

[XNSA]>> CLOSING GONG CEREMONY IN COMMEMORATION OF WORLD MENTAL HEALTH DAY
[VETGOODS]>> DAILY INDICATIVE PRICES
[XNSA]>> RESIGNATION OF MANAGING DIRECTOR (AVA SECURITIES LIMITED)
[XNSA]>> NGX FIXED INCOME INDICATIVE PRICE LIST FOR OCT 09, 2025
[XNSA]>> CLOSING GONG CEREMONY BY ZENITH BANK PLC
[XNSA]>> UPDATED- SAVE THE DATE: 29TH ANNUAL STOCKBROKERS CONFERENCE
[XNSA]>> CIRCULAR TO TRADING LICENSE HOLDERS
[XNSA]>> AELP CAPACITY BUILDING & ASSDA FORUM
[XNSA]>> CORDROS MILESTONE FUNDS' BID & OFFER PRICES
[STANBICETF30]>> DAILY INDICATIVE PRICES
InfoWARE AI Analyst Daily Market Report: 01-Jan-0001
Chart Of The Day - ASI Chart Vs ASI Advance Decline Line (YTD) (08-Oct-2025 15:06:38.730)
InfoWARE AI Analyst Daily Market Report: 08-Oct-2025
[XNSA]>> RESIGNATION OF A DIRECTOR (FIRST INTEGRATED CAPITAL MANAGEMENT LIMITED)
[VSPBONDETF]>> DAILY INDICATIVE PRICES
[XNSA]>> NGX FIXED INCOME INDICATIVE PRICE LIST FOR OCT 08, 2025
[XNSA]>> CLOSING GONG CEREMONY BY ZENITH BANK PLC
[XNSA]>> UPDATED- SAVE THE DATE: 29TH ANNUAL STOCKBROKERS CONFERENCE
[XNSA]>> CORDROS MILESTONE FUNDS' BID & OFFER PRICES
[XNSA]>> SUSPENSION OF TRADING IN THE SHARES OF SMART PRODUCTS NIGERIA PLC
[XNSA]>> AELP CAPACITY BUILDING & ASSDA FORUM
[STANBICETF30]>> DAILY INDICATIVE PRICES
[XNSA]>> NOTIFICATION OF PRICE ADJUSTMENT
Chart Of The Day - ASI Chart Vs ASI Advance Decline Line (YTD) (07-Oct-2025 15:07:14.222)
InfoWARE AI Analyst Daily Market Report: 07-Oct-2025
[SIAMLETF40]>> DAILY INDICATIVE PRICES
[XNSA]>> CLOSING GONG CEREMONY BY ZENITH BANK PLC
[XNSA]>> LISTING OF FGN SAVINGS BONDS FOR SEPTEMBER 2025
Get IDIA - the stock trading app for the modern investor
Solutions by Business
Product Suites
Company
Contacts
- 8th Floor,
- South Atlantic Petroleum Towers,
- 1 Adeola Odeku Street,
- Victoria Island,
- Lagos, Nigeria.
- Email: solutions@infowarelimited.com
Follow Us
 |
 |
 |
 |