


InfoWARE AI Analyst Daily Market Report: 09-Oct-2025 | InfoWARE Finance
Get IDIA - the stock trading app for the modern investor


InfoWARE AI Analyst Daily Market Report: 09-Oct-2025
(Source: InfoWARE Terminal, Date: 09-Oct-2025)
Dear Investor,
NGX Daily Market Summary – Thursday, October 9, 2025
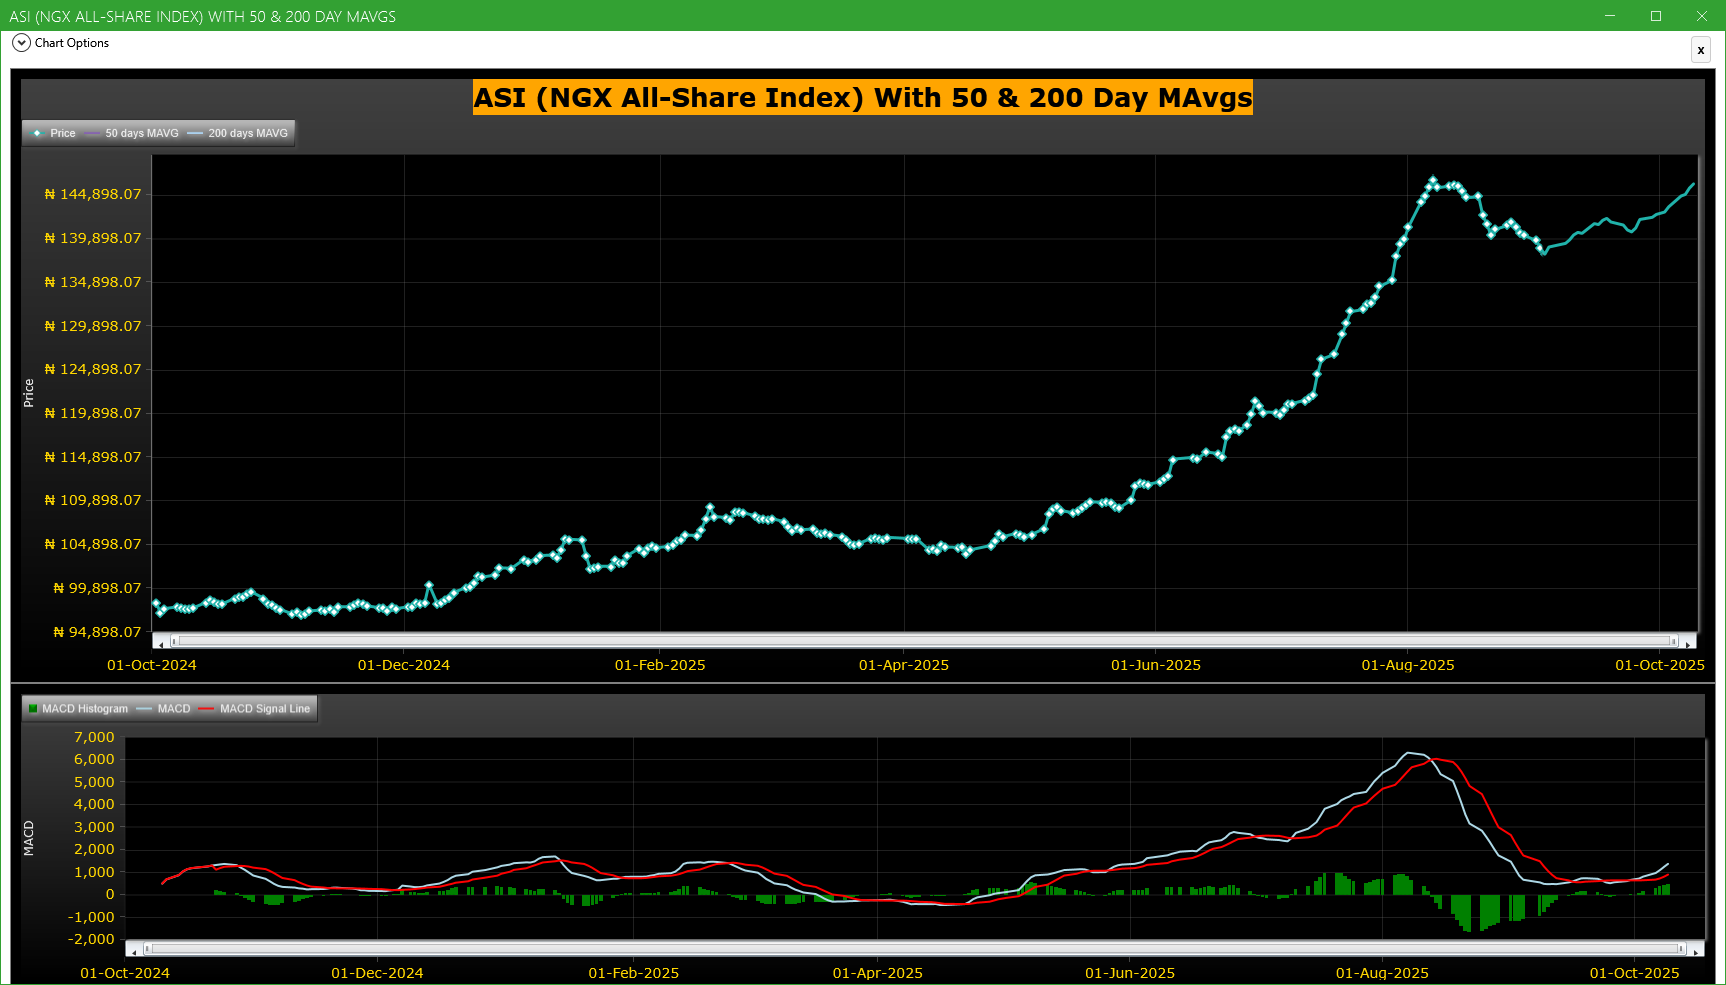
The NGX All Share Index (ASI) rose 0.33% today to close at 145,719.09, further solidifying its impressive 41.70% YTD gain. Market activity was robust, with turnover surging to ₦25.95B (+144.63% from yesterday), even as total trading volume dipped -15.93% to 325.02M shares. Market breadth remained constructive at 1.52x with 35 advancers versus 23 decliners, signaling continued bullish sentiment across the broader market. Cementing the upbeat mood, the Naira appreciated 0.11% against the Dollar.
Key Market Breadth and Sentiment Trends
- Market Breadth: With more than 1.5x as many advancers as decliners (35 vs. 23), upward momentum remains intact—though volume shrank, suggesting possible sector rotation or profit-taking by participants despite the index climb.
- Volume Trends: Noteworthy: volumes rose in 57 stocks but declined in 81—potential early warning of selective participation and possible overextension in some winners.
- Trade Profile: Institutional players remained dominant, representing 94.55% of market value and 60.91% of traded volume, compared to retail’s 5.45% and 39.09%, respectively. On trade count, however, retail investors were the bulk (62.90%).
Top Gainers & Losers: Daily Standouts
| Stock | End Price | Change (%) | RSI | MACD |
|---|---|---|---|---|
| CAVERTON | 6.93 | +10.00% | 46.64 | 0.015 (Bullish Crossover) |
| EUNISELL | 44.00 | +10.00% | 75.27 | 4.20 |
| SUNUASSUR | 5.77 | +9.90% | 45.80 | 0.057 |
| VETGRIF30 ETF | 58.00 | +9.43% | 55.23 | 0.93 |
| IMG | 35.95 | +9.10% | 41.95 | 0.09 |
| MERVALUE | 160.00 | -9.81% | 45.43 | -6.93 |
| MERGROWTH | 386.10 | -9.58% | 45.59 | -39.51 |
| FTNCOCOA | 5.60 | -6.67% | 52.05 | -0.03 |
| TANTALIZER | 2.31 | -3.35% | 49.17 | -0.01 |
| FIDELITYBK | 20.50 | -2.38% | 52.50 | 0.11 |
- EUNISELL notable for both high RSI (75.3, overbought) and top gainer status. Often a sign that the move may soon slow or mean-revert.
- MERVALUE & MERGROWTH ETFs both rank among top losers day and YTD, with sharply negative MACD readings, hinting at ongoing distribution in these sector baskets.
Insights from Key Indicators
-
Unusual Volume:
- DANGCEM (Dangote Cement) exploded with 20.92M shares traded (12x its 90-day avg) and ₦11B turnover, suggesting sustained institutional accumulation; price rose +1.9%.
- NESTLE smashed its typical volume with 2.75M shares vs. just 89k average (2984% surge)—no price change, perhaps signifying large block trades or portfolio rebalancing at steady pricing.
- LIVINGTRUST (YTD Top Loser) featured in unusual volume table—potential bottom fishing or large exit moves amid recent price weakness.
-
Bullish Momentum:
- CAVERTON, SUNUASSUR, GTCO and others crossed above their 15DMA with positive MACDs, confirming coordinated buying. (See Bullish Momentum Table).
- Market-wide RSI readings remain strong, with several issues near or above 70 (e.g., EUNISELL).
-
Bearish Momentum:
- MERGROWTH, FTNCOCOA crossed below 15DMA and exhibit negative MACD signals, with MERGROWTH's MACD at -39.5—continuing its technical breakdown.
- Turnover Surge: The sharp uptick in turnover amid lower volumes suggests big-ticket block trades and sector rotation, with institutional investors driving activity.
- Advance/Decline: More advancers but falling volume = potential "melt up" or buying at new highs; traders should watch for reversal signals if breadth narrows further.
- ETF Weakness: Both MERVALUE and MERGROWTH ETFs feature as top losers YTD and day, a rare convergence—signals sector-wide rotation away from these baskets.
Bullish & Bearish Momentum Analysis
| Stock | Signal | Current Price | 15DMA | RSI | MACD | Sector |
|---|---|---|---|---|---|---|
| CAVERTON | Bullish (Above 15DMA) | 6.93 | 6.70 | 46.6 | 0.015 | Support & Logistics |
| SUNUASSUR | Bullish (Above 15DMA) | 5.77 | 5.61 | 45.80 | 0.057 | Insurance |
| GUINEAINS | Bullish (Above 15DMA, High PE) | 1.50 | 1.49 | 66.79 | 0.01 | Insurance |
| VERITASKAP | Bearish (Below 15DMA) | 2.06 | 2.07 | 48.77 | - | Insurance |
| FTNCOCOA | Bearish (Below 15DMA) | 5.60 | 5.73 | 52.05 | -0.03 | Crop Production |
| MERGROWTH | Bearish (Below 15DMA) | 386.10 | 403.07 | 45.59 | -39.51 | ETF |
- CAVERTON and SUNUASSUR offer technical setups combining 15DMA crossover and positive MACD—a classic bullish scenario often favored by short-term traders.
- MERGROWTH ETF demonstrates strong bearish momentum, with MACD far below signal, confirming persistent downside.
Contrarian Signals
- EUNISELL: RSI is extremely high (75.27, overbought), yet bullish MACD and ongoing price surge. Such strong momentum often precedes short-term pullbacks or consolidation. Beware chasing at these levels.
- LIVINGTRUST: Despite heavy YTD losses (-22.15%) and appearance on the unusual volume list (7x average!), its RSI is neutral. Contrarian traders may look for a reversal but should remain cautious.
- MTNN: Huge institutional and retail flows on massive volume, yet price is flat. Neutral MACD but high RSI (~60). A "tug-of-war” -- watch for a decisive breakout.
Sector Heatmap
| Sector | Momentum | Change (%) | Key Movers | Institutional Value % |
|---|---|---|---|---|
| Banking | Mixed/Bullish | +0.3~0.9 | GTCO, ZENITHBANK, UBA | ZENITHBANK (20.17%), GTCO (11.2%) |
| Insurance | Bullish | +4~10 | SUNUASSUR, GUINEAINS | - |
| Building Materials | Bullish | +1.9 | DANGCEM | DANGCEM (42.2%) |
| ETF | Bearish | -9.5~-10 | MERGROWTH, MERVALUE | - |
| Food Products | Flat/Rotating | ~0 | NESTLE, LIVINGTRUST | - |
| Telecommunications | Bullish | +0.02 | MTNN (high volume) | MTNN (18.66%) |
Dividend-Yield vs Beta Matrix
| Symbol | DivYield (%) | Beta | Momentum Signal |
|---|---|---|---|
| GTCO | 1.88 | 1.09 | Bullish (Above 15DMA) |
| REGALINS | 6.52 | 0.47 | Bullish (Above 15DMA) |
| DEAPCAP | 13.76 | 0.89 | Bullish (Above 15DMA) |
| DANGSUGAR | 4.27 | 1.35 | Bullish (Above 15DMA) |
| ZENITHBANK | 2.25 | 1.20 | Flat |
- Low-beta, high-yield: REGALINS and DEAPCAP stand out for defensive, income-seeking investors—offering high dividend and low market sensitivity.
- DANGSUGAR pairs above-average dividend with technical strength; could be a candidate for hybrid defensive/growth strategies.
Institutional Clustering Alerts
- DANGCEM: Over 42% institutional value share and explosive volume surge—strong evidence of major fund flows. Price moved +1.9%.
- ZENITHBANK: 20.17% of total institutional trade value, with moderate price increase. Institutions trade ZENITHBANK at a much higher value concentration than retail.
- MTNN: Both high institutional and retail engagement. Institutional value dominated (18.7%), pointing to strategic accumulation.
Notable Patterns & Hidden Insights
- Overlap of High Dividend & Bullish Momentum: REGALINS and DEAPCAP both offer high yields and are in the bullish table—these could see continued inflows from both momentum and yield-focused investors.
- ETF Sectors: MERGROWTH and MERVALUE ETFs are persistent laggards both YTD and on the day. Caution for ETF/basket investors; consider stock picking where possible.
- LIVINGTRUST’s appearance among top YTD losers and unusual volume may signal either a washout bottom or further pressure. Watch for confirmation on reversal/turnaround.
YTD Top Gainers and Losers Table
| Name | YTD % | 5D% | PE | RSI | MACD | DivYield |
|---|---|---|---|---|---|---|
| VETGRIF30 ETF | +53.64% | +11.43% | - | 55.23 | 0.93 | 0.00 |
| EUNISELL | +128.33% | +11.39% | 0.31 | 75.27 | 4.20 | 0.31 |
| ETERNA | +70.78% | +10.67% | 1.43 | 70.78 | 1.22 | 0.68 |
| GREENWETF | +33.09% | +9.99% | - | 62.38 | 0.33 | 0.00 |
| LIVINGTRUST | -12.15% | -18.94% | 1.67 | 51.31 | 0.34 | 1.67 |
| MERGROWTH | -2.13% | -10.00% | - | 45.59 | -39.51 | 0.00 |
Trade Activity Insights
- Retail vs Institutional: Despite institutions dominating by value and volume, retail traders accounted for nearly two-thirds of trade count—suggesting retail is more active in smaller cap/retail-accessible names, whereas institutions drive price/volume in blue chips.
- Top 5 Institutional Names: DANGCEM, MTNN, ARADEL, ACCESSCORP, ZENITHBANK
- Top 5 Retail Names: MTNN, UBA, STERLINGNG, ACCESSCORP, ZENITHBANK
- Pattern: Key stocks like MTNN, ACCESSCORP and ZENITHBANK appear atop both lists, but institutionals overwhelmingly dominate DANGCEM, suggesting price action in this bellwether is especially sensitive to big-ticket flows.
- Strategic Insight: Watch for retail vs institutional divergence or convergence in these names for clues to possible inflection points or trend continuations.
Practical Suggestions for Traders
- Momentum hunters: Focus on stocks with bullish 15DMA crossovers and high volume—e.g., CAVERTON, SUNUASSUR, and GTCO.
- Defensive income seekers: Screen for high-yield, low-beta names in uptrend—e.g., REGALINS, DEAPCAP.
- Contrarian setups: Beware of high RSI & overbought readings in runners like EUNISELL (possible for mean-reversion).
- ETF caution: Persistent weakness in market ETFs (MERGROWTH/MERVALUE) encourages selective stock-picking over broad baskets for now.
- Tape-watchers: Large turnover spikes and block trades (DANGCEM, NESTLE) often set up for trend continuations or sharp re-pricings—monitor for breakout or reversal signals after such volume events.
|
Top ASI Gainers Over Last 5 Trading Days
|
Top ASI Losers Over Last 5 Trading Days
|
For more detailed analysis, on InfoWARE Market Data Terminal <NSEPERF> <GO>
On InfoWARE Finance Mobile App (Android, iPhone & iPad, Windows Phone and Windows 8/10), "Top Gainers & Losers"
CAVERTON OFFSHORE SUPPORT GRP PLC (CAVERTON) topped the advancers list closing at N6.93 with a gain of 10.00% followed by EUNISELL INTERLINKED PLC (EUNISELL) which closed at N44.00 with a gain of 10.00%.
On the flip side MERISTEM VALUE EXCHANGE TRADED FUND (MERVALUE) and MERISTEM GROWTH EXCHANGE TRADED FUND (MERGROWTH) topped the decliners log with a loss of -9.81% at a close of N160.00, and -9.58% to close the day at N386.10 respectively.
| Symbol | LClose | %Chg |
|---|---|---|
| CAVERTON | 6.93 | 10.00 |
| EUNISELL | 44.00 | 10.00 |
| LOTUSHAL15 | 113.86 | 10.00 |
| SUNUASSUR | 5.77 | 9.90 |
| VETGRIF30 | 58.00 | 9.43 |
| Symbol | LClose | %Chg |
|---|---|---|
| MERVALUE | 160.00 | -9.81 |
| MERGROWTH | 386.10 | -9.58 |
| FTNCOCOA | 5.60 | -6.67 |
| TANTALIZER | 2.31 | -3.35 |
| FIDELITYBK | 20.50 | -2.38 |
For more detailed analysis,
- On InfoWARE Market Data Terminal <TOPG> <GO>
- On InfoWARE Finance Mobile App ( Android, iPhone & iPad and Windows 10) , "Top Gainers & Losers"
Currency Market
In the currency market, the Naira appreciated 0.11%(1.55) against the Dollar to settle at 1 to 1NSE: Bull Signal - Price crossed above 15 Day MA
This signal implies these stocks are under buying pressure and the price might continue to rise and therefore positions should be monitored closely. Further suggested analysis include looking at the overall market (ASI) to see if the uptrend is market wide, sector wide or specific to the stock. Portfolio managers tend to use this as a signal to do more research to add to their positions or lock in some profits. Typically further analysis should be done using commands like PC and RV on the InfoWARE Market Data Terminal. Another command is ALERTS to set price triggers for possible exit or entry as necessary
For more detailed analysis,
- On InfoWARE Market Data Terminal <NSEPERF> <GO>
- On InfoWARE Finance Mobile App ( Android , iPhone & iPad and Windows 10) , "Top Gainers & Losers"
| Symbol | Price | %Chg | 15DMA | PE | EPS | DivY | MktCap | Vol | Trades | Value | LstTradeTime |
|---|---|---|---|---|---|---|---|---|---|---|---|
| CAVERTON | 6.93 | 9.09 | 6.70 | 1.15 | 1.57 | 5.52 | 23.22B | 1.02M | 113.00 | 6.99M | 09-Oct-2025 14:30:15.287 |
| SUNUASSUR | 5.77 | 9.01 | 5.61 | 0.00 | 0.00 | 0.99 | 33.53B | 1.16M | 54.00 | 6.65M | 09-Oct-2025 14:30:46.640 |
| GUINEAINS | 1.50 | 5.33 | 1.49 | 66.79 | 0.01 | 1.96 | 9.21B | 1.96M | 656.00 | 2.91M | 09-Oct-2025 14:30:17.697 |
| DEAPCAP | 1.74 | 5.17 | 1.72 | 188.84 | 0.01 | 13.76 | 2.61B | 1.27M | 67.00 | 2.22M | 09-Oct-2025 14:30:16.960 |
| REGALINS | 1.70 | 4.12 | 1.64 | 4.35 | 0.11 | 6.52 | 11.34B | 10.78M | 145.00 | 17.78M | 09-Oct-2025 14:30:46.623 |
| FCMB | 10.70 | 2.80 | 10.68 | 104.31 | 0.09 | 5.62 | 211.89B | 8.73M | 741.00 | 91.74M | 09-Oct-2025 14:30:17.340 |
| DANGSUGAR | 61.00 | 1.64 | 60.88 | 11.48 | 3.06 | 4.27 | 740.96B | 1.03M | 586.00 | 62.65M | 09-Oct-2025 14:30:16.917 |
| GTCO | 95.00 | 1.05 | 94.08 | 7.49 | 7.10 | 1.88 | 2,795.96B | 1.70M | 819.00 | 160.80M | 09-Oct-2025 14:30:17.643 |
| WAPIC | 3.10 | 0.97 | 3.09 | 72.55 | 0.02 | 2.56 | 74.37B | 5.16M | 69.00 | 16.05M | 09-Oct-2025 14:30:20.717 |
NSE: BEAR Signal - Price crossed below 15 Day MA
This signal implies these stocks are under selling pressure and the price might continue to slide and therefore positions should be monitored closely. Further suggested analysis include looking at the overall market (ASI) to see if the downtrend is market wide, sector wide or specific to the stock. If the overal market trend is upwards, then since these stocks are heading in the opposite direction, then further analysis should be done using commands like PC and RV on the InfoWARE Market Data Terminal. Another command is ALERTS to set price triggers for possible exit is necessar
For more detailed analysis,
- On InfoWARE Market Data Terminal <BEARM> <GO>
- On InfoWARE Finance Mobile App ( Android , iPhone & iPad and Windows 10)
| Symbol | Price | %Chg | 15DMA | PE | EPS | DivY | MktCap | Vol | Trades | Value | LstTradeTime |
|---|---|---|---|---|---|---|---|---|---|---|---|
| VERITASKAP | 2.06 | -1.94 | 2.07 | 48.77 | 0.02 | 4.17 | 28.57B | 2.07M | 86.00 | 4.26M | 09-Oct-2025 14:30:20.527 |
| FTNCOCOA | 5.60 | -7.14 | 5.73 | 0.00 | 0.00 | 1.60 | 21.84B | 1.61M | 230.00 | 9.49M | 09-Oct-2025 14:30:17.520 |
| MERGROWTH | 386.10 | -10.59 | 403.07 | 0.00 | 0.00 | 50.00 | 1.00 | 19.31K | 09-Oct-2025 14:30:46.730 | ||
| FGSUK2031S4 | 85.00 | -40.00 | 93.01 | 0.00 | 0.00 | 6.00 | 2.00 | 4.99K | 09-Oct-2025 14:30:50.310 |
Market Trend - ASI (NGX All-Share-Index) With 50 & 200 Day MAvgs Chart
Technical traders typically use the 50 & 200 day moving averages to aid in choosing
where to enter or exit a position, which then causes these levels to act as strong
support or resistance. As a general guideline, if the price is above a moving average,
the trend is up. If the price is below a moving average, the trend is down.
It is important to note that critics of technical analysis say that moving averages act
as support and resistance because so many traders use these indicators to inform their
trading decisions. Also moving averages tend to work quite well in strong trending conditions
but poorly in choppy or ranging conditions.
Trading Strategies: Crossovers
Crossovers are one of the main moving average strategies. The first type is a price crossover,
which is when the price crosses above or below a moving average to signal a potential change
in trend. Another strategy is to apply two moving averages to a chart: one longer and one
shorter. When the shorter-term MA crosses above the longer-term MA, it is a buy signal, as
it indicates that the trend is shifting up. This is known as a golden cross. Meanwhile, when
the shorter-term MA crosses below the longer-term MA, it is a sell signal, as it indicates that
the trend is shifting down. This is known as a dead/death cross
For more detailed analysis,
- On InfoWARE Market Data Terminal <CI> <GO>
- On InfoWARE Finance Mobile App ( Android , iPhone & iPad and Windows 10) , "Research"
Unusual Volume: Volume traded is more than double the 90 day moving average (All exchanges; ASI & ASem). For more detailed analysis,
- On InfoWARE Market Data Terminal <UV> <GO>
- On InfoWARE Finance Mobile App ( Android , iPhone & iPad and Windows 10)
| Symbol | Name | Volume | 90DAvgVol | %VolChg | Price | LClose | %Chg | Trades | Value |
|---|---|---|---|---|---|---|---|---|---|
| DANGCEM | DANGOTE CEMENT PLC | 20.92M | 1.59M | 1,216.55 | 540.00 | 530.00 | 1.89 | 1,113 | 11.00B |
| MTNN | MTN NIGERIA PLC | 10.49M | 2.23M | 371.01 | 471.00 | 470.90 | 0.02 | 1,554 | 4.93B |
| HMCALL | HALDANE MCCALL PLC | 5.05M | 872.55K | 478.21 | 4.29 | 4.20 | 2.14 | 22 | 21.64M |
| LIVINGTRUST | LIVINGTRUST MORTGAGE BANK PLC | 3.20M | 394.11K | 711.09 | 5.35 | 5.35 | 0.00 | 110 | 15.42M |
| NESTLE | NESTLE NIGERIA PLC. | 2.75M | 89.17K | 2,983.94 | 1,870.00 | 1,870.00 | 0.00 | 174 | 5.09B |
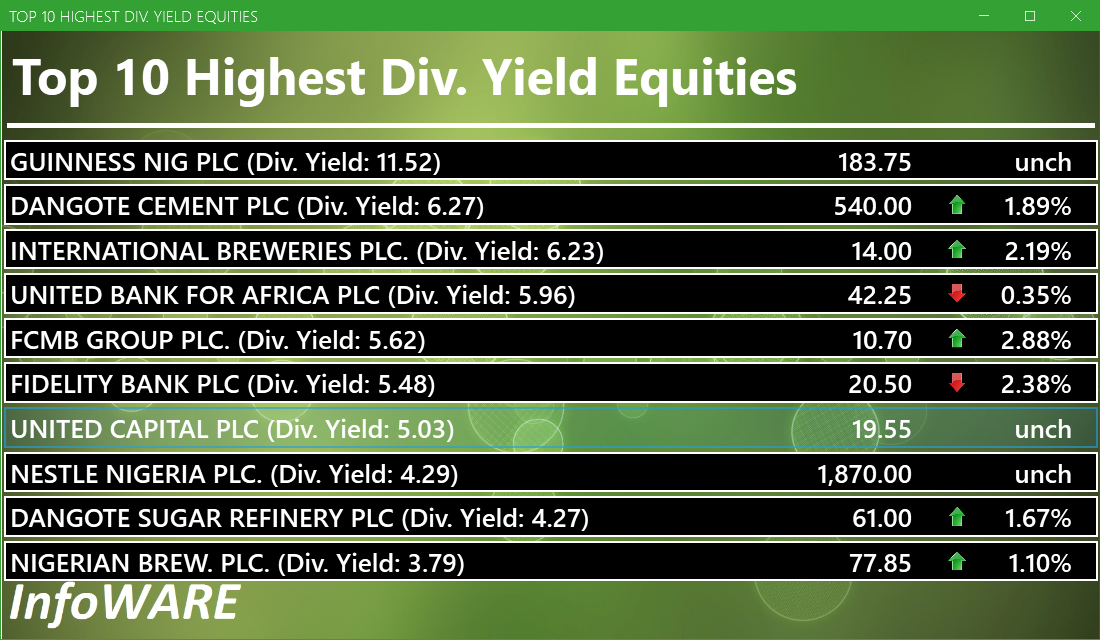
Investment Insights - High Div. Stocks
Dividend stocks distribute a portion of the company earnings to investors on a regular basis and they can a great choice for investors looking for regular income. As an investment or trading strategy, high dividend yield equities provide annual cash payments as against mostly capital gains in the price of a stock. The list in the table below represent the highest dividend paying stocks from the list of the most liquid stocks in the NSE top 30.
For more detailed analysis,
- On InfoWARE Market Data Terminal <HYIELD> <GO>
- On InfoWARE Finance Mobile App ( Android , iPhone & iPad and Windows 10) , "Research"
African Markets
| Name | LClose | Change | %Chg |
|---|---|---|---|
| BRVM Stock Exchange | 331.11 | 2.14 | 0.65 |
| Egyptian Exchange | 37,097.37 | 3.71 | 0.01 |
| Nairobi Securities Exchange | 173.75 | -2.54 | -1.44 |
| Tunis Stock Exchange | 12,298.61 | -23.41 | -0.19 |
Nigeria Market Indexes
| Symbol | LClose | %Chg | WTD% | MTD% | QTD% | YTD% | MktCap | Trades |
|---|---|---|---|---|---|---|---|---|
| ASI | 146,204.31 | 0.33 | 0.95 | 2.26 | 2.26 | 41.70 | 23,429 | |
| NGX30 | 5,332.08 | 0.32 | 1.01 | 2.19 | 2.19 | 39.77 | 12,871 | |
| NGXAFRBVI | 3,535.21 | 0.30 | -1.19 | -0.40 | -0.40 | 42.50 | 4,074 | |
| NGXAFRHDYI | 22,235.78 | 0.23 | 0.26 | -0.11 | -0.11 | 30.59 | 5,678 | |
| NGXASEM | 1,392.88 | 0.00 | -9.44 | -9.44 | -9.44 | -12.05 | 17 | |
| NGXBNK | 1,521.61 | 0.26 | -0.96 | 0.32 | 0.32 | 39.93 | 5,602 | |
| NGXCG | 4,153.36 | 0.18 | 0.34 | 2.53 | 2.53 | 46.80 | 11,392 | |
| NGXCNSMRGDS | 3,428.60 | 0.43 | 0.68 | 1.35 | 1.35 | 97.69 | 3,175 | |
| NGXCOMMDTY | 1,153.70 | 0.00 | -0.01 | 2.84 | 2.84 | 15.37 | ||
| NGXGROWTH | 15,552.90 | 6.15 | 2.12 | 3.19 | 3.19 | 100.35 | 310 | |
| NGXINDUSTR | 5,146.16 | 0.67 | 1.34 | 1.55 | 1.55 | 44.08 | 2,296 | |
| NGXINS | 1,273.98 | 0.64 | 1.86 | 6.51 | 6.51 | 62.04 | 1,595 | |
| NGXLOTUSISLM | 12,230.95 | 0.27 | 1.63 | 3.03 | 3.03 | 75.53 | 4,963 | |
| NGXMAINBOARD | 7,095.64 | 0.19 | -0.14 | 0.72 | 0.72 | 41.80 | 16,938 | |
| NGXMERIGRW | 10,177.52 | 0.82 | 0.31 | 2.77 | 2.77 | 56.02 | 3,776 | |
| NGXMERIVAL | 13,639.18 | -0.04 | 0.05 | 2.03 | 2.03 | 30.76 | 5,795 | |
| NGXOILGAS | 2,663.95 | 0.00 | -0.29 | 5.46 | 5.46 | -1.74 | 413 | |
| NGXPENBRD | 2,716.80 | 0.29 | 1.04 | 2.48 | 2.48 | 48.33 | 18,768 | |
| NGXPENSION | 6,881.98 | 0.21 | 0.54 | 2.14 | 2.14 | 51.79 | 14,315 | |
| NGXPREMIUM | 14,447.25 | 0.57 | 3.13 | 5.52 | 5.52 | 48.44 | 6,181 | |
| NGXSOVBND | 658.20 | 0.00 | 0.00 | 0.14 | 0.14 | 9.42 | 0 |
For more detailed analysis,
- On InfoWARE Market Data Terminal <MKTINS> <GO>
- On InfoWARE Finance Mobile App ( Android, iPhone & iPad and Windows 10) , "Market Indexes"
Find the topic interesting? Will like to comment? Contact Us at solutions@infowarelimited.com
Top News

Chart Of The Day - ASI Chart Vs ASI Advance Decline Line (YTD) (09-Oct-2025 15:11:54.102)
InfoWARE AI Analyst Daily Market Report: 09-Oct-2025

[XNSA]>> CLOSING GONG CEREMONY IN COMMEMORATION OF WORLD MENTAL HEALTH DAY
[VETGOODS]>> DAILY INDICATIVE PRICES
[XNSA]>> RESIGNATION OF MANAGING DIRECTOR (AVA SECURITIES LIMITED)
[XNSA]>> NGX FIXED INCOME INDICATIVE PRICE LIST FOR OCT 09, 2025
[XNSA]>> CLOSING GONG CEREMONY BY ZENITH BANK PLC
[XNSA]>> UPDATED- SAVE THE DATE: 29TH ANNUAL STOCKBROKERS CONFERENCE
[XNSA]>> CIRCULAR TO TRADING LICENSE HOLDERS
[XNSA]>> AELP CAPACITY BUILDING & ASSDA FORUM
[XNSA]>> CORDROS MILESTONE FUNDS' BID & OFFER PRICES
[STANBICETF30]>> DAILY INDICATIVE PRICES
InfoWARE AI Analyst Daily Market Report: 01-Jan-0001
Chart Of The Day - ASI Chart Vs ASI Advance Decline Line (YTD) (08-Oct-2025 15:06:38.730)
InfoWARE AI Analyst Daily Market Report: 08-Oct-2025
[XNSA]>> RESIGNATION OF A DIRECTOR (FIRST INTEGRATED CAPITAL MANAGEMENT LIMITED)
[VSPBONDETF]>> DAILY INDICATIVE PRICES
[XNSA]>> NGX FIXED INCOME INDICATIVE PRICE LIST FOR OCT 08, 2025
[XNSA]>> CLOSING GONG CEREMONY BY ZENITH BANK PLC
[XNSA]>> UPDATED- SAVE THE DATE: 29TH ANNUAL STOCKBROKERS CONFERENCE
[XNSA]>> CORDROS MILESTONE FUNDS' BID & OFFER PRICES
[XNSA]>> SUSPENSION OF TRADING IN THE SHARES OF SMART PRODUCTS NIGERIA PLC
[XNSA]>> AELP CAPACITY BUILDING & ASSDA FORUM
[STANBICETF30]>> DAILY INDICATIVE PRICES
[XNSA]>> NOTIFICATION OF PRICE ADJUSTMENT
Chart Of The Day - ASI Chart Vs ASI Advance Decline Line (YTD) (07-Oct-2025 15:07:14.222)
InfoWARE AI Analyst Daily Market Report: 07-Oct-2025
[SIAMLETF40]>> DAILY INDICATIVE PRICES
[XNSA]>> CLOSING GONG CEREMONY BY ZENITH BANK PLC
[XNSA]>> LISTING OF FGN SAVINGS BONDS FOR SEPTEMBER 2025
Get IDIA - the stock trading app for the modern investor
Solutions by Business
Product Suites
Company
Contacts
- 8th Floor,
- South Atlantic Petroleum Towers,
- 1 Adeola Odeku Street,
- Victoria Island,
- Lagos, Nigeria.
- Email: solutions@infowarelimited.com
Follow Us
 |
 |
 |
 |