


InfoWARE Analyst Daily Market Report (20-Feb-2025 15:08:43.384) | InfoWARE Finance
Get IDIA - the stock trading app for the modern investor


InfoWARE Analyst Daily Market Report (20-Feb-2025 15:08:43.384)
(Source: InfoWARE Terminal, Date: 20-Feb-2025)
Dear Investor,
Daily Market Summary - February 20, 2025
Today, the Nigerian Stock Exchange (NGX) experienced a slight dip, with the All Share Index (ASI) closing down by -0.04% at 108,609.51. Despite this minor setback, the market has shown a 5.22% increase year-to-date, indicating a generally positive trend for the year thus far. Trading volume saw a notable increase, rising to 416.37 million shares, although market turnover decreased by -4.61% to 7.87 billion Naira. The market breadth remained positive with 36 advancers outpacing 29 decliners, suggesting a resilient underlying demand for equities.
Significant Trends in Market Breadth:
- Market Breadth: Positive with a ratio of 1.24x (36 advancers vs. 29 decliners).
- Volume Trends: Increased trading volume for 72 listed companies, while 69 saw declines.
- Turnover Decrease: A -4.61% drop in market turnover could indicate cautious sentiment among investors.
Highlights of the Top Gainers and Losers:
Top Gainers:- FG212035S1: Closed at 112.00, up 12.00%.
- LOTUS HALAL EQUITY ETF: Closed at 43.96, up 9.98%.
- UNIVERSITY PRESS PLC: Closed at 5.05, up 9.78%.
- SOVEREIGN TRUST INSURANCE PLC: Closed at 1.26, up 9.57%.
- REGENCY ALLIANCE INSURANCE COMPANY PLC: Closed at 0.71, up 7.58%.
- ABBEY BUILDING SOCIETY PLC: Closed at 3.41, down 10.00%.
- NEWGOLD ETF: Closed at 39,500, down -11.63%.
- UNION DICON SALT PLC: Closed at 6.00, down -9.77%.
- DEAP CAPITAL MANAGEMENT & TRUST PLC: Closed at 0.92, down -7.07%.
- COMPUTER WAREHOUSE GROUP PLC: Closed at 8.20, down -5.75%.
Insights and Predictions:
- Turnover Decrease: The -4.61% decrease in turnover may suggest a cautious approach from investors, potentially due to external economic factors or profit-taking after recent gains.
- Advancing vs. Declining Stocks: The positive breadth indicates that while some stocks are under pressure, there is still significant buying interest in others, particularly in sectors like insurance and ETFs.
- Unusual Volume Movements: Stocks like ELLAH LAKES PLC and UNION DICON SALT PLC showed unusual volume, with ELLAH LAKES trading 136.68 million shares, significantly above its 90-day average of 6.06 million. This could indicate a potential shift in investor sentiment or news affecting these companies.
- YTD Trends: The LOTUS HALAL EQUITY ETF continues to lead YTD gains with a 46.53% increase, suggesting strong investor confidence in this fund. Conversely, UNION DICON SALT PLC has seen a -16.67% decline YTD, indicating potential challenges in its operational environment.
High Dividend Yield Stocks:
- SOVEREIGN TRUST INSURANCE PLC: With a dividend yield of 2.18%, this stock is showing bullish momentum and could be an attractive option for income-focused investors.
- UNION DICON SALT PLC: Despite its recent losses, it has a dividend yield that may appeal to investors looking for income, but caution is advised given its bearish momentum.
Suggestions for Traders:
- Opportunities: Consider monitoring stocks that have crossed above their 15-day moving averages, such as UNIVERSITY PRESS PLC and INTERNATIONAL ENERGY INSURANCE, as they may present buying opportunities.
- Cautions: Be wary of stocks showing bearish momentum, particularly those that have crossed below their 15-day moving averages, like JAIZ BANK PLC and NEWGOLD ETF. These may continue to face selling pressure.
Year-To-Date (YTD) Gainers and Losers
| Top Gainers | %ChgYTD | Top Losers | %ChgYTD |
|---|---|---|---|
| LOTUS HALAL EQUITY ETF | 46.53% | UNION DICON SALT PLC | -16.67% |
| CONSOLIDATED HALLMARK INSURANCE PLC | 1.32% | VETIVA S & P NIGERIA SOVEREIGN BOND ETF | -31.43% |
| SUNU ASSURANCES NIGERIA PLC | -42.15% | NEWGOLD ETF | 35.73% |
| FG212035S1 | 12.00% | OMATEK VENTURES PLC | -6.25% |
| BUA FOODS PLC | 0.72% | ROYAL EXCHANGE PLC | -19.09% |
In summary, while the market faced a slight decline today, the overall year-to-date performance remains positive. Investors should remain vigilant, particularly with stocks showing unusual volume and those crossing key moving averages, as these could signal potential trading opportunities or risks.
``` This summary provides a comprehensive overview of the market's performance, highlighting key trends, insights, and actionable suggestions for both retail investors and professional traders.
|
Top ASI Gainers Over Last 5 Trading Days
|
Top ASI Losers Over Last 5 Trading Days
|
For more detailed analysis, on InfoWARE Market Data Terminal <NSEPERF> <GO>
On InfoWARE Finance Mobile App (Android, iPhone & iPad, Windows Phone and Windows 8/10), "Top Gainers & Losers"
FG212035S1 (FG212035S1) topped the advancers list closing at N112.00 with a gain of 12.00% followed by ABBEY BUILDING SOCIETY PLC (ABBEYBDS) which closed at N3.41 with a gain of 10.00%.
On the flip side NEWGOLD EXCHANGE TRADED FUND (ETF) (NEWGOLD) and UNION DICON SALT PLC. (UNIONDICON) topped the decliners log with a loss of -11.63% at a close of N39,500.00, and -9.77% to close the day at N6.00 respectively.
| Symbol | LClose | %Chg |
|---|---|---|
| FG212035S1 | 112.00 | 12.00 |
| ABBEYBDS | 3.41 | 10.00 |
| LOTUSHAL15 | 43.96 | 9.98 |
| UPL | 5.05 | 9.78 |
| SOVRENINS | 1.26 | 9.57 |
| Symbol | LClose | %Chg |
|---|---|---|
| NEWGOLD | 39,500.00 | -11.63 |
| UNIONDICON | 6.00 | -9.77 |
| DEAPCAP | 0.92 | -7.07 |
| CWG | 8.20 | -5.75 |
| Ikejahotel | 11.90 | -5.56 |
For more detailed analysis,
- On InfoWARE Market Data Terminal <TOPG> <GO>
- On InfoWARE Finance Mobile App ( Android, iPhone & iPad and Windows 10) , "Top Gainers & Losers"
Currency Market
In the currency market, the Naira appreciated 0.22%(3.38) against the Dollar to settle at 1 to 1NSE: Bull Signal - Price crossed above 15 Day MA
This signal implies these stocks are under buying pressure and the price might continue to rise and therefore positions should be monitored closely. Further suggested analysis include looking at the overall market (ASI) to see if the uptrend is market wide, sector wide or specific to the stock. Portfolio managers tend to use this as a signal to do more research to add to their positions or lock in some profits. Typically further analysis should be done using commands like PC and RV on the InfoWARE Market Data Terminal. Another command is ALERTS to set price triggers for possible exit or entry as necessary
For more detailed analysis,
- On InfoWARE Market Data Terminal <NSEPERF> <GO>
- On InfoWARE Finance Mobile App ( Android , iPhone & iPad and Windows 10) , "Top Gainers & Losers"
| Symbol | Price | %Chg | 15DMA | PE | EPS | DivY | MktCap | Vol | Trades | Value | LstTradeTime |
|---|---|---|---|---|---|---|---|---|---|---|---|
| UPL | 5.05 | 8.91 | 5.04 | 7.13 | 0.59 | 0.60 | 2.18B | 794.30K | 33.00 | 3.85M | 20-Feb-2025 14:30:28.373 |
| INTENEGINS | 2.36 | 6.36 | 2.25 | 0.52 | 2.85 | 3.40 | 3.03B | 2.08M | 36.00 | 4.62M | 20-Feb-2025 14:30:26.530 |
| LINKASSURE | 1.45 | 4.83 | 1.44 | 59.89 | 0.02 | 5.56 | 20.30B | 1.01M | 30.00 | 1.47M | 20-Feb-2025 14:30:26.790 |
| GREENWETF | 534.00 | 3.56 | 527.13 | 0.00 | 0.00 | 27.00 | 4.00 | 14.42K | 20-Feb-2025 14:30:56.373 | ||
| NGXSOVBND | 621.62 | 0.20 | 620.48 | 0.00 | 0.00 | 0.00 | 0.00 | 0.00 | 0.00 | 0.00 | 20-Feb-2025 14:30:34.560 |
NSE: BEAR Signal - Price crossed below 15 Day MA
This signal implies these stocks are under selling pressure and the price might continue to slide and therefore positions should be monitored closely. Further suggested analysis include looking at the overall market (ASI) to see if the downtrend is market wide, sector wide or specific to the stock. If the overal market trend is upwards, then since these stocks are heading in the opposite direction, then further analysis should be done using commands like PC and RV on the InfoWARE Market Data Terminal. Another command is ALERTS to set price triggers for possible exit is necessar
For more detailed analysis,
- On InfoWARE Market Data Terminal <BEARM> <GO>
- On InfoWARE Finance Mobile App ( Android , iPhone & iPad and Windows 10)
| Symbol | Price | %Chg | 15DMA | PE | EPS | DivY | MktCap | Vol | Trades | Value | LstTradeTime |
|---|---|---|---|---|---|---|---|---|---|---|---|
| JAIZBANK | 3.40 | 0.00 | 3.41 | 83.05 | 0.03 | 1.67 | 117.44B | 17.40M | 238.00 | 58.59M | 20-Feb-2025 14:30:26.567 |
| NGXCOMMDTY | 1,008.43 | -0.50 | 1,011.79 | 0.00 | 0.00 | 0.00 | 0.00 | 0.00 | 20-Feb-2025 14:30:34.300 | ||
| NGXCG | 3,107.16 | -0.75 | 3,115.81 | 443.35 | 327.97 | 0.00 | 0.00 | 149.55M | 6,563.00 | 5.44B | 20-Feb-2025 14:30:34.260 |
| NGXMERIVAL | 11,164.45 | -0.94 | 11,263.28 | 12.13 | 38.38 | 0.00 | 0.00 | 81.52M | 3,336.00 | 2.76B | 20-Feb-2025 14:30:34.450 |
| UCAP | 22.60 | -1.33 | 22.82 | 19.15 | 0.93 | 5.03 | 135.60B | 9.10M | 294.00 | 205.83M | 20-Feb-2025 14:30:28.220 |
| ACCESSCORP | 26.90 | -2.23 | 27.49 | 8.56 | 2.81 | 1.87 | 956.17B | 13.62M | 599.00 | 370.03M | 20-Feb-2025 14:30:56.670 |
| NB | 34.00 | -2.94 | 34.34 | 16.95 | 1.60 | 3.79 | 349.39B | 1.92M | 141.00 | 65.87M | 20-Feb-2025 14:30:55.913 |
| MANSARD | 9.10 | -3.85 | 9.33 | 31.16 | 0.24 | 4.59 | 81.90B | 1.36M | 56.00 | 12.38M | 20-Feb-2025 14:30:26.823 |
| IKEJAHOTEL | 11.90 | -5.88 | 12.21 | 51.55 | 0.16 | 0.94 | 24.74B | 701.59K | 54.00 | 8.25M | 20-Feb-2025 14:30:26.303 |
| CWG | 8.20 | -6.10 | 8.35 | 0.00 | 0.00 | 2.46 | 20.70B | 658.28K | 47.00 | 5.42M | 20-Feb-2025 14:30:25.267 |
| FGSUK2032S5 | 98.00 | -8.11 | 100.42 | 0.00 | 0.00 | 5.00 | 1.00 | 4.90K | 20-Feb-2025 14:30:33.617 | ||
| NEWGOLD | 39,500.00 | -13.16 | 42,853.50 | 0.00 | 0.00 | 0.00 | 0.00 | 7.00 | 3.00 | 276.50K | 20-Feb-2025 14:30:56.443 |
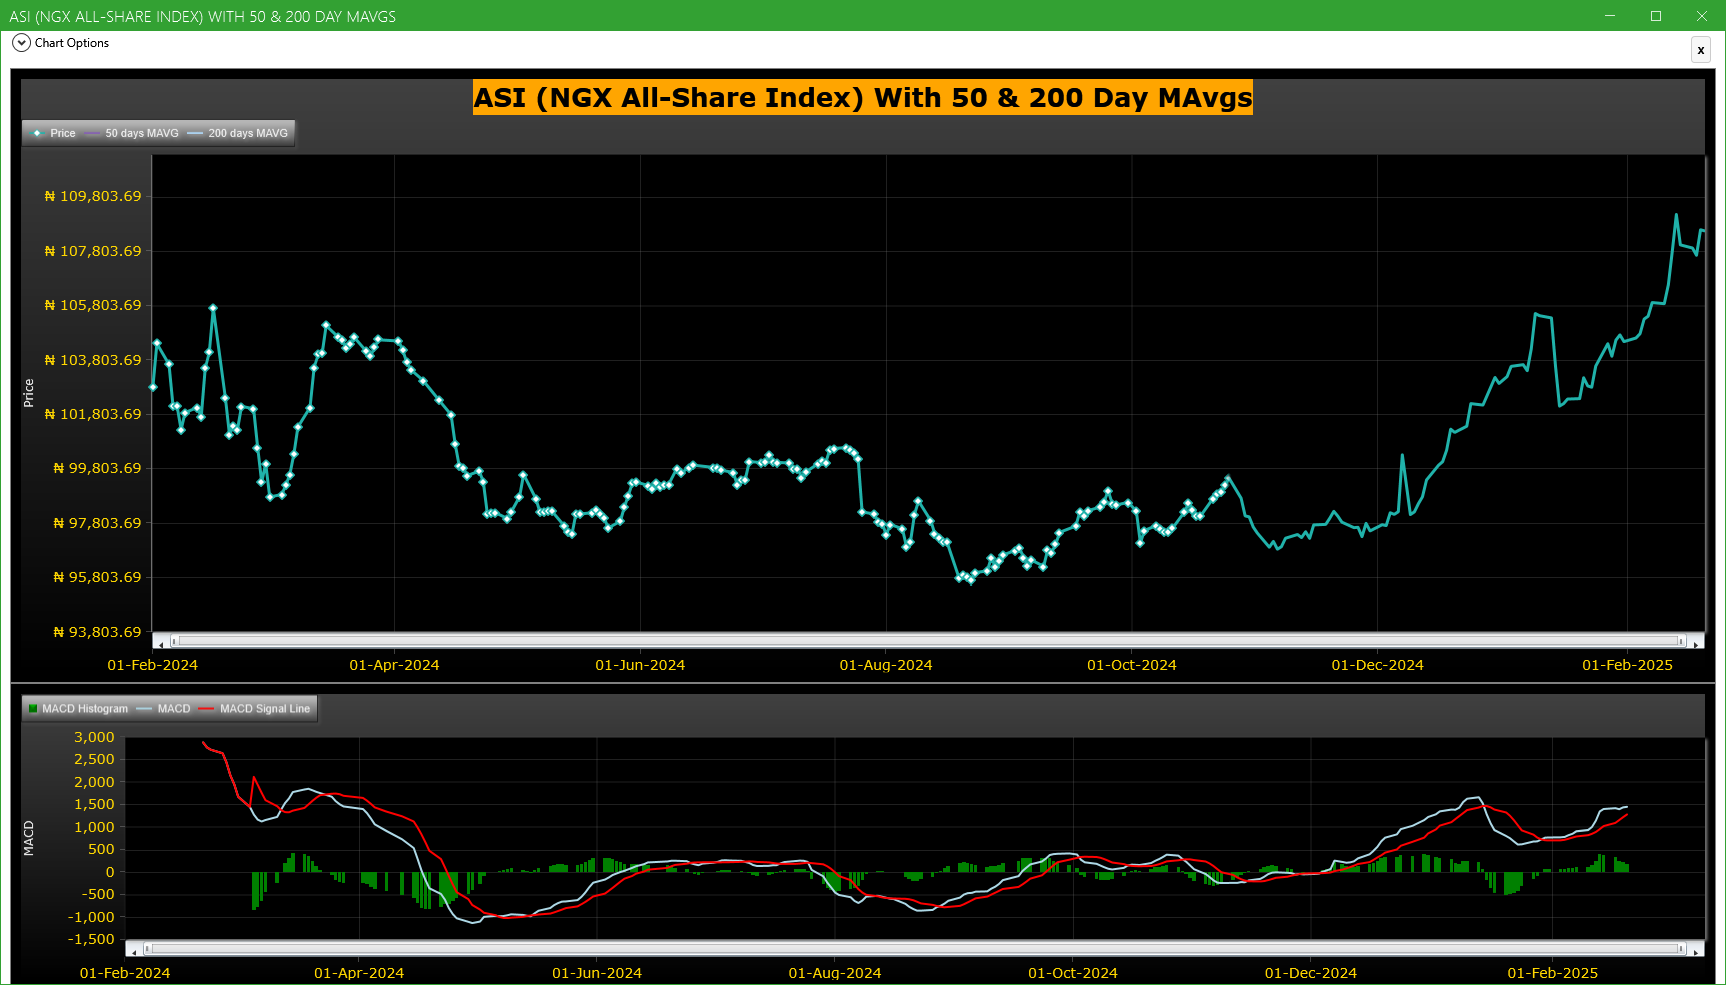
Market Trend - ASI (NGX All-Share-Index) With 50 & 200 Day MAvgs Chart
Technical traders typically use the 50 & 200 day moving averages to aid in choosing
where to enter or exit a position, which then causes these levels to act as strong
support or resistance. As a general guideline, if the price is above a moving average,
the trend is up. If the price is below a moving average, the trend is down.
It is important to note that critics of technical analysis say that moving averages act
as support and resistance because so many traders use these indicators to inform their
trading decisions. Also moving averages tend to work quite well in strong trending conditions
but poorly in choppy or ranging conditions.
Trading Strategies: Crossovers
Crossovers are one of the main moving average strategies. The first type is a price crossover,
which is when the price crosses above or below a moving average to signal a potential change
in trend. Another strategy is to apply two moving averages to a chart: one longer and one
shorter. When the shorter-term MA crosses above the longer-term MA, it is a buy signal, as
it indicates that the trend is shifting up. This is known as a golden cross. Meanwhile, when
the shorter-term MA crosses below the longer-term MA, it is a sell signal, as it indicates that
the trend is shifting down. This is known as a dead/death cross
For more detailed analysis,
- On InfoWARE Market Data Terminal <CI> <GO>
- On InfoWARE Finance Mobile App ( Android , iPhone & iPad and Windows 10) , "Research"
Unusual Volume: Volume traded is more than double the 90 day moving average (All exchanges; ASI & ASem). For more detailed analysis,
- On InfoWARE Market Data Terminal <UV> <GO>
- On InfoWARE Finance Mobile App ( Android , iPhone & iPad and Windows 10)
| Symbol | Name | Volume | 90DAvgVol | %VolChg | Price | LClose | %Chg | Trades | Value |
|---|---|---|---|---|---|---|---|---|---|
| ELLAHLAKES | ELLAH LAKES PLC. | 136.68M | 6.06M | 2,155.70 | 3.21 | 3.22 | -0.31 | 172 | 440.16M |
| DAARCOMM | DAAR COMMUNICATIONS PLC | 8.70M | 1.76M | 393.70 | 0.63 | 0.64 | -1.56 | 65 | 5.58M |
| OMATEK | OMATEK VENTURES PLC | 5.50M | 2.35M | 133.53 | 0.75 | 0.75 | 0.00 | 33 | 4.14M |
| TIP | THE INITIATES PLC | 2.86M | 1.22M | 134.73 | 4.30 | 4.01 | 7.23 | 45 | 12.37M |
| UNIONDICON | UNION DICON SALT PLC. | 2.14M | 60.18K | 3,456.50 | 6.00 | 6.65 | -9.77 | 53 | 14.14M |
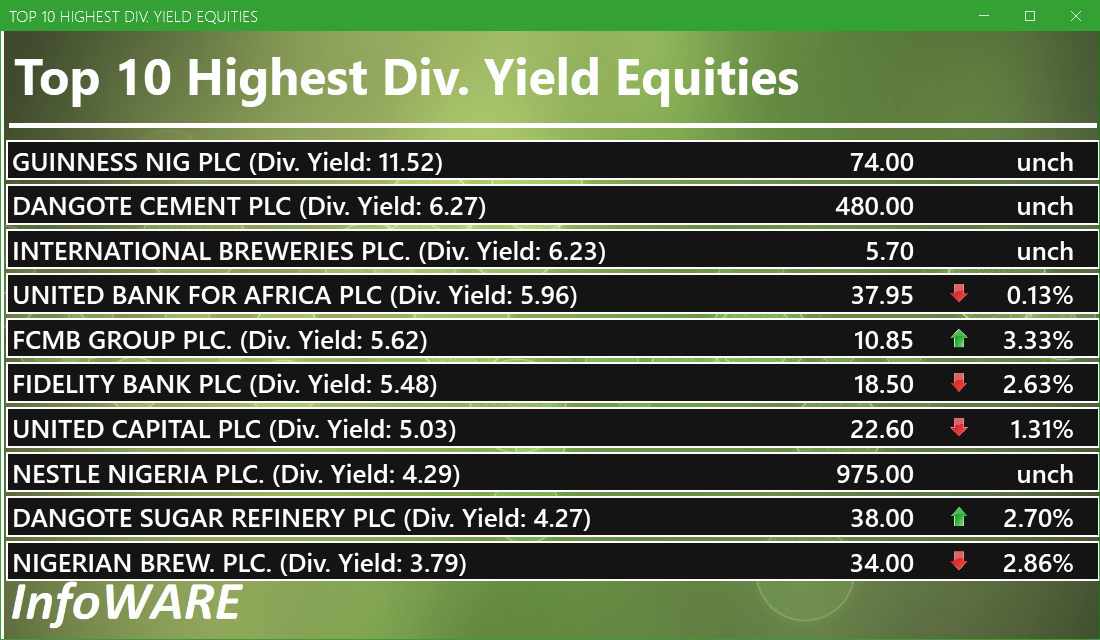
Investment Insights - High Div. Stocks
Dividend stocks distribute a portion of the company earnings to investors on a regular basis and they can a great choice for investors looking for regular income. As an investment or trading strategy, high dividend yield equities provide annual cash payments as against mostly capital gains in the price of a stock. The list in the table below represent the highest dividend paying stocks from the list of the most liquid stocks in the NSE top 30.
For more detailed analysis,
- On InfoWARE Market Data Terminal <HYIELD> <GO>
- On InfoWARE Finance Mobile App ( Android , iPhone & iPad and Windows 10) , "Research"
African Markets
| Name | LClose | Change | %Chg |
|---|---|---|---|
| BRVM Stock Exchange | 287.74 | 1.80 | 0.63 |
| Botswana Stock Exchange | 10,067.39 | 2.01 | 0.02 |
| Egyptian Exchange | 30,875.28 | 287.52 | 0.94 |
| Ghana Stock Exchange | 5,510.82 | 97.97 | 1.81 |
| Johannesburg Stock Exchange | 88,341.88 | -721.41 | -0.81 |
| Lusaka Stock Exchange | 15,422.93 | -21.62 | -0.14 |
| Casablanca Stock Exchange | 16,869.61 | 163.72 | 0.98 |
| Malawi Stock Exchange | 252,335.93 | 2,893.53 | 1.16 |
| Nigeria Stock Exchange | 108,609.51 | 936.75 | 0.87 |
| Nairobi Securities Exchange | 133.86 | 1.13 | 0.85 |
| Namibian Stock Exchange | 1,764.89 | -17.29 | -0.97 |
| Rwanda Stock Exchange | 148.89 | 0.00 | 0.00 |
| Tunis Stock Exchange | 10,412.68 | 24.93 | 0.24 |
| Uganda Securities Exchange | 1,299.29 | -5.74 | -0.44 |
Nigeria Market Indexes
| Symbol | LClose | %Chg | WTD% | MTD% | QTD% | YTD% | MktCap | Trades |
|---|---|---|---|---|---|---|---|---|
| ASI | 108,568.50 | -0.04 | 0.58 | 3.76 | 5.22 | 5.22 | 12,738 | |
| NGX30 | 4,039.63 | 0.03 | 0.72 | 4.04 | 5.89 | 5.89 | 6,693 | |
| NGXAFRBVI | 2,729.74 | -0.98 | -2.22 | 1.59 | 10.04 | 10.04 | 2,322 | |
| NGXAFRHDYI | 17,887.69 | -0.65 | -0.88 | 0.63 | 5.05 | 5.05 | 2,702 | |
| NGXASEM | 1,585.91 | 0.03 | 0.03 | 0.14 | 0.14 | 0.14 | 8 | |
| NGXBNK | 1,209.39 | -0.68 | -2.29 | 2.01 | 11.22 | 11.22 | 2,912 | |
| NGXCG | 3,107.16 | -0.74 | -1.88 | 2.42 | 9.82 | 9.82 | 6,563 | |
| NGXCNSMRGDS | 1,834.83 | 0.69 | 4.47 | 2.05 | 5.79 | 5.79 | 1,535 | |
| NGXGROWTH | 7,889.06 | 0.30 | -0.35 | -4.67 | 1.63 | 1.63 | 69 | |
| NGXINDUSTR | 3,635.07 | 0.01 | -0.17 | 11.36 | 1.78 | 1.78 | 1,066 | |
| NGXINS | 752.39 | 0.53 | 3.47 | 5.39 | -4.30 | -4.30 | 814 | |
| NGXLOTUSISLM | 7,701.08 | 0.03 | 1.13 | 4.80 | 10.52 | 10.52 | 2,126 | |
| NGXMAINBOARD | 5,168.90 | 0.08 | 1.41 | 1.27 | 3.30 | 3.30 | 9,384 | |
| NGXMERIGRW | 7,450.63 | 0.28 | -1.04 | 0.57 | 14.22 | 14.22 | 1,624 | |
| NGXMERIVAL | 11,164.45 | -0.93 | -2.33 | 1.76 | 7.04 | 7.04 | 3,336 | |
| NGXOILGAS | 2,561.30 | -1.03 | -1.24 | -4.03 | -5.53 | -5.53 | 402 | |
| NGXPENBRD | 1,936.37 | -0.04 | 0.68 | 4.15 | 5.72 | 5.72 | 9,575 | |
| NGXPENSION | 4,910.08 | -0.34 | -0.95 | 2.49 | 8.29 | 8.29 | 7,419 | |
| NGXPREMIUM | 10,593.67 | -0.25 | -0.87 | 8.60 | 8.84 | 8.84 | 3,285 | |
| NGXSOVBND | 621.62 | 0.20 | 0.20 | 0.20 | 3.34 | 3.34 | 0 |
For more detailed analysis,
- On InfoWARE Market Data Terminal <MKTINS> <GO>
- On InfoWARE Finance Mobile App ( Android, iPhone & iPad and Windows 10) , "Market Indexes"
Find the topic interesting? Will like to comment? Contact Us at solutions@infowarelimited.com
Top News

InfoWARE AI Analyst Daily Market Report: 21-Feb-2025
Chart Of The Day - ASI Chart Vs ASI Advance Decline Line (YTD) (21-Feb-2025 15:08:30.153)
InfoWARE Analyst Daily Market Report (21-Feb-2025 15:08:26.067)

[XNSA]>> CORDROS MILESTONE FUNDS' BID & OFFER PRICES
[XNSA]>> NGX FIXED INCOME INDICATIVE PRICE LIST FOR FEB 21, 2025
[VETINDETF]>> DAILY INDICATIV PRICES
[LOTUSHAL15]>> DAILY INDICATIV PRICES
[XNSA]>> EMERGING AFRICA DAILY MUTUAL FUND PRICES
[XNSA]>> DAILY FUND PRICE SUBMISSION - FCMB ASSET MANAGEMENT LIMITED
[XNSA]>> ACTIVATION OF CODE FOR TRADING IN RIGHTS
[XNSA]>> JOINT TRAINING ORGANIZED BY THE CIS ACADEMY AND LAGOS BUSINESS SCHOOL
Chart Of The Day - ASI Chart Vs ASI Advance Decline Line (YTD) (20-Feb-2025 15:08:47.387)
InfoWARE Analyst Daily Market Report (20-Feb-2025 15:08:43.384)
[XNSA]>> CORDROS MILESTONE FUNDS' BID & OFFER PRICES

Media Highlights 20-02-2025

Daily Business News Brief
[HONYFLOUR]>>Corporate Disclosures-<HONEYWELL FLOUR MILL PLC>
NIGERIAN TREASURY BILL AUCTION RESULT FOR 19TH FEBRUARY, 2025
CSL Nigeria Daily - 20 February 2025
[MERGROWTH]>> DAILY INDICATIVE PRICES
[XNSA]>> EMERGING AFRICA DAILY MUTUAL FUND PRICES
[VSPBONDETF]>> DAILY INDICATIVE PRICES
[XNSA]>> DAILY FUND PRICE SUBMISSION - FCMB ASSET MANAGEMENT LIMITED
[XNSA]>> NGX FIXED INCOME INDICATIVE PRICE LIST FOR FEB 20, 2025
[XNSA]>> ACTIVATION OF CODE FOR TRADING IN RIGHTS
[XNSA]>> JOINT TRAINING ORGANIZED BY THE CIS ACADEMY AND LAGOS BUSINESS SCHOOL
[LOTUSHAL15]>> DAILY INDICATIVE PRICES
[SIAMLETF40]>> DAILY INDICATIVE PRICES
Chart Of The Day - ASI Chart Vs ASI Advance Decline Line (YTD) (19-Feb-2025 15:07:43.687)
InfoWARE Analyst Daily Market Report (19-Feb-2025 15:07:39.715)
Get IDIA - the stock trading app for the modern investor
Solutions by Business
Product Suites
Company
Contacts
- 8th Floor,
- South Atlantic Petroleum Towers,
- 1 Adeola Odeku Street,
- Victoria Island,
- Lagos, Nigeria.
- Email: solutions@infowarelimited.com
Follow Us
 |
 |
 |
 |