


InfoWARE Analyst Daily Market Report (21-Feb-2025 15:08:26.067) | InfoWARE Finance
Get IDIA - the stock trading app for the modern investor


InfoWARE Analyst Daily Market Report (21-Feb-2025 15:08:26.067)
(Source: InfoWARE Terminal, Date: 21-Feb-2025)
Dear Investor,
Market Summary for the Week Ending February 21, 2025
This week, the Nigerian stock market exhibited a mixed performance with the All Share Index (ASI) closing at 108,497.40, marking a 0.52% increase from the previous week. Despite the positive close, market turnover and volume traded saw a significant decline, with turnover down by 12.76% and volume down by 21.77%. The market sentiment was somewhat cautious, as indicated by the market breadth ratio of 0.52x, with more decliners than advancers.
Key Highlights
- Market Breadth: The market breadth was negative with 33 advancers and 63 decliners, resulting in a breadth ratio of 0.52x. This indicates a bearish sentiment as more stocks declined than advanced.
- Top Gainers:
- LOTUS HALAL EQUITY ETF (LOTUSHAL15) surged by 33.05%, showing strong momentum with an RSI of 66.70.
- ABBEY BUILDING SOCIETY PLC (ABBEYBDS) rose by 16.13%, with a high RSI of 77.13, indicating overbought conditions.
- DANGOTE SUGAR REFINERY PLC (DANGSUGAR) increased by 13.27%, supported by a solid YTD gain of 27.38%.
- Top Losers:
- UNION DICON SALT PLC (UNIONDICON) fell by 26.38%, with a low RSI of 20.27, indicating oversold conditions.
- VETIVA S & P NIGERIA SOVEREIGN BOND ETF (VSPBONDETF) dropped by 25.00%, continuing its YTD decline of 31.43%.
Insights and Predictions
- Turnover Implications: The decrease in market turnover suggests a cautious approach by investors, possibly due to uncertainties or profit-taking activities.
- Advancing vs. Declining Stocks: The higher number of decliners indicates a bearish trend, but the presence of strong gainers suggests selective buying in specific sectors.
- Unusual Volume Movements: Stocks like OANDO and ZENITHBANK saw significant institutional trading, indicating potential interest from large investors.
- YTD Trends: Stocks like DANGSUGAR and ABBEYBDS show strong YTD performance, suggesting continued investor confidence.
- Bullish Momentum Stocks: ABBEYBDS with an RSI above 70 and positive MACD crossover indicates strong bullish momentum.
- Bearish Momentum Stocks: UNIONDICON with an RSI below 30 and negative MACD crossover suggests bearish momentum.
Index Performance Analysis
The NGX Consumer Goods Index (NGXCNSMRGDS) was the top performer, rising by 5.13% WTD and 6.46% YTD, driven by strong performances in consumer goods stocks. In contrast, the NGX Banking Index (NGXBNK) was the laggard, declining by 2.83% WTD, despite a strong YTD gain of 10.60%.
Sector Comparisons
- The Consumer Goods sector outperformed, likely due to increased consumer spending or favorable earnings reports.
- The Banking sector underperformed, possibly due to profit-taking or regulatory concerns.
Dividend Yield Insights
Stocks with high dividend yields, such as DANGSUGAR, continue to attract investors seeking income, despite market volatility.
Trader Suggestions
- Consider buying into strong momentum stocks like ABBEYBDS, but be cautious of overbought conditions.
- Watch for potential rebounds in oversold stocks like UNIONDICON.
Top Year-To-Date (YTD) Gainers and Losers
| Name | Symbol | %ChgYTD |
|---|---|---|
| DANGOTE SUGAR REFINERY PLC | DANGSUGAR | 27.38% |
| ABBEY BUILDING SOCIETY PLC | ABBEYBDS | 20.00% |
| UNION DICON SALT PLC | UNIONDICON | -16.67% |
| VETIVA S & P NIGERIA SOVEREIGN BOND ETF | VSPBONDETF | -31.43% |
Top Week-To-Date (WTD) Gainers and Losers
| Name | Symbol | %ChgWTD |
|---|---|---|
| LOTUS HALAL EQUITY ETF | LOTUSHAL15 | 33.05% |
| ABBEY BUILDING SOCIETY PLC | ABBEYBDS | 16.13% |
| UNION DICON SALT PLC | UNIONDICON | -26.38% |
| VETIVA S & P NIGERIA SOVEREIGN BOND ETF | VSPBONDETF | -25.00% |
This week’s market activity reflects a complex interplay of investor sentiment, sector performance, and economic indicators. As always, investors should remain vigilant and consider both technical and fundamental analyses when making trading decisions.
``` This summary provides a comprehensive overview of the market's performance, highlighting key trends, insights, and actionable suggestions for investors.
|
Top ASI Gainers Over Last 5 Trading Days
|
Top ASI Losers Over Last 5 Trading Days
|
For more detailed analysis, on InfoWARE Market Data Terminal
<NSEPERF> <GO>
On InfoWARE Finance Mobile App (
Android
,
iPhone
&
iPad
,
Windows Phone
and
Windows 8/10
)
, "Top Gainers & Losers"
CHAMPION BREW. PLC. (CHAMPION) topped the advancers list closing at N4.12 with a gain of 9.87% followed by DANGOTE SUGAR REFINERY PLC (DANGSUGAR) which closed at N41.40 with a gain of 8.95%.
On the flip side STANBIC IBTC ETF 30 (STANBICETF30) and THE SIAML PENSION ETF 40 (SIAMLETF40) topped the decliners log with a loss of -10.00% at a close of N405.00, and -9.90% to close the day at N564.00 respectively.
| Symbol | LClose | %Chg |
|---|---|---|
| CHAMPION | 4.12 | 9.87 |
| DANGSUGAR | 41.40 | 8.95 |
| OMATEK | 0.81 | 8.00 |
| DAARCOMM | 0.68 | 7.94 |
| DEAPCAP | 0.99 | 7.61 |
| Symbol | LClose | %Chg |
|---|---|---|
| STANBICETF30 | 405.00 | -10.00 |
| SIAMLETF40 | 564.00 | -9.90 |
| Ikejahotel | 11.00 | -7.56 |
| ACADEMY | 2.78 | -7.33 |
| TIP | 4.00 | -6.98 |
For more detailed analysis,
- On InfoWARE Market Data Terminal <TOPG> <GO>
- On InfoWARE Finance Mobile App ( Android , iPhone & iPad and Windows 10 ) , "Top Gainers & Losers"
Currency Market
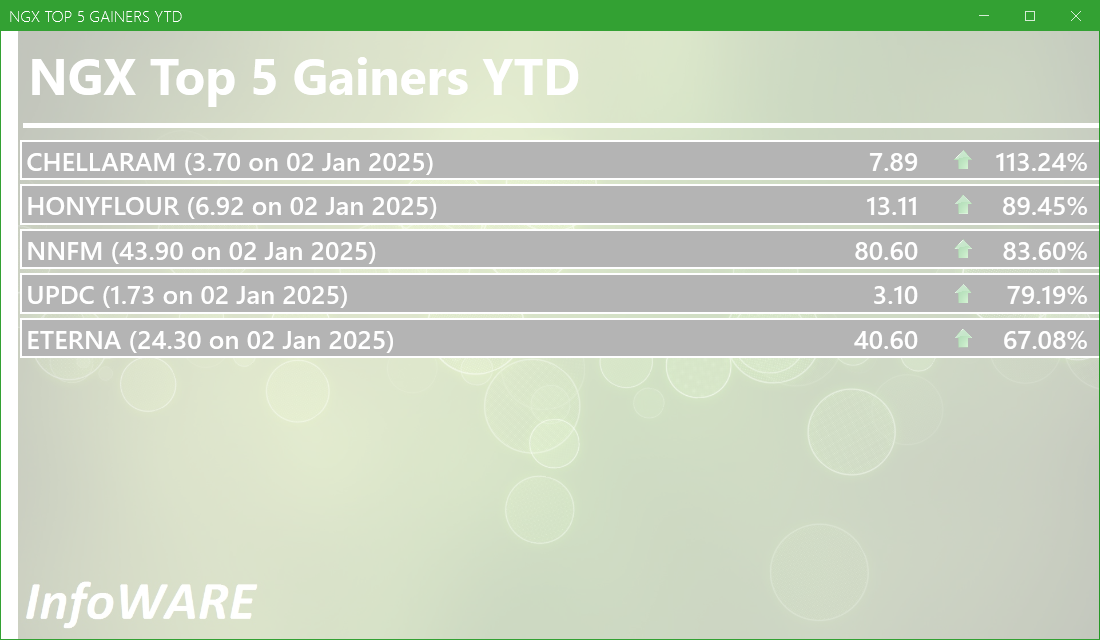
In the currency market, the Naira appreciated 0.06%(0.94) against the Dollar to settle at 1 to 1Investment Insights - Top 5 Gainers YTD
These stocks are the best performers whose price has risen faster than the market as a whole with the best returns year to date. Momentum investors believe that stocks that have outperformed the market will often continue to do so because the factors that caused them to outperform will not suddenly disappear. In addition, other investors seeking to benefit from the stock’s outperformance will often purchase the stock, further bidding its price higher and pushing the stock higher still
For more detailed analysis,
- On InfoWARE Market Data Terminal <T5YTD2> <GO>
- On InfoWARE Finance Mobile App ( Android , iPhone & iPad and Windows 10 ) , "Research"
NSE: Bull Signal - Price crossed above 15 Day MA
This signal implies these stocks are under buying pressure and the price might continue to rise and therefore positions should be monitored closely. Further suggested analysis include looking at the overall market (ASI) to see if the uptrend is market wide, sector wide or specific to the stock. Portfolio managers tend to use this as a signal to do more research to add to their positions or lock in some profits. Typically further analysis should be done using commands like PC and RV on the InfoWARE Market Data Terminal. Another command is ALERTS to set price triggers for possible exit or entry as necessary
For more detailed analysis,
- On InfoWARE Market Data Terminal <NSEPERF> <GO>
- On InfoWARE Finance Mobile App ( Android , iPhone & iPad and Windows 10 ) , "Top Gainers & Losers"
| Symbol | Price | %Chg | 15DMA | PE | EPS | DivY | MktCap | Vol | Trades | Value | LstTradeTime |
|---|---|---|---|---|---|---|---|---|---|---|---|
| OMATEK | 0.81 | 7.41 | 0.80 | 6.82 | 0.10 | 0.00 | 2.38B | 1.29M | 24.00 | 1.03M | 21-Feb-2025 14:30:41.403 |
| CHAMS | 2.35 | 5.96 | 2.24 | 27.02 | 0.07 | 1.56 | 11.04B | 10.90M | 108.00 | 25.17M | 21-Feb-2025 14:30:33.963 |
| UNIVINSURE | 0.69 | 4.35 | 0.68 | 0.00 | 0.00 | 0.00 | 11.04B | 13.39M | 66.00 | 9.23M | 21-Feb-2025 14:30:42.717 |
| CWG | 8.50 | 3.53 | 8.41 | 0.00 | 0.00 | 2.46 | 21.46B | 3.31M | 104.00 | 26.77M | 21-Feb-2025 14:31:14.467 |
| GTCO | 63.05 | 1.03 | 63.01 | 7.49 | 7.10 | 1.88 | 1,855.64B | 4.19M | 345.00 | 262.51M | 21-Feb-2025 14:31:14.530 |
NSE: BEAR Signal - Price crossed below 15 Day MA
This signal implies these stocks are under selling pressure and the price might continue to slide and therefore positions should be monitored closely. Further suggested analysis include looking at the overall market (ASI) to see if the downtrend is market wide, sector wide or specific to the stock. If the overal market trend is upwards, then since these stocks are heading in the opposite direction, then further analysis should be done using commands like PC and RV on the InfoWARE Market Data Terminal. Another command is ALERTS to set price triggers for possible exit is necessar
For more detailed analysis,
- On InfoWARE Market Data Terminal <BEARM> <GO>
- On InfoWARE Finance Mobile App ( Android , iPhone & iPad and Windows 10 )
| Symbol | Price | %Chg | 15DMA | PE | EPS | DivY | MktCap | Vol | Trades | Value | LstTradeTime |
|---|---|---|---|---|---|---|---|---|---|---|---|
| OKOMUOIL | 536.00 | 0.00 | 536.32 | 65.18 | 5.63 | 0.54 | 511.30B | 65.34K | 112.00 | 36.36M | 21-Feb-2025 14:30:41.387 |
| NGXPENSION | 4,903.92 | -0.13 | 4,907.53 | 429.80 | 359.59 | 0.00 | 0.00 | 148.21M | 6,876.00 | 5.87B | 21-Feb-2025 14:30:51.753 |
| CILEASING | 3.90 | -1.54 | 3.92 | 6.50 | 0.64 | 1.20 | 3.05B | 448.12K | 28.00 | 1.74M | 21-Feb-2025 14:30:33.983 |
| LASACO | 3.10 | -1.61 | 3.12 | 21.56 | 0.11 | 4.05 | 5.68B | 462.32K | 26.00 | 1.39M | 21-Feb-2025 14:31:14.567 |
| NPFMCRFBK | 1.77 | -1.69 | 1.79 | 5.63 | 0.27 | 8.00 | 10.61B | 538.83K | 26.00 | 977.95K | 21-Feb-2025 14:30:41.307 |
| NSLTECH | 0.67 | -2.99 | 0.68 | 0.00 | 0.00 | 15.87 | 3.77B | 711.48K | 30.00 | 473.95K | 21-Feb-2025 14:30:41.340 |
| LINKASSURE | 1.40 | -3.57 | 1.44 | 59.89 | 0.02 | 5.56 | 19.60B | 340.97K | 12.00 | 479.25K | 21-Feb-2025 14:30:40.137 |
| CUTIX | 2.50 | -4.00 | 2.54 | 8.81 | 0.26 | 6.52 | 8.81B | 8.94M | 121.00 | 22.22M | 21-Feb-2025 14:30:34.233 |
Economic Indicators - Nigeria FX Reserves Vs ASI Chart
Nigeria FX Reserves are assets held on reserve by CBN in foreign currencies. These reserves are used to back liabilities and influence monetary policy. Given the nature of the Nigeria economy, FX Reserves can appear to have an outsize influence on the economy and hence on the capital market. The chart below allows comparison of FX Reserves against the ASI to make investment decisions
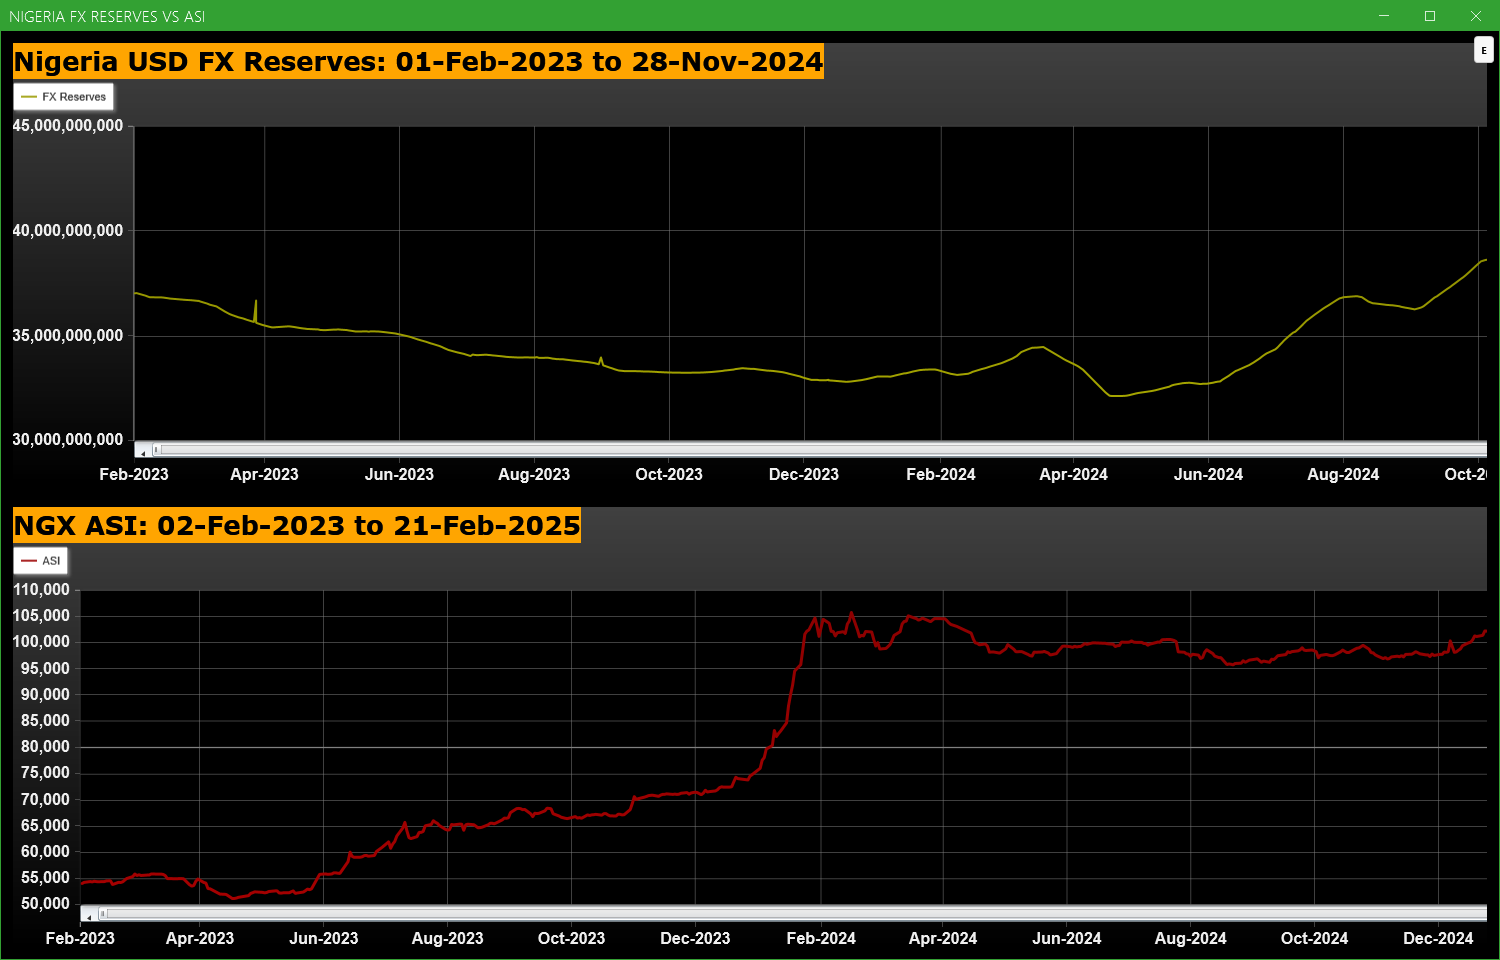
For more detailed analysis,
- On InfoWARE Market Data Terminal <CI> <GO>
- On InfoWARE Finance Mobile App ( Android , iPhone & iPad and Windows 10 ) , "Research"
Market Trend - ASI (NGX All-Share-Index) With 50 & 200 Day MAvgs Chart
Technical traders typically use the 50 & 200 day moving averages to aid in choosing where to enter or exit a position, which then causes these levels to act as strong support or resistance. As a general guideline, if the price is above a moving average, the trend is up. If the price is below a moving average, the trend is down.
It is important to note that critics of technical analysis say that moving averages act as support and resistance because so many traders use these indicators to inform their trading decisions. Also moving averages tend to work quite well in strong trending conditions but poorly in choppy or ranging conditions.
Trading Strategies: Crossovers
Crossovers are one of the main moving average strategies. The first type is a price crossover, which is when the price crosses above or below a moving average to signal a potential change in trend. Another strategy is to apply two moving averages to a chart: one longer and one shorter. When the shorter-term MA crosses above the longer-term MA, it is a buy signal, as it indicates that the trend is shifting up. This is known as a golden cross. Meanwhile, when the shorter-term MA crosses below the longer-term MA, it is a sell signal, as it indicates that the trend is shifting down. This is known as a dead/death cross
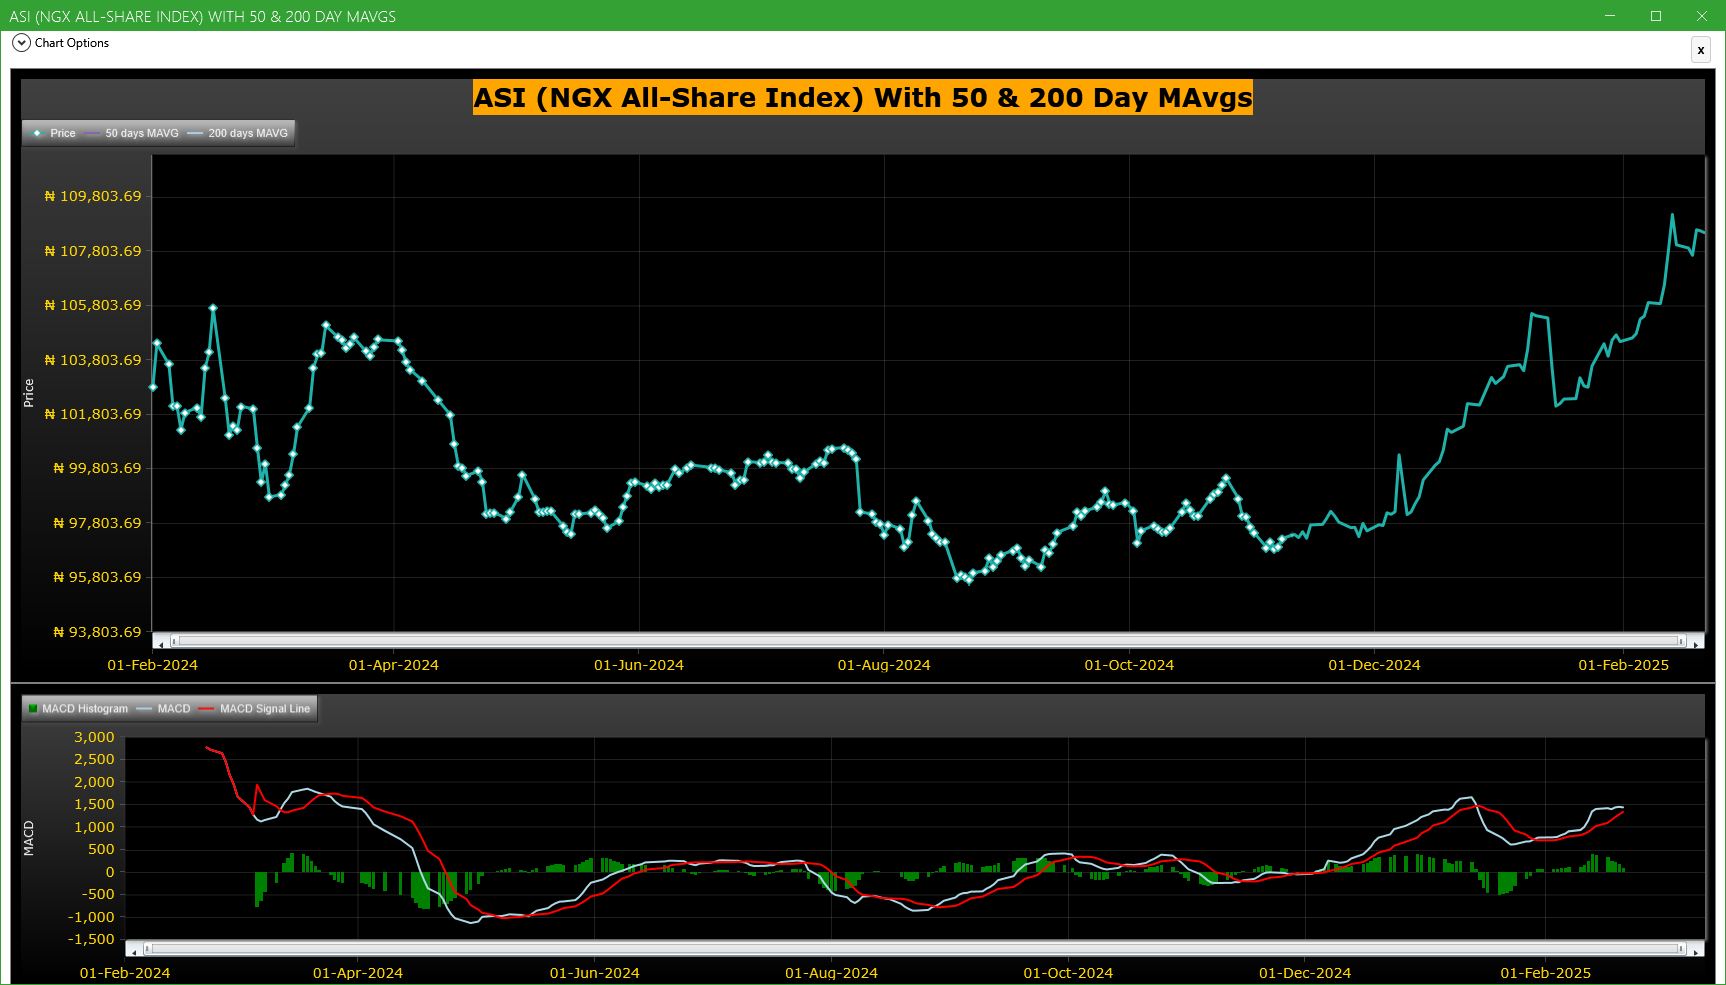
For more detailed analysis,
- On InfoWARE Market Data Terminal <CI> <GO>
- On InfoWARE Finance Mobile App ( Android , iPhone & iPad and Windows 10 ) , "Research"
Unusual Volume: Volume traded is more than double the 90 day moving average (All exchanges; ASI & ASem). For more detailed analysis,
- On InfoWARE Market Data Terminal <UV> <GO>
- On InfoWARE Finance Mobile App ( Android , iPhone & iPad and Windows 10 )
| Symbol | Name | Volume | 90DAvgVol | %VolChg | Price | LClose | %Chg | Trades | Value |
|---|---|---|---|---|---|---|---|---|---|
| ELLAHLAKES | ELLAH LAKES PLC. | 40.47M | 8.22M | 392.53 | 3.21 | 3.21 | 0.00 | 161 | 130.51M |
| NASCON | NATIONAL SALT CO. NIG. PLC | 10.11M | 3.07M | 229.51 | 44.50 | 43.80 | 1.60 | 160 | 443.82M |
| DANGSUGAR | DANGOTE SUGAR REFINERY PLC | 9.78M | 2.52M | 288.10 | 41.40 | 38.00 | 8.95 | 656 | 390.58M |
| ACADEMY | ACADEMY PRESS PLC. | 3.76M | 320.13K | 1,073.32 | 2.78 | 3.00 | -7.33 | 31 | 10.95M |
| REDSTAREX | RED STAR EXPRESS PLC | 469.35K | 199.50K | 135.26 | 6.40 | 6.00 | 6.67 | 20 | 2.90M |
Investment Insights - High Div. Stocks
Dividend stocks distribute a portion of the company earnings to investors on a regular basis and they can a great choice for investors looking for regular income. As an investment or trading strategy, high dividend yield equities provide annual cash payments as against mostly capital gains in the price of a stock. The list in the table below represent the highest dividend paying stocks from the list of the most liquid stocks in the NSE top 30.
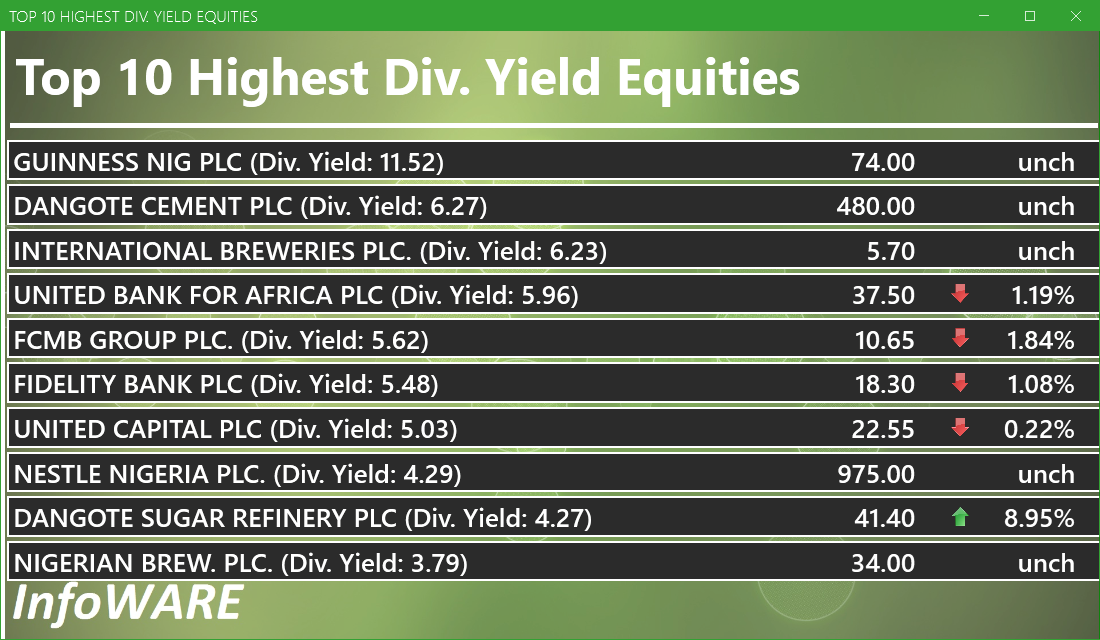
For more detailed analysis,
- On InfoWARE Market Data Terminal <HYIELD> <GO>
- On InfoWARE Finance Mobile App ( Android , iPhone & iPad and Windows 10 ) , "Research"
Investment Insights - Stocks outperforming the ASI but with approximately the same risk
These list of stocks represent equities that are less risky than the ASI but doing better than the ASI (All Shares Index) using the YTD (Year to Date) returns as the measure. The risk is measured by Beta. Beta is an assessment of a stock's tendency to undergo price changes, (its volatility), as well as its potential returns compared to the ASI. It is expressed as a ratio, where a score of 1 represents performance comparable to the ASI, and returns above or below the market may receive scores greater or lower than 1.
For a full list of both positively and negatively corelated stocks visit InfoWARE Market Data Terminal
- On InfoWARE Market Data Terminal <BANL> <GO>
- On InfoWARE Finance Mobile App ( Android , iPhone & iPad and Windows 10 )
| Symbol | DivYield | PE | EPS | Beta | %ChgYTD | ASIYTDReturn | BetaDiff |
|---|---|---|---|---|---|---|---|
| HONYFLOUR | 1.40 | 16.28 | 0.31 | 0.99 | 89.45 | 5.15 | 0.01 |
| FIDELITYBK | 5.48 | 13.24 | 1.17 | 0.89 | 7.65 | 5.15 | 0.11 |
| NB | 3.79 | 16.95 | 1.60 | 0.79 | 6.25 | 5.15 | 0.21 |
| WAPIC | 2.56 | 72.55 | 0.02 | 0.76 | 8.50 | 5.15 | 0.24 |
| UNILEVER | 2.81 | 67.09 | 0.40 | 0.75 | 9.58 | 5.15 | 0.25 |
| HMCALL | 0.00 | 0.00 | 0.00 | -0.74 | 20.53 | 5.15 | 0.26 |
| VETGOODS | 0.00 | 0.71 | 9.01 | 5.15 | 0.29 | ||
| VETGRIF30 | 0.00 | 0.71 | 8.61 | 5.15 | 0.29 | ||
| ABBEYBDS | 1.43 | 0.00 | 0.00 | 0.70 | 20.00 | 5.15 | 0.30 |
| NEM | 6.52 | 24.99 | 0.37 | 0.69 | 9.17 | 5.15 | 0.31 |
African Markets
| Name | LClose | Change | %Chg |
|---|---|---|---|
| BRVM Stock Exchange | 291.22 | 3.48 | 1.21 |
| Botswana Stock Exchange | 10,067.39 | 0.00 | 0.00 |
| Egyptian Exchange | 30,914.72 | 40.14 | 0.13 |
| Ghana Stock Exchange | 5,470.42 | -40.23 | -0.73 |
| Johannesburg Stock Exchange | 88,873.33 | 530.06 | 0.60 |
| Lusaka Stock Exchange | 15,417.83 | -4.63 | -0.03 |
| Malawi Stock Exchange | 256,415.60 | 4,087.71 | 1.62 |
| Nigeria Stock Exchange | 108,568.50 | -43.44 | -0.04 |
| Nairobi Securities Exchange | 133.63 | -0.23 | -0.17 |
| Namibian Stock Exchange | 1,781.44 | 16.59 | 0.94 |
| Rwanda Stock Exchange | 148.89 | 0.00 | 0.00 |
| Tunis Stock Exchange | 10,424.93 | 12.49 | 0.12 |
| Uganda Securities Exchange | 1,304.88 | 5.59 | 0.43 |
Nigeria Market Indexes
| Symbol | LClose | %Chg | WTD% | MTD% | QTD% | YTD% | MktCap | Trades |
|---|---|---|---|---|---|---|---|---|
| ASI | 108,497.40 | -0.07 | 0.52 | 3.70 | 5.15 | 5.15 | 12,642 | |
| NGX30 | 4,036.47 | -0.08 | 0.64 | 3.96 | 5.81 | 5.81 | 6,132 | |
| NGXAFRBVI | 2,714.75 | -0.55 | -2.75 | 1.03 | 9.43 | 9.43 | 2,103 | |
| NGXAFRHDYI | 17,858.96 | -0.16 | -1.04 | 0.46 | 4.88 | 4.88 | 2,767 | |
| NGXASEM | 1,585.91 | 0.00 | 0.03 | 0.14 | 0.14 | 0.14 | 1 | |
| NGXBNK | 1,202.73 | -0.55 | -2.83 | 1.45 | 10.60 | 10.60 | 2,610 | |
| NGXCG | 3,099.37 | -0.25 | -2.12 | 2.17 | 9.55 | 9.55 | 6,209 | |
| NGXCNSMRGDS | 1,846.47 | 0.63 | 5.13 | 2.69 | 6.46 | 6.46 | 1,764 | |
| NGXGROWTH | 7,864.46 | -0.31 | -0.66 | -4.97 | 1.31 | 1.31 | 54 | |
| NGXINDUSTR | 3,638.55 | 0.10 | -0.07 | 11.47 | 1.87 | 1.87 | 777 | |
| NGXINS | 750.54 | -0.25 | 3.22 | 5.13 | -4.53 | -4.53 | 592 | |
| NGXLOTUSISLM | 7,711.49 | 0.14 | 1.27 | 4.94 | 10.67 | 10.67 | 1,456 | |
| NGXMAINBOARD | 5,170.64 | 0.03 | 1.45 | 1.31 | 3.33 | 3.33 | 9,827 | |
| NGXMERIGRW | 7,404.89 | -0.61 | -1.64 | -0.05 | 13.52 | 13.52 | 1,337 | |
| NGXMERIVAL | 11,117.78 | -0.42 | -2.74 | 1.34 | 6.59 | 6.59 | 3,464 | |
| NGXOILGAS | 2,546.46 | -0.58 | -1.81 | -4.59 | -6.07 | -6.07 | 346 | |
| NGXPENBRD | 1,936.06 | -0.02 | 0.66 | 4.13 | 5.70 | 5.70 | 8,681 | |
| NGXPENSION | 4,903.92 | -0.13 | -1.07 | 2.36 | 8.16 | 8.16 | 6,876 | |
| NGXPREMIUM | 10,567.95 | -0.24 | -1.11 | 8.34 | 8.58 | 8.58 | 2,761 | |
| NGXSOVBND | 621.72 | 0.02 | 0.21 | 0.21 | 3.35 | 3.35 | 0 |
For more detailed analysis,
- On InfoWARE Market Data Terminal <MKTINS> <GO>
- On InfoWARE Finance Mobile App ( Android , iPhone & iPad and Windows 10 ) , "Market Indexes"
Find the topic interesting? Will like to comment? Contact Us at solutions@infowarelimited.com
Top News

InfoWARE AI Analyst Daily Market Report: 21-Feb-2025
Chart Of The Day - ASI Chart Vs ASI Advance Decline Line (YTD) (21-Feb-2025 15:08:30.153)
InfoWARE Analyst Daily Market Report (21-Feb-2025 15:08:26.067)

[XNSA]>> CORDROS MILESTONE FUNDS' BID & OFFER PRICES
[XNSA]>> NGX FIXED INCOME INDICATIVE PRICE LIST FOR FEB 21, 2025
[VETINDETF]>> DAILY INDICATIV PRICES
[LOTUSHAL15]>> DAILY INDICATIV PRICES
[XNSA]>> EMERGING AFRICA DAILY MUTUAL FUND PRICES
[XNSA]>> DAILY FUND PRICE SUBMISSION - FCMB ASSET MANAGEMENT LIMITED
[XNSA]>> ACTIVATION OF CODE FOR TRADING IN RIGHTS
[XNSA]>> JOINT TRAINING ORGANIZED BY THE CIS ACADEMY AND LAGOS BUSINESS SCHOOL
Chart Of The Day - ASI Chart Vs ASI Advance Decline Line (YTD) (20-Feb-2025 15:08:47.387)
InfoWARE Analyst Daily Market Report (20-Feb-2025 15:08:43.384)
[XNSA]>> CORDROS MILESTONE FUNDS' BID & OFFER PRICES

Media Highlights 20-02-2025

Daily Business News Brief
[HONYFLOUR]>>Corporate Disclosures-<HONEYWELL FLOUR MILL PLC>
NIGERIAN TREASURY BILL AUCTION RESULT FOR 19TH FEBRUARY, 2025
CSL Nigeria Daily - 20 February 2025
[MERGROWTH]>> DAILY INDICATIVE PRICES
[XNSA]>> EMERGING AFRICA DAILY MUTUAL FUND PRICES
[VSPBONDETF]>> DAILY INDICATIVE PRICES
[XNSA]>> DAILY FUND PRICE SUBMISSION - FCMB ASSET MANAGEMENT LIMITED
[XNSA]>> NGX FIXED INCOME INDICATIVE PRICE LIST FOR FEB 20, 2025
[XNSA]>> ACTIVATION OF CODE FOR TRADING IN RIGHTS
[XNSA]>> JOINT TRAINING ORGANIZED BY THE CIS ACADEMY AND LAGOS BUSINESS SCHOOL
[LOTUSHAL15]>> DAILY INDICATIVE PRICES
[SIAMLETF40]>> DAILY INDICATIVE PRICES
Chart Of The Day - ASI Chart Vs ASI Advance Decline Line (YTD) (19-Feb-2025 15:07:43.687)
InfoWARE Analyst Daily Market Report (19-Feb-2025 15:07:39.715)
Get IDIA - the stock trading app for the modern investor
Solutions by Business
Product Suites
Company
Contacts
- 8th Floor,
- South Atlantic Petroleum Towers,
- 1 Adeola Odeku Street,
- Victoria Island,
- Lagos, Nigeria.
- Email: solutions@infowarelimited.com
Follow Us
 |
 |
 |
 |