


InfoWARE Analyst Daily Market Report (19-Feb-2025 15:07:39.715) | InfoWARE Finance
Get IDIA - the stock trading app for the modern investor


InfoWARE Analyst Daily Market Report (19-Feb-2025 15:07:39.715)
(Source: InfoWARE Terminal, Date: 19-Feb-2025)
Dear Investor,
Daily Market Summary - February 19, 2025
Today, the Nigerian Stock Exchange (NGX) experienced a modest uptick, with the All Share Index (ASI) rising by 0.87% to close at 107,670.98. Year-to-date, the ASI has returned 5.26%, reflecting a generally positive sentiment in the market despite some volatility. However, trading volume decreased significantly, with a turnover of ?8.25 billion, down 23.07% from the previous day. Market breadth was slightly negative, with 27 advancers and 30 decliners, indicating a mixed performance across sectors.
Significant Trends in Market Breadth:
- Market Breadth: The market breadth stood at 0.90x, suggesting a slight bearish sentiment as more stocks declined than advanced.
- Volume Trends: Trading volume decreased, with 339.98 million shares exchanged today compared to 392.10 million yesterday, indicating reduced investor activity.
- Advancing vs. Declining Stocks: A total of 69 stocks advanced while 70 stocks declined, highlighting a competitive market environment.
Highlights of the Top Gainers and Losers:
Top Gainers:
- LOTUS HALAL EQUITY ETF (LOTUSHAL15): Closed at ?39.97, up 9.99%. The ETF shows strong momentum with an RSI of 54.83, indicating a balanced buying pressure.
- BUA FOODS PLC (BUAFOODS): Closed at ?410.50, up 9.91%. Despite today's gain, the stock has shown volatility with a low RSI of 4.03, suggesting it may be oversold.
- R T BRISCOE PLC (RTBRISCOE): Closed at ?2.63, up 6.91%. The stock's RSI of 44.21 indicates it is approaching neutral territory.
Top Losers:
- VETIVA S & P NIGERIA SOVEREIGN BOND ETF (VSPBONDETF): Closed at ?243.20, down -24.00%. The stock has a high RSI of 55.81, indicating potential overbought conditions prior to the drop.
- UNIVERSITY PRESS PLC (UPL): Closed at ?4.60, down -9.80%. The RSI of 59.75 suggests it may still have room for further declines.
- INTERNATIONAL ENERGY INSURANCE COMPANY PLC (INTENEGINS): Closed at ?2.21, down -9.80%. The stock's RSI of 64.93 indicates it may be nearing overbought territory.
Insights and Predictions:
- Turnover Decrease: The 23.07% drop in market turnover could signal a cautious approach from investors, possibly due to uncertainty in the broader economic environment.
- Advancing and Declining Stocks: The slight edge in decliners suggests that while some sectors are performing well, others are struggling, indicating a selective investment approach.
- Unusual Volume Movements: Stocks like FIDELITY BANK PLC and BUA CEMENT PLC showed unusual trading volumes, suggesting potential interest or news that could impact future performance.
- YTD Trends: Notably, BUA FOODS appears in both the top gainers and the YTD top gainers list, indicating strong investor confidence despite recent volatility.
High Dividend Yield Stocks:
- BUA FOODS PLC has a dividend yield of 1.39%, which, combined with its recent performance, may attract income-focused investors looking for stability amidst market fluctuations.
Suggestions for Traders:
- Opportunities: Consider monitoring LOTUS HALAL EQUITY ETF for potential further gains, as it shows strong bullish momentum.
- Cautions: Be wary of stocks like VETIVA S & P NIGERIA SOVEREIGN BOND ETF, which have shown significant declines and may continue to face selling pressure.
Year-To-Date (YTD) Top Gainers and Losers
| Name | Symbol | Price | %Chg5Dys | %Chg1Dy | %ChgWTD | %ChgMTD | %ChgQTD | %ChgYTD |
|---|---|---|---|---|---|---|---|---|
| WAPIC INSURANCE PLC | WAPIC | 2.7000 | 10.61% | 0.37% | 6.27% | 8.84% | 9.72% | 9.72% |
| BUA FOODS PLC | BUAFOODS | 373.50 | 9.91% | 9.91% | 9.91% | -1.08% | -1.08% | -1.08% |
| NIGERIAN ENAMELWARE PLC | ENAMELWA | 23.20 | 9.43% | 0.00% | 0.00% | 9.43% | 20.21% | 20.21% |
| LOTUS HALAL EQUITY ETF | LOTUSHAL15 | 36.34 | 8.91% | 9.99% | 20.97% | 19.67% | 33.23% | 33.23% |
| SUNU ASSURANCES NIGERIA PLC | SUNUASSUR | 6.52 | 7.96% | 6.14% | 16.30% | 21.40% | -40.60% | -40.60% |
| Name | Symbol | Price | %Chg5Dys | %Chg1Dy | %ChgWTD | %ChgMTD | %ChgQTD | %ChgYTD |
|---|---|---|---|---|---|---|---|---|
| VETIVA S & P NIGERIA SOVEREIGN BOND ETF | VSPBONDETF | 320.00 | -26.30% | -24.00% | -24.00% | -0.33% | -30.51% | -30.51% |
| UNION DICON SALT PLC | UNIONDICON | 7.35 | -16.88% | -9.52% | -18.40% | -11.33% | -7.64% | -7.64% |
| UPDC PLC | UPDC | 3.10 | -16.67% | 1.61% | -7.62% | 65.79% | 82.08% | 82.08% |
| REGENCY ALLIANCE INSURANCE COMPANY PLC | REGALINS | 0.71 | -14.29% | -7.04% | -7.04% | -2.94% | -17.50% | -17.50% |
| ELLah LAKES PLC | ELLahLAKES | 3.31 | -13.90% | -2.72% | -9.55% | 5.23% | 6.98% | 6.98% |
|
Top ASI Gainers Over Last 5 Trading Days
|
Top ASI Losers Over Last 5 Trading Days
|
For more detailed analysis, on InfoWARE Market Data Terminal <NSEPERF> <GO>
On InfoWARE Finance Mobile App (Android, iPhone & iPad, Windows Phone and Windows 8/10), "Top Gainers & Losers"
LOTUS HALAL EQUITY ETF (LOTUSHAL15) topped the advancers list closing at N39.97 with a gain of 9.99% followed by BUA FOODS PLC (BUAFOODS) which closed at N410.50 with a gain of 9.91%.
On the flip side VETIVA S & P NIGERIA SOVEREIGN BOND ETF (VSPBONDETF) and UNIVERSITY PRESS PLC. (UPL) topped the decliners log with a loss of -24.00% at a close of N243.20, and -9.80% to close the day at N4.60 respectively.
| Symbol | LClose | %Chg |
|---|---|---|
| LOTUSHAL15 | 39.97 | 9.99 |
| BUAFOODS | 410.50 | 9.91 |
| RTBRISCOE | 2.63 | 6.91 |
| ETERNA | 42.50 | 6.25 |
| SUNUASSUR | 6.92 | 6.13 |
| Symbol | LClose | %Chg |
|---|---|---|
| VSPBONDETF | 243.20 | -24.00 |
| UPL | 4.60 | -9.80 |
| INTENEGINS | 2.21 | -9.80 |
| UNIONDICON | 6.65 | -9.52 |
| MCNICHOLS | 1.60 | -8.57 |
For more detailed analysis,
- On InfoWARE Market Data Terminal <TOPG> <GO>
- On InfoWARE Finance Mobile App ( Android, iPhone & iPad and Windows 10) , "Top Gainers & Losers"
Currency Market
In the currency market, the Naira appreciated 0.11%(1.65) against the Dollar to settle at 1 to 1NSE: Bull Signal - Price crossed above 15 Day MA
This signal implies these stocks are under buying pressure and the price might continue to rise and therefore positions should be monitored closely. Further suggested analysis include looking at the overall market (ASI) to see if the uptrend is market wide, sector wide or specific to the stock. Portfolio managers tend to use this as a signal to do more research to add to their positions or lock in some profits. Typically further analysis should be done using commands like PC and RV on the InfoWARE Market Data Terminal. Another command is ALERTS to set price triggers for possible exit or entry as necessary
For more detailed analysis,
- On InfoWARE Market Data Terminal <NSEPERF> <GO>
- On InfoWARE Finance Mobile App ( Android , iPhone & iPad and Windows 10) , "Top Gainers & Losers"
| Symbol | Price | %Chg | 15DMA | PE | EPS | DivY | MktCap | Vol | Trades | Value | LstTradeTime |
|---|---|---|---|---|---|---|---|---|---|---|---|
| FGS202663 | 95.00 | 25.26 | 93.13 | 0.00 | 0.00 | 490.00 | 1.00 | 465.50K | 19-Feb-2025 14:30:40.063 | ||
| BUAFOODS | 410.50 | 9.01 | 406.40 | 0.00 | 0.00 | 1.39 | 7,389.00B | 706.31K | 225.00 | 275.21M | 19-Feb-2025 14:30:25.220 |
| VERITASKAP | 1.23 | 5.69 | 1.19 | 48.77 | 0.02 | 4.17 | 17.06B | 6.27M | 86.00 | 7.54M | 19-Feb-2025 14:30:33.210 |
| CILEASING | 3.96 | 5.30 | 3.92 | 6.50 | 0.64 | 1.20 | 3.10B | 913.41K | 26.00 | 3.58M | 19-Feb-2025 14:30:25.567 |
| NGXCNSMRGDS | 1,822.34 | 4.00 | 1,792.25 | 30.19 | 55.24 | 0.00 | 0.00 | 19.76M | 1,439.00 | 779.57M | 19-Feb-2025 14:30:42.487 |
| CORNERST | 3.40 | 1.47 | 3.39 | 8.62 | 0.35 | 5.28 | 61.77B | 1.08M | 41.00 | 3.64M | 19-Feb-2025 14:30:25.643 |
| NGXMAINBOARD | 5,164.90 | 1.45 | 5,135.34 | 12.90 | 225.05 | 0.00 | 0.00 | 233.70M | 8,511.00 | 4.15B | 19-Feb-2025 14:30:42.693 |
| UCAP | 22.90 | 1.31 | 22.81 | 19.15 | 0.93 | 5.03 | 137.40B | 6.80M | 312.00 | 156.24M | 19-Feb-2025 14:30:32.417 |
| FGS202766 | 100.00 | 0.00 | 98.00 | 0.00 | 0.00 | 0.00 | 0.00 | 0.00 | 19-Feb-2025 14:30:40.440 |
NSE: BEAR Signal - Price crossed below 15 Day MA
This signal implies these stocks are under selling pressure and the price might continue to slide and therefore positions should be monitored closely. Further suggested analysis include looking at the overall market (ASI) to see if the downtrend is market wide, sector wide or specific to the stock. If the overal market trend is upwards, then since these stocks are heading in the opposite direction, then further analysis should be done using commands like PC and RV on the InfoWARE Market Data Terminal. Another command is ALERTS to set price triggers for possible exit is necessar
For more detailed analysis,
- On InfoWARE Market Data Terminal <BEARM> <GO>
- On InfoWARE Finance Mobile App ( Android , iPhone & iPad and Windows 10)
| Symbol | Price | %Chg | 15DMA | PE | EPS | DivY | MktCap | Vol | Trades | Value | LstTradeTime |
|---|---|---|---|---|---|---|---|---|---|---|---|
| GTCO | 62.85 | 0.00 | 62.87 | 7.49 | 7.10 | 1.88 | 1,849.75B | 5.24M | 270.00 | 329.88M | 19-Feb-2025 14:30:26.793 |
| NGXAFRBVI | 2,756.81 | -0.36 | 2,766.92 | 3.14 | 35.50 | 0.00 | 0.00 | 104.76M | 2,774.00 | 3.75B | 19-Feb-2025 14:30:42.400 |
| NGXBNK | 1,217.73 | -0.61 | 1,223.44 | 6.10 | 34.65 | 0.00 | 0.00 | 176.76M | 3,409.00 | 4.47B | 19-Feb-2025 14:30:42.443 |
| FBNH | 31.05 | -1.61 | 31.53 | 11.32 | 2.33 | 1.52 | 1,114.55B | 2.69M | 273.00 | 83.75M | 19-Feb-2025 14:31:17.003 |
| ACADEMY | 3.00 | -6.67 | 3.07 | 0.00 | 0.00 | 3.51 | 2.27B | 739.27K | 18.00 | 2.22M | 19-Feb-2025 14:30:19.697 |
| JOHNHOLT | 7.00 | -7.71 | 7.49 | 8.80 | 0.91 | 1.25 | 2.72B | 248.47K | 12.00 | 1.74M | 19-Feb-2025 14:30:27.587 |
| STANBICETF30 | 450.00 | -8.67 | 475.53 | 0.00 | 0.00 | 39.00 | 3.00 | 17.55K | 19-Feb-2025 14:31:16.867 | ||
| MCNICHOLS | 1.60 | -9.38 | 1.71 | 26.80 | 0.05 | 5.88 | 1.15B | 510.68K | 25.00 | 861.53K | 19-Feb-2025 14:31:22.337 |
| INTENEGINS | 2.21 | -10.86 | 2.22 | 0.52 | 2.85 | 3.40 | 2.84B | 1.24M | 23.00 | 2.76M | 19-Feb-2025 14:30:27.287 |
| VSPBONDETF | 243.20 | -31.58 | 281.08 | 0.00 | 0.00 | 2.40K | 6.00 | 594.96K | 19-Feb-2025 14:31:16.920 |
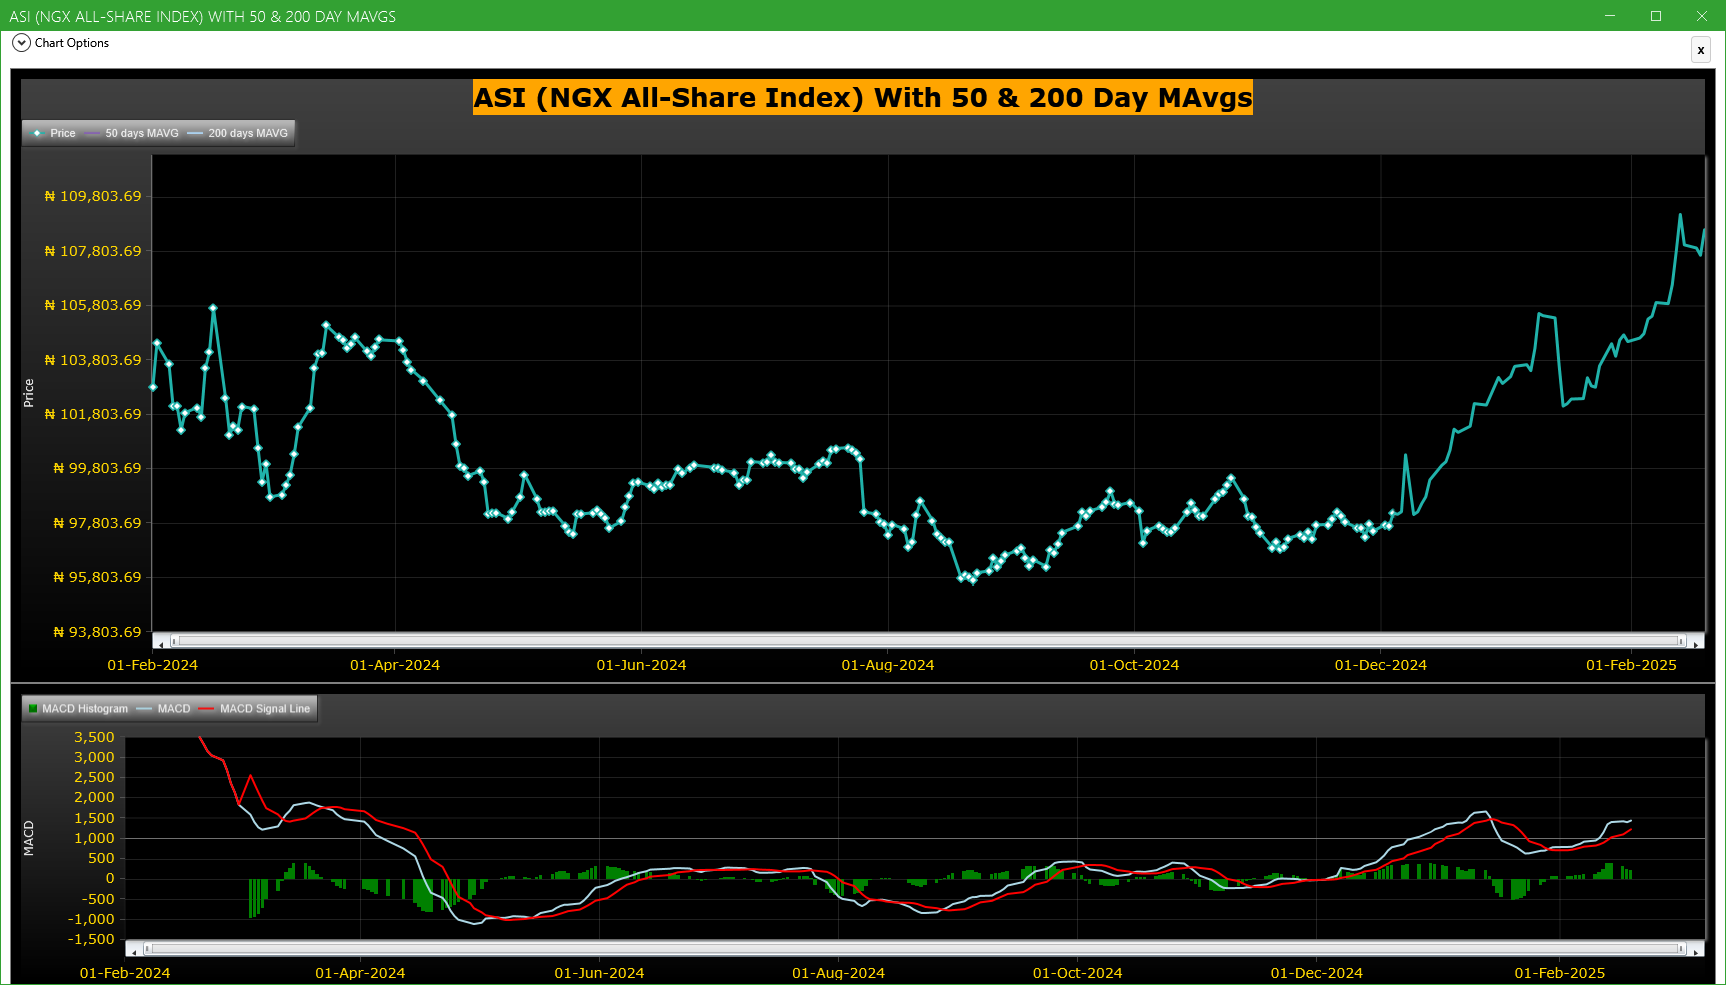
Market Trend - ASI (NGX All-Share-Index) With 50 & 200 Day MAvgs Chart
Technical traders typically use the 50 & 200 day moving averages to aid in choosing
where to enter or exit a position, which then causes these levels to act as strong
support or resistance. As a general guideline, if the price is above a moving average,
the trend is up. If the price is below a moving average, the trend is down.
It is important to note that critics of technical analysis say that moving averages act
as support and resistance because so many traders use these indicators to inform their
trading decisions. Also moving averages tend to work quite well in strong trending conditions
but poorly in choppy or ranging conditions.
Trading Strategies: Crossovers
Crossovers are one of the main moving average strategies. The first type is a price crossover,
which is when the price crosses above or below a moving average to signal a potential change
in trend. Another strategy is to apply two moving averages to a chart: one longer and one
shorter. When the shorter-term MA crosses above the longer-term MA, it is a buy signal, as
it indicates that the trend is shifting up. This is known as a golden cross. Meanwhile, when
the shorter-term MA crosses below the longer-term MA, it is a sell signal, as it indicates that
the trend is shifting down. This is known as a dead/death cross
For more detailed analysis,
- On InfoWARE Market Data Terminal <CI> <GO>
- On InfoWARE Finance Mobile App ( Android , iPhone & iPad and Windows 10) , "Research"
Unusual Volume: Volume traded is more than double the 90 day moving average (All exchanges; ASI & ASem). For more detailed analysis,
- On InfoWARE Market Data Terminal <UV> <GO>
- On InfoWARE Finance Mobile App ( Android , iPhone & iPad and Windows 10)
| Symbol | Name | Volume | 90DAvgVol | %VolChg | Price | LClose | %Chg | Trades | Value |
|---|---|---|---|---|---|---|---|---|---|
| FIDELITYBK | FIDELITY BANK PLC | 50.69M | 17.76M | 185.34 | 19.00 | 19.05 | -0.26 | 497 | 962.54M |
| BUACEMENT | BUA CEMENT PLC | 2.07M | 686.85K | 201.90 | 93.00 | 93.00 | 0.00 | 298 | 174.39M |
| INTENEGINS | INTERNATIONAL ENERGY INSURANCE COMPANY PLC | 1.24M | 468.65K | 165.41 | 2.21 | 2.45 | -9.80 | 23 | 2.76M |
| ACADEMY | ACADEMY PRESS PLC. | 739.27K | 307.24K | 140.61 | 3.00 | 3.20 | -6.25 | 18 | 2.22M |
| UNIONDICON | UNION DICON SALT PLC. | 617.70K | 50.37K | 1,126.28 | 6.65 | 7.35 | -9.52 | 11 | 4.11M |
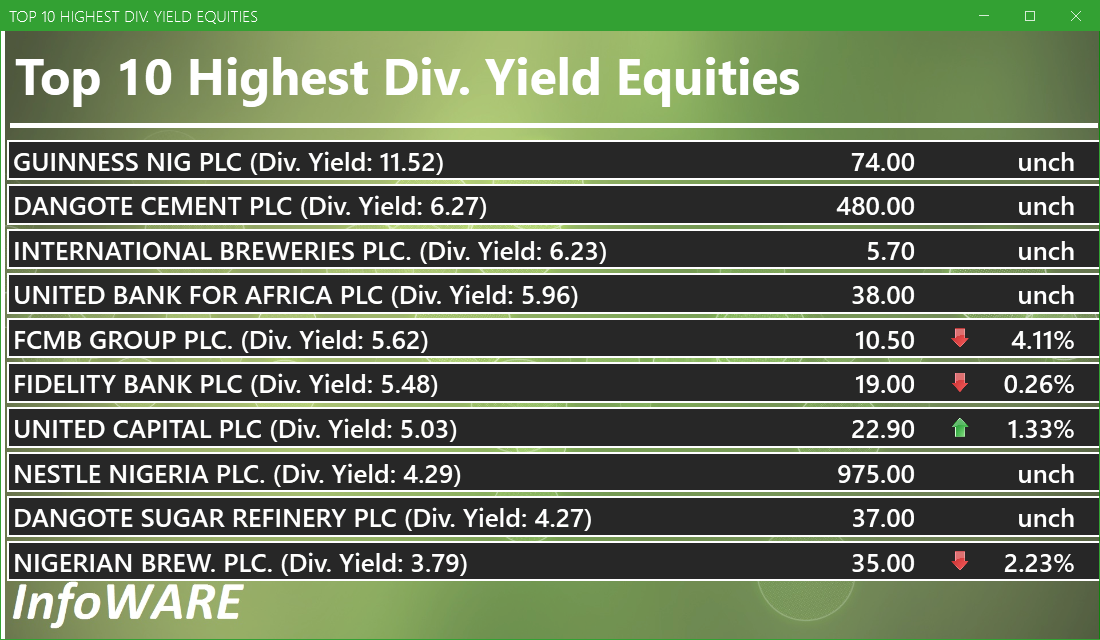
Investment Insights - High Div. Stocks
Dividend stocks distribute a portion of the company earnings to investors on a regular basis and they can a great choice for investors looking for regular income. As an investment or trading strategy, high dividend yield equities provide annual cash payments as against mostly capital gains in the price of a stock. The list in the table below represent the highest dividend paying stocks from the list of the most liquid stocks in the NSE top 30.
For more detailed analysis,
- On InfoWARE Market Data Terminal <HYIELD> <GO>
- On InfoWARE Finance Mobile App ( Android , iPhone & iPad and Windows 10) , "Research"
Investment Insights - Stocks outperforming the ASI but with approximately the same risk
These list of stocks represent equities that are less risky than the ASI but doing better than the ASI (All Shares Index) using the YTD (Year to Date) returns as the measure. The risk is measured by Beta. Beta is an assessment of a stock's tendency to undergo price changes, (its volatility), as well as its potential returns compared to the ASI. It is expressed as a ratio, where a score of 1 represents performance comparable to the ASI, and returns above or below the market may receive scores greater or lower than 1.
For a full list of both positively and negatively corelated stocks visit InfoWARE Market Data Terminal
- On InfoWARE Market Data Terminal <BANL> <GO>
- On InfoWARE Finance Mobile App ( Android , iPhone & iPad and Windows 10)
| Symbol | DivYield | PE | EPS | Beta | %ChgYTD | ASIYTDReturn | BetaDiff |
|---|---|---|---|---|---|---|---|
| HONYFLOUR | 1.40 | 16.28 | 0.31 | 0.99 | 93.64 | 5.26 | 0.01 |
| FIDELITYBK | 5.48 | 13.24 | 1.17 | 0.89 | 11.76 | 5.26 | 0.11 |
| NB | 3.79 | 16.95 | 1.60 | 0.79 | 9.38 | 5.26 | 0.21 |
| WAPIC | 2.56 | 72.55 | 0.02 | 0.76 | 9.72 | 5.26 | 0.24 |
| UNILEVER | 2.81 | 67.09 | 0.40 | 0.75 | 9.58 | 5.26 | 0.25 |
| HMCALL | 0.00 | 0.00 | 0.00 | -0.74 | 20.53 | 5.26 | 0.26 |
| VETGOODS | 0.00 | 0.71 | 9.30 | 5.26 | 0.29 | ||
| VETGRIF30 | 0.00 | 0.71 | 5.96 | 5.26 | 0.29 | ||
| NEM | 6.52 | 24.99 | 0.37 | 0.69 | 8.33 | 5.26 | 0.31 |
| NAHCO | 6.66 | 92.98 | 0.41 | 0.65 | 35.31 | 5.26 | 0.35 |
African Markets
| Name | LClose | Change | %Chg |
|---|---|---|---|
| BRVM Stock Exchange | 285.93 | 1.20 | 0.42 |
| Botswana Stock Exchange | 10,065.46 | 2.01 | 0.02 |
| Egyptian Exchange | 30,587.81 | 152.18 | 0.50 |
| Johannesburg Stock Exchange | 89,061.67 | 662.99 | 0.75 |
| Lusaka Stock Exchange | 15,444.22 | 23.13 | 0.15 |
| Malawi Stock Exchange | 249,442.73 | 2,200.46 | 0.89 |
| Nigeria Stock Exchange | 107,670.98 | -269.85 | -0.25 |
| Nairobi Securities Exchange | 132.73 | 0.82 | 0.62 |
| Namibian Stock Exchange | 1,782.22 | -10.40 | -0.58 |
| Rwanda Stock Exchange | 148.89 | -0.40 | -0.27 |
| Tunis Stock Exchange | 10,387.70 | 48.59 | 0.47 |
| Uganda Securities Exchange | 1,305.03 | 9.33 | 0.72 |
Nigeria Market Indexes
| Symbol | LClose | %Chg | WTD% | MTD% | QTD% | YTD% | MktCap | Trades |
|---|---|---|---|---|---|---|---|---|
| ASI | 108,609.51 | 0.87 | 0.62 | 3.80 | 5.26 | 5.26 | 12,374 | |
| NGX30 | 4,038.23 | 0.93 | 0.69 | 4.01 | 5.86 | 5.86 | 6,991 | |
| NGXAFRBVI | 2,756.81 | -0.36 | -1.25 | 2.59 | 11.13 | 11.13 | 2,774 | |
| NGXAFRHDYI | 18,004.26 | 0.06 | -0.24 | 1.28 | 5.74 | 5.74 | 2,269 | |
| NGXASEM | 1,585.47 | 0.00 | 0.00 | 0.11 | 0.11 | 0.11 | 3 | |
| NGXBNK | 1,217.73 | -0.61 | -1.62 | 2.71 | 11.98 | 11.98 | 3,409 | |
| NGXCG | 3,130.40 | -0.35 | -1.14 | 3.19 | 10.64 | 10.64 | 6,941 | |
| NGXCNSMRGDS | 1,822.34 | 4.16 | 3.76 | 1.35 | 5.07 | 5.07 | 1,439 | |
| NGXGROWTH | 7,865.28 | -0.20 | -0.65 | -4.96 | 1.32 | 1.32 | 103 | |
| NGXINDUSTR | 3,634.61 | 0.00 | -0.18 | 11.35 | 1.76 | 1.76 | 883 | |
| NGXINS | 748.46 | 0.29 | 2.93 | 4.84 | -4.80 | -4.80 | 883 | |
| NGXLOTUSISLM | 7,699.01 | 1.14 | 1.11 | 4.77 | 10.49 | 10.49 | 2,038 | |
| NGXMAINBOARD | 5,164.90 | 1.47 | 1.33 | 1.20 | 3.22 | 3.22 | 8,511 | |
| NGXMERIGRW | 7,429.94 | -0.75 | -1.31 | 0.29 | 13.90 | 13.90 | 1,471 | |
| NGXMERIVAL | 11,269.07 | -0.47 | -1.41 | 2.72 | 8.04 | 8.04 | 3,862 | |
| NGXOILGAS | 2,587.98 | 0.03 | -0.21 | -3.03 | -4.54 | -4.54 | 411 | |
| NGXPENBRD | 1,937.06 | 0.95 | 0.71 | 4.19 | 5.76 | 5.76 | 10,002 | |
| NGXPENSION | 4,927.05 | -0.08 | -0.61 | 2.85 | 8.67 | 8.67 | 7,612 | |
| NGXPREMIUM | 10,619.75 | -0.18 | -0.62 | 8.87 | 9.11 | 9.11 | 3,760 | |
| NGXSOVBND | 620.40 | 0.00 | 0.00 | 0.00 | 3.14 | 3.14 | 0 |
For more detailed analysis,
- On InfoWARE Market Data Terminal <MKTINS> <GO>
- On InfoWARE Finance Mobile App ( Android, iPhone & iPad and Windows 10) , "Market Indexes"
Find the topic interesting? Will like to comment? Contact Us at solutions@infowarelimited.com
Top News

InfoWARE AI Analyst Daily Market Report: 21-Feb-2025
Chart Of The Day - ASI Chart Vs ASI Advance Decline Line (YTD) (21-Feb-2025 15:08:30.153)
InfoWARE Analyst Daily Market Report (21-Feb-2025 15:08:26.067)

[XNSA]>> CORDROS MILESTONE FUNDS' BID & OFFER PRICES
[XNSA]>> NGX FIXED INCOME INDICATIVE PRICE LIST FOR FEB 21, 2025
[VETINDETF]>> DAILY INDICATIV PRICES
[LOTUSHAL15]>> DAILY INDICATIV PRICES
[XNSA]>> EMERGING AFRICA DAILY MUTUAL FUND PRICES
[XNSA]>> DAILY FUND PRICE SUBMISSION - FCMB ASSET MANAGEMENT LIMITED
[XNSA]>> ACTIVATION OF CODE FOR TRADING IN RIGHTS
[XNSA]>> JOINT TRAINING ORGANIZED BY THE CIS ACADEMY AND LAGOS BUSINESS SCHOOL
Chart Of The Day - ASI Chart Vs ASI Advance Decline Line (YTD) (20-Feb-2025 15:08:47.387)
InfoWARE Analyst Daily Market Report (20-Feb-2025 15:08:43.384)
[XNSA]>> CORDROS MILESTONE FUNDS' BID & OFFER PRICES

Media Highlights 20-02-2025

Daily Business News Brief
[HONYFLOUR]>>Corporate Disclosures-<HONEYWELL FLOUR MILL PLC>
NIGERIAN TREASURY BILL AUCTION RESULT FOR 19TH FEBRUARY, 2025
CSL Nigeria Daily - 20 February 2025
[MERGROWTH]>> DAILY INDICATIVE PRICES
[XNSA]>> EMERGING AFRICA DAILY MUTUAL FUND PRICES
[VSPBONDETF]>> DAILY INDICATIVE PRICES
[XNSA]>> DAILY FUND PRICE SUBMISSION - FCMB ASSET MANAGEMENT LIMITED
[XNSA]>> NGX FIXED INCOME INDICATIVE PRICE LIST FOR FEB 20, 2025
[XNSA]>> ACTIVATION OF CODE FOR TRADING IN RIGHTS
[XNSA]>> JOINT TRAINING ORGANIZED BY THE CIS ACADEMY AND LAGOS BUSINESS SCHOOL
[LOTUSHAL15]>> DAILY INDICATIVE PRICES
[SIAMLETF40]>> DAILY INDICATIVE PRICES
Chart Of The Day - ASI Chart Vs ASI Advance Decline Line (YTD) (19-Feb-2025 15:07:43.687)
InfoWARE Analyst Daily Market Report (19-Feb-2025 15:07:39.715)
Get IDIA - the stock trading app for the modern investor
Solutions by Business
Product Suites
Company
Contacts
- 8th Floor,
- South Atlantic Petroleum Towers,
- 1 Adeola Odeku Street,
- Victoria Island,
- Lagos, Nigeria.
- Email: solutions@infowarelimited.com
Follow Us
 |
 |
 |
 |