


InfoWARE Analyst Daily Market Report (27-Feb-2025 15:08:45.379) | InfoWARE Finance
Get IDIA - the stock trading app for the modern investor


InfoWARE Analyst Daily Market Report (27-Feb-2025 15:08:45.379)
(Source: InfoWARE Terminal, Date: 27-Feb-2025)
Dear Investor,
Daily Market Summary - February 27, 2025
Today, the Nigerian Stock Exchange (NGX) experienced a slight dip, with the All Share Index (ASI) closing down by -0.11% at 107,798.99. Despite this minor setback, the market has shown a positive Year-To-Date (YTD) return of 4.36%. Trading volume surged to 417.76 million, reflecting a 16.44% increase in market turnover, which reached 8.72 billion Naira. Market breadth remained favorable with 34 advancers outpacing 25 decliners, indicating a generally positive sentiment among investors.
Significant Trends in Market Breadth:
- Market Breadth: Advancers outnumbered decliners at a ratio of 1.36x.
- Volume Trends: 74 stocks saw increased trading volumes, while 62 stocks experienced declines in volume.
Highlights of the Top Gainers and Losers:
Top Gainers:
- NEWGOLD EXCHANGE TRADED FUND (ETF) (NEWGOLD): Closed at 47,998.00, up 20.00%. This ETF continues to attract investor interest, likely due to its performance in the gold market.
- P Z CUSSONS NIGERIA PLC (PZ): Closed at 32.45, up 10.00%. The stock's RSI at 71.47 indicates it is nearing overbought territory, suggesting potential caution for new buyers.
- HONEYWELL FLOUR MILL PLC (HONYFLOUR): Closed at 13.03, up 9.96%. The stock's recent momentum could be driven by favorable market conditions in the food sector.
Top Losers:
- OANDO PLC (OANDO): Closed at 52.80, down 10.00%. The stock's RSI of 18.36 indicates it is in oversold territory, which may present a buying opportunity for contrarian investors.
- FIDSON HEALTHCARE PLC (FIDSON): Closed at 17.90, down 9.60%. Despite the decline, the stock maintains a relatively strong EPS of 0.64.
- ECOBANK TRANSNATIONAL INCORPORATED (ETI): Closed at 31.40, down 9.51%. The stock's RSI of 99.91 suggests it may be due for a correction.
Insights and Predictions:
- Turnover Decrease Implications: The increase in turnover suggests heightened trading activity, which could indicate investor confidence despite the slight dip in the ASI.
- Advancing vs. Declining Stocks: The positive breadth indicates that while the index is down, many individual stocks are performing well, suggesting selective strength in the market.
- Unusual Volume Movements: Stocks like FCMB GROUP PLC and CAVERTON OFFSHORE SUPPORT GRP PLC saw significant volume spikes, indicating potential interest from institutional investors.
- YTD Trends: The top gainers for the year, such as P Z CUSSONS and NEWGOLD, continue to show strong momentum, while the losers like LOTUS HALAL EQUITY ETF are experiencing significant declines, suggesting a potential shift in investor sentiment.
- Bullish Momentum Stocks: Stocks like NEWGOLD and HONYFLOUR are showing bullish momentum with RSI values above 70 and positive MACD crossovers.
- Bearish Momentum Stocks: Stocks like OANDO and FIDSON are in bearish territory with RSI values below 30, indicating potential further declines.
High Dividend Yield Stocks:
- HONYFLOUR has a dividend yield of 103.33%, making it an attractive option for income-focused investors, especially given its recent bullish momentum.
Suggestions for Traders:
- Opportunities: Consider accumulating positions in stocks like NEWGOLD and P Z CUSSONS that are showing strong momentum.
- Cautions: Monitor stocks like OANDO and FIDSON closely, as they may present buying opportunities if they stabilize after recent declines.
Year-To-Date (YTD) Gainers and Losers (as of February 27, 2025)
| Top Gainers | Symbol | Price | %ChgYTD |
|---|---|---|---|
| ASSOCIATED BUS COMPANY PLC | ABCTRANS | 1.33 | 15.45% |
| CAVERTON OFFSHORE SUPPORT GRP PLC | CAVERTON | 2.45 | 5.49% |
| P Z CUSSONS NIGERIA PLC | PZ | 29.50 | 33.54% |
| NEWGOLD EXCHANGE TRADED FUND (ETF) | NEWGOLD | 40,000.00 | 64.93% |
| Top Losers | Symbol | Price | %ChgYTD |
|---|---|---|---|
| LOTUS HALAL EQUITY ETF | LOTUSHAL15 | 39.00 | -26.67% |
| GUINEA INSURANCE PLC | GUINEAINS | 0.72 | -25.84% |
| DAAR COMMUNICATIONS PLC | DAARCOMM | 0.63 | -7.35% |
Market Activity Summary
- Retail vs. Institutional Trade Count: Retail investors accounted for 85.96% of trade counts, while institutional investors dominated in volume at 70.61%.
- Top Traded Symbols:
- Institutional: WAPCO, ZENITHBANK, ACCESSCORP
- Retail: ZENITHBANK, AFRIPRUD, ACCESSCORP
- Insights: The disparity in trading volume suggests institutional investors are focusing on larger positions, while retail investors are more active in smaller trades. This could indicate a potential divergence in market sentiment.
|
Top ASI Gainers Over Last 5 Trading Days
|
Top ASI Losers Over Last 5 Trading Days
|
For more detailed analysis, on InfoWARE Market Data Terminal <NSEPERF> <GO>
On InfoWARE Finance Mobile App (Android, iPhone & iPad, Windows Phone and Windows 8/10), "Top Gainers & Losers"
NEWGOLD EXCHANGE TRADED FUND (ETF) (NEWGOLD) topped the advancers list closing at N47,998.00 with a gain of 20.00% followed by OANDO PLC (OANDO) which closed at N52.80 with a gain of 10.00%.
On the flip side THE SIAML PENSION ETF 40 (SIAMLETF40) and LOTUS HALAL EQUITY ETF (LOTUSHAL15) topped the decliners log with a loss of -10.00% at a close of N495.00, and -9.74% to close the day at N35.20 respectively.
| Symbol | LClose | %Chg |
|---|---|---|
| NEWGOLD | 47,998.00 | 20.00 |
| OANDO | 52.80 | 10.00 |
| PZ | 32.45 | 10.00 |
| GREENWETF | 528.65 | 10.00 |
| HONYFLOUR | 13.03 | 9.96 |
| Symbol | LClose | %Chg |
|---|---|---|
| SIAMLETF40 | 495.00 | -10.00 |
| LOTUSHAL15 | 35.20 | -9.74 |
| FIDSON | 17.90 | -9.60 |
| ETI | 31.40 | -9.51 |
| GUINEAINS | 0.66 | -8.33 |
For more detailed analysis,
- On InfoWARE Market Data Terminal <TOPG> <GO>
- On InfoWARE Finance Mobile App ( Android, iPhone & iPad and Windows 10) , "Top Gainers & Losers"
Currency Market
In the currency market, the Naira fell 0.04%(-0.62) against the Dollar to settle at 1 to 1NSE: Bull Signal - Price crossed above 15 Day MA
This signal implies these stocks are under buying pressure and the price might continue to rise and therefore positions should be monitored closely. Further suggested analysis include looking at the overall market (ASI) to see if the uptrend is market wide, sector wide or specific to the stock. Portfolio managers tend to use this as a signal to do more research to add to their positions or lock in some profits. Typically further analysis should be done using commands like PC and RV on the InfoWARE Market Data Terminal. Another command is ALERTS to set price triggers for possible exit or entry as necessary
For more detailed analysis,
- On InfoWARE Market Data Terminal <NSEPERF> <GO>
- On InfoWARE Finance Mobile App ( Android , iPhone & iPad and Windows 10) , "Top Gainers & Losers"
| Symbol | Price | %Chg | 15DMA | PE | EPS | DivY | MktCap | Vol | Trades | Value | LstTradeTime |
|---|---|---|---|---|---|---|---|---|---|---|---|
| NEWGOLD | 47,998.00 | 16.66 | 42,632.93 | 0.00 | 0.00 | 0.00 | 0.00 | 11.00 | 3.00 | 486.34K | 27-Feb-2025 14:31:26.030 |
| GREENWETF | 528.65 | 9.09 | 523.75 | 0.00 | 0.00 | 12.00 | 2.00 | 6.34K | 27-Feb-2025 14:31:25.960 | ||
| HONYFLOUR | 13.03 | 9.06 | 12.46 | 16.28 | 0.31 | 1.40 | 103.33B | 7.85M | 260.00 | 101.63M | 27-Feb-2025 14:30:41.807 |
| FGSUK2033S6 | 99.00 | 7.06 | 96.94 | 0.00 | 0.00 | 80.15K | 3.00 | 74.14M | 27-Feb-2025 14:30:51.563 | ||
| NASCON | 45.00 | 6.67 | 42.55 | 24.28 | 1.33 | 3.09 | 119.22B | 4.86M | 157.00 | 209.87M | 27-Feb-2025 14:30:43.300 |
| FTNCOCOA | 1.78 | 5.06 | 1.76 | 0.00 | 0.00 | 1.60 | 6.94B | 3.22M | 59.00 | 5.51M | 27-Feb-2025 14:31:25.303 |
| MERGROWTH | 400.00 | 3.50 | 387.73 | 0.00 | 0.00 | 100.00 | 2.00 | 38.80K | 27-Feb-2025 14:31:26.000 |
NSE: BEAR Signal - Price crossed below 15 Day MA
This signal implies these stocks are under selling pressure and the price might continue to slide and therefore positions should be monitored closely. Further suggested analysis include looking at the overall market (ASI) to see if the downtrend is market wide, sector wide or specific to the stock. If the overal market trend is upwards, then since these stocks are heading in the opposite direction, then further analysis should be done using commands like PC and RV on the InfoWARE Market Data Terminal. Another command is ALERTS to set price triggers for possible exit is necessar
For more detailed analysis,
- On InfoWARE Market Data Terminal <BEARM> <GO>
- On InfoWARE Finance Mobile App ( Android , iPhone & iPad and Windows 10)
| Symbol | Price | %Chg | 15DMA | PE | EPS | DivY | MktCap | Vol | Trades | Value | LstTradeTime |
|---|---|---|---|---|---|---|---|---|---|---|---|
| ETERNA | 42.00 | 0.00 | 42.08 | 29.51 | 0.75 | 0.68 | 54.77B | 679.94K | 95.00 | 28.62M | 27-Feb-2025 14:30:41.043 |
| FGS202758 | 70.00 | 0.00 | 72.00 | 0.00 | 0.00 | 0.00 | 0.00 | 0.00 | 27-Feb-2025 14:30:51.147 | ||
| ASI | 107,675.46 | -0.11 | 107,740.99 | 11.84 | 457.69 | 0.00 | 0.00 | 417.76M | 10,566.00 | 8.72B | 27-Feb-2025 14:30:52.413 |
| WAPCO | 75.00 | -3.33 | 76.85 | 24.60 | 2.87 | 2.70 | 1,208.08B | 11.30M | 357.00 | 831.59M | 27-Feb-2025 14:31:26.620 |
| INTBREW | 5.45 | -4.59 | 5.62 | 0.00 | 0.00 | 6.23 | 146.40B | 1.05M | 23.00 | 5.68M | 27-Feb-2025 14:30:42.167 |
| WAPIC | 2.57 | -5.06 | 2.60 | 72.55 | 0.02 | 2.56 | 61.66B | 386.54K | 30.00 | 1.00M | 27-Feb-2025 14:30:45.627 |
| ETI | 31.40 | -10.51 | 33.61 | 5.00 | 5.10 | 2.00 | 576.18B | 220.10K | 26.00 | 6.89M | 27-Feb-2025 14:30:41.060 |
| FIDSON | 17.90 | -10.61 | 19.67 | 22.54 | 0.64 | 4.14 | 41.08B | 264.85K | 58.00 | 4.80M | 27-Feb-2025 14:30:41.280 |
| LOTUSHAL15 | 35.20 | -10.80 | 37.76 | 0.00 | 0.00 | 145.00 | 4.00 | 5.41K | 27-Feb-2025 14:31:25.977 |
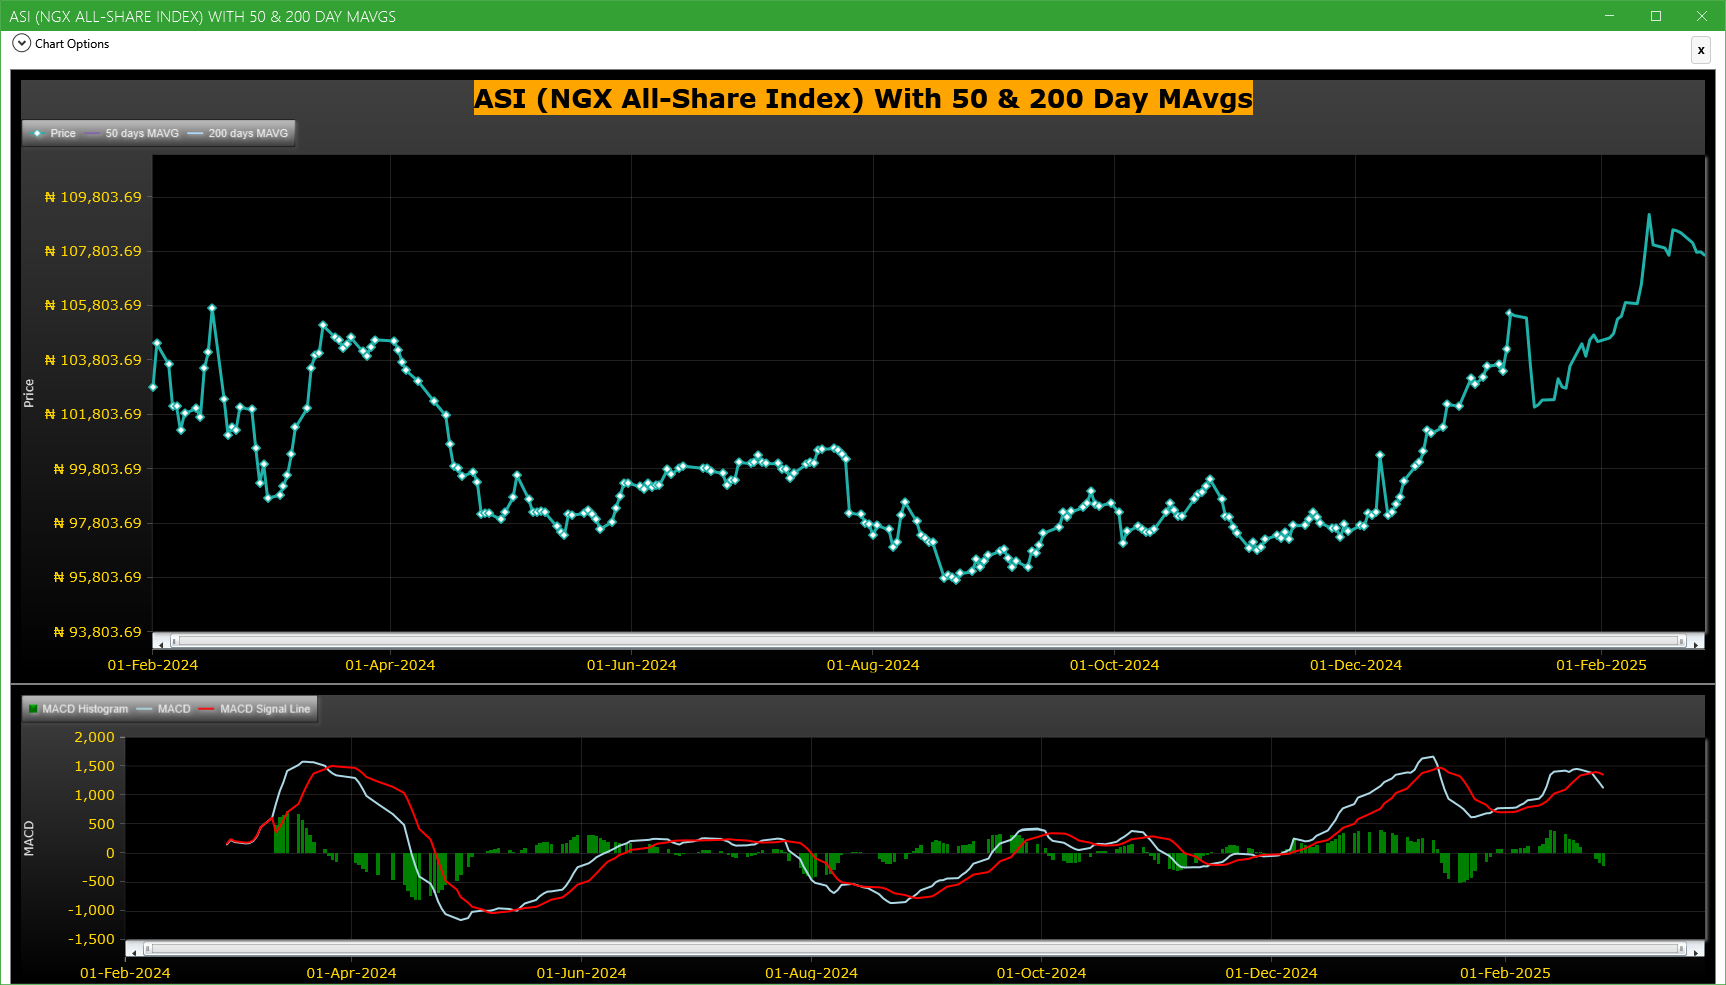
Market Trend - ASI (NGX All-Share-Index) With 50 & 200 Day MAvgs Chart
Technical traders typically use the 50 & 200 day moving averages to aid in choosing
where to enter or exit a position, which then causes these levels to act as strong
support or resistance. As a general guideline, if the price is above a moving average,
the trend is up. If the price is below a moving average, the trend is down.
It is important to note that critics of technical analysis say that moving averages act
as support and resistance because so many traders use these indicators to inform their
trading decisions. Also moving averages tend to work quite well in strong trending conditions
but poorly in choppy or ranging conditions.
Trading Strategies: Crossovers
Crossovers are one of the main moving average strategies. The first type is a price crossover,
which is when the price crosses above or below a moving average to signal a potential change
in trend. Another strategy is to apply two moving averages to a chart: one longer and one
shorter. When the shorter-term MA crosses above the longer-term MA, it is a buy signal, as
it indicates that the trend is shifting up. This is known as a golden cross. Meanwhile, when
the shorter-term MA crosses below the longer-term MA, it is a sell signal, as it indicates that
the trend is shifting down. This is known as a dead/death cross
For more detailed analysis,
- On InfoWARE Market Data Terminal <CI> <GO>
- On InfoWARE Finance Mobile App ( Android , iPhone & iPad and Windows 10) , "Research"
Unusual Volume: Volume traded is more than double the 90 day moving average (All exchanges; ASI & ASem). For more detailed analysis,
- On InfoWARE Market Data Terminal <UV> <GO>
- On InfoWARE Finance Mobile App ( Android , iPhone & iPad and Windows 10)
| Symbol | Name | Volume | 90DAvgVol | %VolChg | Price | LClose | %Chg | Trades | Value |
|---|---|---|---|---|---|---|---|---|---|
| FCMB | FCMB GROUP PLC. | 102.27M | 11.34M | 801.75 | 10.50 | 10.50 | 0.00 | 197 | 1.06B |
| JAIZBANK | JAIZ BANK PLC | 24.40M | 11.20M | 117.80 | 3.38 | 3.38 | 0.00 | 164 | 82.02M |
| CAVERTON | CAVERTON OFFSHORE SUPPORT GRP PLC | 20.92M | 2.21M | 845.62 | 2.69 | 2.45 | 9.80 | 210 | 54.60M |
| WAPCO | LAFARGE WAPCO PLC. | 11.30M | 5.35M | 111.34 | 75.00 | 77.50 | -3.23 | 357 | 831.59M |
| AFRIPRUD | AFRICA PRUDENTIAL REGISTRARS PLC | 11.26M | 3.06M | 267.48 | 33.80 | 33.30 | 1.50 | 582 | 382.79M |
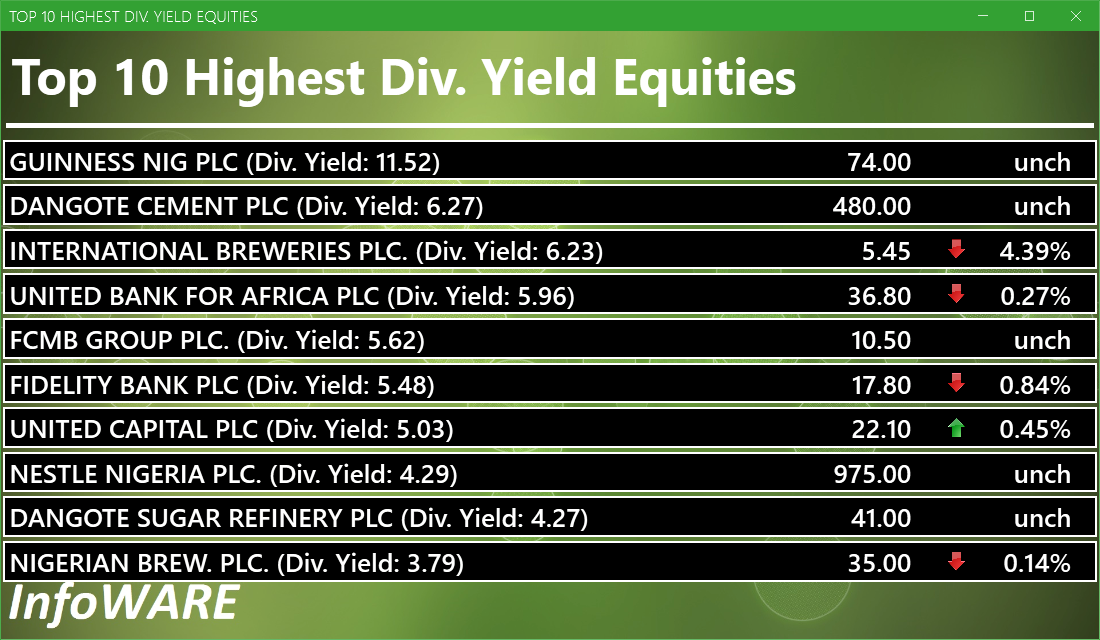
Investment Insights - High Div. Stocks
Dividend stocks distribute a portion of the company earnings to investors on a regular basis and they can a great choice for investors looking for regular income. As an investment or trading strategy, high dividend yield equities provide annual cash payments as against mostly capital gains in the price of a stock. The list in the table below represent the highest dividend paying stocks from the list of the most liquid stocks in the NSE top 30.
For more detailed analysis,
- On InfoWARE Market Data Terminal <HYIELD> <GO>
- On InfoWARE Finance Mobile App ( Android , iPhone & iPad and Windows 10) , "Research"
African Markets
| Name | LClose | Change | %Chg |
|---|---|---|---|
| BRVM Stock Exchange | 290.47 | 0.87 | 0.30 |
| Botswana Stock Exchange | 10,103.25 | 0.00 | 0.00 |
| Egyptian Exchange | 30,631.95 | -21.46 | -0.07 |
| Ghana Stock Exchange | 5,622.92 | 0.00 | 0.00 |
| Johannesburg Stock Exchange | 88,321.76 | 570.38 | 0.65 |
| Lusaka Stock Exchange | 15,415.41 | -4.63 | -0.03 |
| Casablanca Stock Exchange | 17,086.65 | 149.05 | 0.88 |
| Malawi Stock Exchange | 274,555.15 | 1,664.63 | 0.61 |
| Nigeria Stock Exchange | 107,798.99 | 21.56 | 0.02 |
| Nairobi Securities Exchange | 132.64 | -0.63 | -0.47 |
| Namibian Stock Exchange | 1,792.38 | 24.40 | 1.38 |
| Rwanda Stock Exchange | 148.89 | 0.00 | 0.00 |
| Tunis Stock Exchange | 10,613.60 | 82.15 | 0.78 |
| Uganda Securities Exchange | 1,312.11 | 7.83 | 0.60 |
Nigeria Market Indexes
| Symbol | LClose | %Chg | WTD% | MTD% | QTD% | YTD% | MktCap | Trades |
|---|---|---|---|---|---|---|---|---|
| ASI | 107,675.46 | -0.11 | -0.42 | 2.91 | 4.36 | 4.36 | 10,566 | |
| NGX30 | 4,002.05 | -0.16 | -0.45 | 3.07 | 4.91 | 4.91 | 5,553 | |
| NGXAFRBVI | 2,641.36 | -0.05 | -1.23 | -1.70 | 6.47 | 6.47 | 1,966 | |
| NGXAFRHDYI | 17,555.86 | 0.05 | -0.47 | -1.24 | 3.10 | 3.10 | 2,087 | |
| NGXASEM | 1,586.57 | 0.00 | 0.04 | 0.18 | 0.18 | 0.18 | 13 | |
| NGXBNK | 1,167.56 | -0.75 | -1.51 | -1.52 | 7.37 | 7.37 | 2,540 | |
| NGXCG | 3,048.77 | -0.14 | -0.49 | 0.50 | 7.76 | 7.76 | 6,027 | |
| NGXCNSMRGDS | 1,847.35 | -0.17 | 0.20 | 2.74 | 6.51 | 6.51 | 1,381 | |
| NGXGROWTH | 7,856.12 | 0.11 | -0.11 | -5.07 | 1.20 | 1.20 | 42 | |
| NGXINDUSTR | 3,619.91 | -0.43 | -0.44 | 10.90 | 1.35 | 1.35 | 763 | |
| NGXINS | 717.22 | -0.92 | -3.61 | 0.46 | -8.77 | -8.77 | 804 | |
| NGXLOTUSISLM | 7,691.78 | -0.05 | -0.21 | 4.67 | 10.39 | 10.39 | 1,475 | |
| NGXMAINBOARD | 5,134.04 | -0.06 | -0.53 | 0.59 | 2.60 | 2.60 | 7,801 | |
| NGXMERIGRW | 7,280.88 | 0.08 | -0.52 | -1.72 | 11.61 | 11.61 | 1,598 | |
| NGXMERIVAL | 10,876.44 | -0.20 | -0.62 | -0.86 | 4.28 | 4.28 | 2,993 | |
| NGXOILGAS | 2,517.87 | 0.88 | -0.85 | -5.66 | -7.13 | -7.13 | 276 | |
| NGXPENBRD | 1,924.09 | -0.15 | -0.29 | 3.49 | 5.05 | 5.05 | 8,906 | |
| NGXPENSION | 4,824.20 | -0.49 | -0.86 | 0.70 | 6.40 | 6.40 | 6,678 | |
| NGXPREMIUM | 10,478.11 | -0.21 | -0.21 | 7.42 | 7.66 | 7.66 | 2,723 | |
| NGXSOVBND | 626.76 | 0.59 | 0.59 | 1.03 | 4.19 | 4.19 | 0 |
For more detailed analysis,
- On InfoWARE Market Data Terminal <MKTINS> <GO>
- On InfoWARE Finance Mobile App ( Android, iPhone & iPad and Windows 10) , "Market Indexes"
Find the topic interesting? Will like to comment? Contact Us at solutions@infowarelimited.com
Top News

InfoWARE AI Analyst Daily Market Report: 28-Feb-2025
Chart Of The Day - ASI Chart Vs ASI Advance Decline Line (YTD) (28-Feb-2025 15:08:04.045)
InfoWARE AI Analyst Weekly Market Report: 28-Feb-2025

[XNSA]>> CORDROS MILESTONE FUNDS' BID & OFFER PRICES
[TOTAL]>>Corporate Disclosures-<TotalEnergies Marketing Nigeria Plc>
[XNSA]>> NORRENBERGER MUTUAL FUNDS WEEKLY UPDATE TO NGX
[MERVALUE]>> DAILY INDICATIVE PRICES
[XNSA]>> APPOINTMENT OF A DIRECTOR (EL-ELYON ALLIANCE AND SECURITIES LIMITED)
[XNSA]>> NGX FIXED INCOME INDICATIVE PRICE LIST FOR FEB 28, 2025
[VETBANK]>> DAILY INDICATIVE PRICES
[XNSA]>> JOINT TRAINING ORGANIZED BY THE CIS ACADEMY AND LAGOS BUSINESS SCHOOL
[XNSA]>> NGX GROUP'S INTERNATIONAL WOMEN'S DAY CELEBRATION
[WAPCO]>>Corporate Disclosures-<LAFARGE AFRICA PLC.>
[XNSA]>> APPOINTMENT OF A DIRECTOR (NOVAMBL SECURITIES LIMITED)
[XNSA]>> DEMISE OF A DIRECTOR (GTI SECURITIES LIMITED)
[STANBICETF30]>> DAILY INDICATIVE PRICES
[XNSA]>> DAILY FUND PRICE SUBMISSION - FCMB ASSET MANAGEMENT LIMITED
Chart Of The Day - ASI Chart Vs ASI Advance Decline Line (YTD) (27-Feb-2025 15:08:49.419)
InfoWARE Analyst Daily Market Report (27-Feb-2025 15:08:45.379)
[XNSA]>> CORDROS MILESTONE FUNDS' BID & OFFER PRICES
[MERGROWTH]>> DAILY INDICATIVE PRICES
[NESTLE]>>Corporate Disclosures-<NESTLE NIGERIA PLC.>
[VETBANK]>> DAILY INDICATIVE PRICES
[LOTUSHAL15]>> DAILY INDICATIVE PRICES
[XNSA]>> NGX FIXED INCOME INDICATIVE PRICE LIST FOR FEB 27, 2025
[WAPCO]>>Corporate Disclosures-<LAFARGE AFRICA PLC.>
[XNSA]>> JOINT TRAINING ORGANIZED BY THE CIS ACADEMY AND LAGOS BUSINESS SCHOOL
[XNSA]>> NGX GROUP'S INTERNATIONAL WOMEN'S DAY CELEBRATION
[SIAMLETF40]>> DAILY INDICATIVE PRICES
[XNSA]>> CHANGE OF COMPANY NAME (FBNQUEST SECURITIES LIMITED)
Get IDIA - the stock trading app for the modern investor
Solutions by Business
Product Suites
Company
Contacts
- 8th Floor,
- South Atlantic Petroleum Towers,
- 1 Adeola Odeku Street,
- Victoria Island,
- Lagos, Nigeria.
- Email: solutions@infowarelimited.com
Follow Us
 |
 |
 |
 |