


InfoWARE AI Analyst Daily Market Report: 02-May-2025 | InfoWARE Finance
Get IDIA - the stock trading app for the modern investor


InfoWARE AI Analyst Daily Market Report: 02-May-2025
(Source: InfoWARE Terminal, Date: 02-May-2025)
Dear Investor,
Daily Market Summary – Friday, May 2, 2025
Market sentiment displayed resilience today as the NGX All Share Index (ASI) closed up 0.23% at 105,800.85, building year-to-date gains to 2.77%. Turnover surged 11.44% to reach NGN13.29B with volume jumping to 549.71M (from yesterday’s 373.79M), signaling renewed activity—particularly on select equities. Advancers (30) lagged decliners (41), resulting in a market breadth of 0.73x, and trigger-happy trading was evident especially among momentum and high-volume stocks (notably, multiple with fresh technical signals). Sharp rotation persists with top gainers (CADBURY, NAHCO, TIP, etc.) and losers (DAARCOMM, SIAMLETF40, MULTIVERSE, etc.) showing extremes not just in price but in technical momentum indicators.
- Market Breadth & Volume:
- Market breadth at 0.73x: Decliners > Advancers (41 down, 30 up). Despite the ASI’s green close, participation was skewed to the downside—rotation and profit-taking dominate.
- 82 stocks posted higher volume; 59 saw lower volume—a sign of rising selectivity among investors and larger block trades possibly driven by institutions.
- Top Intraday Gainers:
-
CADBURY NIGERIA PLC (CADBURY): +10.00% (₦31.90)
- RSI cooled from 82.7 to 64.9 (waning overbought, still strong momentum); MACD well above signal line—uptrend strength persists but initial topping signals may be emerging.
-
NIGERIAN AVIATION HANDLING COMPANY PLC (NAHCO): +10.00% (₦82.50)
- RSI: 78.15 (deeply overbought); MACD shows strong momentum, 125D rate at +92.8%. Uptrend extended—caution for late buyers!
-
BETA GLASS CO PLC (BETAGLAS): +9.96% (₦109.80)
- RSI: 81.38 (overbought), MACD positive; stand-out technical consistency with strong YTD (+69.18%).
-
CAVERTON OFFSHORE SUPPORT (CAVERTON): +9.92% (₦2.66)
- MACD near signal; watch closely for possible reversal after a strong spurt.
-
CADBURY NIGERIA PLC (CADBURY): +10.00% (₦31.90)
- Top Intraday Losers:
- DAAR COMMUNICATIONS (DAARCOMM): -10.00% (₦0.54)
- THE SIAML PENSION ETF 40 (SIAMLETF40): -10.00% (₦270.00) — fifth consecutive week of slide; heavy QTD and YTD losses (-66.25% YTD).
- MULTIVERSE PLC: -9.93% (₦6.35) — RSI now at a low of 8.91 (deeply oversold), combined with a multi-week losing streak. Contrarian alert!
- ETERNA PLC: -9.91% (₦45.00) — RSI overbought (84.13), indicating possible sharp reversal.
Key Insights & Trading Predictions
- Turnover Increase: 11.44% rise in turnover (to ₦13.29B) + 47% surge in volume typically signals strong institutional activity and heightened block trades—often an early warning of new swing setups or larger portfolio shuffling.
- Advance/Decline vs ASI: Upmarket ASI but downtrending breadth hints at consolidation and sector rotation. Traders—track clusters within bullish/bearish tables for breakouts or fades.
-
Unusual Volume Action:
- CHAMS PLC (+543% vs 90DMA): Price slipped -1.9%—heavy institutional repositioning or potential pre-catalyst activity.
- ROYALEX (+324%): -8.05%, deep YTD red. Large volumes on down days signal forced selling—monitor for reversal setups.
- CONHALLPLC (+225%): -9.4%. Another example of unusual sell volume into weakness.
-
YTD Leaders & Laggards (Selected Table Below):
- Fastest YTD Gainers: ABCTRANS (+83.74%, RSI 86.14!), NAHCO (+71.88%, RSI 78.15) and BETAGLAS (+69.18%, RSI 81.38). These stocks are extended and technically overbought—momentum traders should size risk tightly.
- Largest YTD Losers: SIAMLETF40 (-66.25%, RSI 32.85), MCNICHOLS (-7.89%, but YTD +8.70%), MULTIVERSE (-21.12%, RSI 8.91—deeply oversold potential bottoming candidate).
-
Momentum Table Signal Cross-checks:
- Bullish Cross-ups (15DMA > last close): BERGER PAINTS, OMATEK, NGXGROWTH INDEX. BERGER PAINTS (RSI near floor at 1.74 on 5-day gainer list) signals early trend rev up; OMATEK’s low beta offers lower-risk exposure to upside.
- Bearish Breakdowns (Close < 15DMA): Multiple financials (GTCO, ACCESSCORP, ZENITHBANK), DANGSUGAR, plus others in Insurance. Notably, many are high-dividend or sector bellwethers—evidence of rotation out of defensives?
- YTD Laggards in Bearish Table: DAARCOMM, ROYALEX, SIAMLETF40, MULTIVERSE. Some overlap with unusual volumes—forced selling signal.
-
Extreme RSI Alerts:
- Overbought: VITAFOAM (RSI 96.0! but -9.94% today), ETERNA (RSI 84.13), NAHCO (RSI 78.15), BETAGLAS (RSI 81.38) — further upside may be limited, trailing stops advised.
- Oversold: MULTIVERSE (RSI 8.9, massive YTD loss) — classic bottom-fishing candidate but only for the bold!
YTD Top 5 Gainers & Losers
| Stock | Price | 5D% | YTD% | RSI | DivY | Beta |
|---|---|---|---|---|---|---|
| ABCTRANS | 2.06 | 32.16 | 83.74 | 86.14 | 2.19 | 0.01 |
| NAHCO | 75.00 | 14.58 | 71.88 | 78.15 | 6.66 | 0.65 |
| BETAGLAS | 99.85 | 9.96 | 69.18 | 81.38 | 2.42 | 0.10 |
| FIDSON | 22.00 | 11.74 | 45.08 | 77.84 | 4.14 | 0.25 |
| SIAMLETF40 | 300.00 | -10.00 | -66.25 | 32.85 | 0.00 | 1.59 |
| MULTIVERSE | 7.05 | -18.59 | -21.12 | 8.91 | 0.85 | 0.22 |
| DAARCOMM | 0.60 | -10.00 | -20.59 | 48.48 | 0.00 | 0.71 |
| ROYALEX | 0.87 | -8.05 | -27.27 | 50.48 | 7.81 | 0.96 |
| AFRIPRUD | 17.00 | -7.82 | -26.99 | 45.27 | 1.27 | 0.64 |
Contrarian Signals (Conflicting Technicals)
- VITAFOAM: RSI 96.0 (overbought) but -9.94% drop today. May indicate "blow-off top” selling, or alternatively, a trap for shorts if reversal occurs. High volatility, use options or tight stops.
- MULTIVERSE: RSI 8.9 (deep oversold) and -9.93% today, YTD loss. Watch for short-term reversal/mean reversion trades.
- ROYALEX: High dividend yield (7.81%), high sell volume, -8.05% today. Large dividend, yet strong persistent selling suggests caution despite its yield attraction—possible value trap or forced institutional exit.
- BERGER PAINTS: Crossed above 15DMA, but multi-period RSI has been at low extremes (bullish early momentum reversal?).
Sector Heatmap (Selected Top Sectors)
| Sector | Top Movers | Direction | RSI Strength | Technical Trend |
|---|---|---|---|---|
| Consumer Goods | CADBURY, VITAFOAM | Mixed/Bullish | CADBURY (64.9), VITAFOAM (96.0) |
CADBURY: MACD bullish, above 15DMA/50DMA VITAFOAM: Peak RSI, watch for reversal |
| Banking | GTCO, ZENITHBANK, ACCESSCORP | Bearish/Profit-taking | GTCO (53.7), ZENITHBANK (53.0), ACCESSCORP (47.5) |
All crossed below 15DMA; profit-taking phase Institutional clustering high (ZENITHBANK) |
| Building Materials | BERGER | Bullish break | 1.74 (coming off extreme bottom) | Crossed above 15DMA; sparkline: 📈 |
| Energy | MULTIVERSE, ETERNA | Down | MULTIVERSE (8.9) | Both deeply oversold/overbought reversals looming |
| Insurance | MANSARD, CONHALLPLC, WAPIC | Bearish | MANSARD (n/a), WAPIC (n/a) | All crossed below 15DMA with large volumes |
Dividend Yield - Beta Matrix (Defensive Opportunities)
| Stock | Dividend Yield (%) | Beta | Commentary |
|---|---|---|---|
| AFRIPRUD | 1.27 | 0.64 | Medium yield, lower risk—good for defensive plays; watch for mean-reversion after -27% YTD loss. |
| NAHCO | 6.66 | 0.65 | Very strong dividend, moderate beta, but overbought technicals—lock-in profits? |
| ROYALEX | 7.81 | 0.96 | Very high yield but with persistent sell pressure. |
| MCNICHOLS | 5.88 | -0.11 | Defensive, moderate dividend, low beta but negative trend. |
| UBA | 5.96 | 1.56 | High-yield but with increased short-term volatility. |
High dividend with low beta remains a classic strategy, but monitor for value trap risks in names with repeated drawdowns (e.g. ROYALEX).
Institutional Clustering Alerts
- ZENITHBANK: Institutions controlled 20.17% of total institutional trade value, making it a bellwether for institutional rotation. MACD marginally negative, a sign institutions are taking risk off the table short-term.
- GTCO: Large institutional trade ($2.05B)—positions being pared down post strong run. Both ZENITHBANK and GTCO are "safety valve” stocks and any dramatic change in flows can presage sector moves.
- MTNN: Strong retail and institutional trading, up 2% today. Watch for cross-market signals.
-
High Dividend Stocks in Bearish Tables:
- ROYALEX (7.81%): In bearish plus unusual volume table — suggests forced profit-taking or structural weakness; not justifiable for long solely on yield.
- DANGSUGAR (4.27%): Also appearing in bearish table with a -5% drop today; defensive value play only if the broader trend reverses.
- RTBRISCOE, MANSARD (4.35%, 4.59%): Both on bear momentum lists; approach with caution.
-
High Dividend Stocks in Bullish Momentum Table:
- None of the highest yielders in the bullish 15DMA cross-up. Defensive income seekers should consider waiting for reversal signals.
Actionable Suggestions for Traders
- Momentum trend followers: Tighten stops on stocks with RSI > 80 (e.g. NAHCO, BETAGLAS, VITAFOAM)—parabolic moves tend to snap back hard. Partial profit-taking suggested.
- Contrarians: Look at stocks with deeply oversold RSI and high sell volume—MULTIVERSE & ROYALEX. Timely reversal trades possible but only for aggressive, risk-tolerant traders.
- Defensive dividend investors: Wait for reversal/floor formation in names like AFRIPRUD and DANGSUGAR before building positions.
- Follow the flow: Institutional volume clusters (ZENITHBANK, GTCO) are early signals for where sector rotation is headed—add these stocks to watchlists for breakouts or further sell-offs.
- Unusual Volume: Monitor CHAMS (5x normal volume but slight price drop)—often a sign of 'big prints' pre-catalyst.
Market Activity & Trade Summary Analysis
-
Retail vs Institutional Activity:
- Retail accounted for 87.3% of trade count but only 13.46% of trading value; Institutional executions 12.7% of trades, but a dominant 86.54% of value—proof that large blocks and key price discovery still belong to the "big hands”.
- Institutions were very active in blue chips: GTCO, ZENITHBANK, ACCESSCORP, MTNN, and PRESCO—suggests liquidity chasing safety and switching between defensive growth and yield names.
- For retail, ACCESSCORP, ZENITHBANK, GTCO, UBA, and MTNN led volumes—indicates both crowd chase and tendency to follow institutional cues.
- Correlation: Stocks with high institutional trading (GTCO, ZENITHBANK, ACCESSCORP) also appear in bearish 15DMA cross-down list. Possible coordinated rotation out of risk and into cash or alternative assets.
- Actionable Takeaway: Monitor any shift—especially if institutional buying re-emerges in beaten-up high-yield defensives. For now, follow the lead of "smart money” by reducing size or protecting profits in hot/crowded trades.
Hidden Insights & Subtle Patterns
- An unusual overlap between high dividend yields, high institutional activity, and bearish momentum—classic rotation out of defensive value (possibly in anticipation of rate normalization or macro shifts).
- Retail crowd continues to chase blue chips post-rally; reversals often start here—watch for leading sell signals in ACCESSCORP, GTCO, ZENITHBANK.
- Energy and Insurance: Heavy sell volume and weak breadth—setups building for short-term oversold bounce trades.
- Bullish momentum table is thin—selectivity is high; only early breaking moves (BERGER, OMATEK) on the buy radar.
Always conduct additional research and use tight risk management, especially in volatile and rotational markets like today.
|
Top ASI Gainers Over Last 5 Trading Days
|
Top ASI Losers Over Last 5 Trading Days
|
For more detailed analysis, on InfoWARE Market Data Terminal <NSEPERF> <GO>
On InfoWARE Finance Mobile App (Android, iPhone & iPad, Windows Phone and Windows 8/10), "Top Gainers & Losers"
CADBURY NIGERIA PLC. (CADBURY) topped the advancers list closing at N31.90 with a gain of 10.00% followed by NIGERIAN AVIATION HANDLING COMPANY PLC (NAHCO) which closed at N82.50 with a gain of 10.00%.
On the flip side DAAR COMMUNICATIONS PLC (DAARCOMM) and THE SIAML PENSION ETF 40 (SIAMLETF40) topped the decliners log with a loss of -10.00% at a close of N0.54, and -10.00% to close the day at N270.00 respectively.
| Symbol | LClose | %Chg |
|---|---|---|
| CADBURY | 31.90 | 10.00 |
| NAHCO | 82.50 | 10.00 |
| TIP | 4.95 | 10.00 |
| BETAGLAS | 109.80 | 9.96 |
| CAVERTON | 2.66 | 9.92 |
| Symbol | LClose | %Chg |
|---|---|---|
| DAARCOMM | 0.54 | -10.00 |
| SIAMLETF40 | 270.00 | -10.00 |
| VITAFOAM | 47.55 | -9.94 |
| MULTIVERSE | 6.35 | -9.93 |
| ETERNA | 45.00 | -9.91 |
For more detailed analysis,
- On InfoWARE Market Data Terminal <TOPG> <GO>
- On InfoWARE Finance Mobile App ( Android, iPhone & iPad and Windows 10) , "Top Gainers & Losers"
Currency Market
In the currency market, the Naira was unchanged against the dollar at 1 to 1Investment Insights - Top 5 Gainers YTD
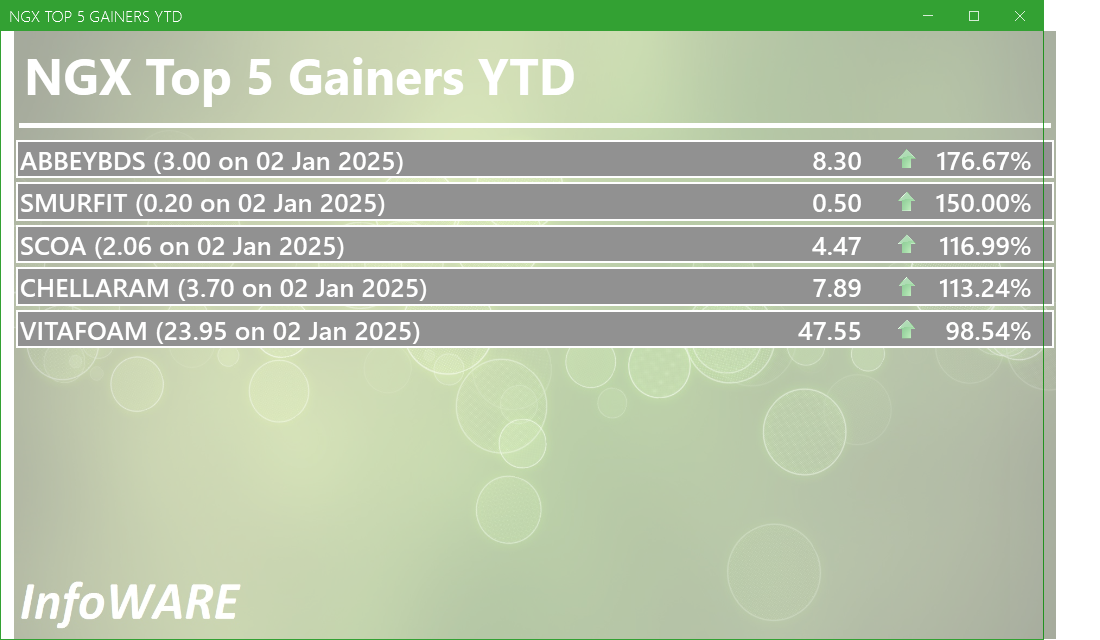
These stocks are the best performers whose price has risen faster than the market as a whole with the best returns year to date. Momentum investors believe that stocks that have outperformed the market will often continue to do so because the factors that caused them to outperform will not suddenly disappear. In addition, other investors seeking to benefit from the stock’s outperformance will often purchase the stock, further bidding its price higher and pushing the stock higher still
For more detailed analysis,
- On InfoWARE Market Data Terminal <T5YTD2> <GO>
- On InfoWARE Finance Mobile App ( Android , iPhone & iPad and Windows 10) , "Research"
NSE: Bull Signal - Price crossed above 15 Day MA
This signal implies these stocks are under buying pressure and the price might continue to rise and therefore positions should be monitored closely. Further suggested analysis include looking at the overall market (ASI) to see if the uptrend is market wide, sector wide or specific to the stock. Portfolio managers tend to use this as a signal to do more research to add to their positions or lock in some profits. Typically further analysis should be done using commands like PC and RV on the InfoWARE Market Data Terminal. Another command is ALERTS to set price triggers for possible exit or entry as necessary
For more detailed analysis,
- On InfoWARE Market Data Terminal <NSEPERF> <GO>
- On InfoWARE Finance Mobile App ( Android , iPhone & iPad and Windows 10) , "Top Gainers & Losers"
| Symbol | Price | %Chg | 15DMA | PE | EPS | DivY | MktCap | Vol | Trades | Value | LstTradeTime |
|---|---|---|---|---|---|---|---|---|---|---|---|
| BERGER | 19.60 | 8.93 | 18.63 | 14.18 | 1.22 | 1.15 | 5.68B | 1.13M | 47.00 | 22.07M | 02-May-2025 14:30:22.080 |
| OMATEK | 0.64 | 7.81 | 0.61 | 6.82 | 0.10 | 0.00 | 1.88B | 837.35K | 15.00 | 505.50K | 02-May-2025 14:30:25.210 |
| NGXGROWTH | 7,423.44 | 0.30 | 7,412.15 | 18.83 | 0.18 | 0.00 | 0.00 | 6.96M | 147.00 | 24.34M | 02-May-2025 14:30:34.530 |
NSE: BEAR Signal - Price crossed below 15 Day MA
This signal implies these stocks are under selling pressure and the price might continue to slide and therefore positions should be monitored closely. Further suggested analysis include looking at the overall market (ASI) to see if the downtrend is market wide, sector wide or specific to the stock. If the overal market trend is upwards, then since these stocks are heading in the opposite direction, then further analysis should be done using commands like PC and RV on the InfoWARE Market Data Terminal. Another command is ALERTS to set price triggers for possible exit is necessar
For more detailed analysis,
- On InfoWARE Market Data Terminal <BEARM> <GO>
- On InfoWARE Finance Mobile App ( Android , iPhone & iPad and Windows 10)
| Symbol | Price | %Chg | 15DMA | PE | EPS | DivY | MktCap | Vol | Trades | Value | LstTradeTime |
|---|---|---|---|---|---|---|---|---|---|---|---|
| GTCO | 64.00 | -2.19 | 64.11 | 7.49 | 7.10 | 1.88 | 1,883.60B | 31.87M | 1,166.00 | 2.05B | 02-May-2025 14:30:24.117 |
| ACCESSCORP | 21.90 | -2.74 | 22.28 | 8.56 | 2.81 | 1.87 | 778.44B | 52.82M | 1,111.00 | 1.16B | 02-May-2025 14:31:10.273 |
| DANGSUGAR | 35.00 | -5.00 | 35.39 | 11.48 | 3.06 | 4.27 | 425.14B | 2.70M | 285.00 | 91.15M | 02-May-2025 14:30:23.713 |
| RTBRISCOE | 1.90 | -5.26 | 1.99 | 0.00 | 0.00 | 4.35 | 2.24B | 1.51M | 26.00 | 2.89M | 02-May-2025 14:30:25.817 |
| WAPIC | 2.03 | -5.91 | 2.12 | 72.55 | 0.02 | 2.56 | 48.70B | 2.81M | 72.00 | 5.80M | 02-May-2025 14:30:27.120 |
| ROYALEX | 0.80 | -8.75 | 0.84 | 0.00 | 0.00 | 7.81 | 4.12B | 13.82M | 73.00 | 10.95M | 02-May-2025 14:30:25.590 |
| NEIMETH | 2.60 | -9.62 | 2.77 | 125.52 | 0.02 | 3.38 | 11.11B | 811.14K | 32.00 | 2.25M | 02-May-2025 14:30:24.800 |
| MANSARD | 8.10 | -9.63 | 8.18 | 31.16 | 0.24 | 4.59 | 72.90B | 7.85M | 155.00 | 64.26M | 02-May-2025 14:30:24.550 |
| CONHALLPLC | 2.89 | -10.38 | 2.94 | 69.63 | 0.03 | 2.08 | 30.94B | 11.74M | 108.00 | 34.21M | 02-May-2025 14:30:23.027 |
| DAARCOMM | 0.54 | -11.11 | 0.59 | 0.00 | 0.00 | 0.00 | 6.48B | 1.23M | 35.00 | 682.68K | 02-May-2025 14:30:23.570 |
| SIAMLETF40 | 270.00 | -11.11 | 297.84 | 0.00 | 0.00 | 4.22K | 5.00 | 1.27M | 02-May-2025 14:31:03.750 |
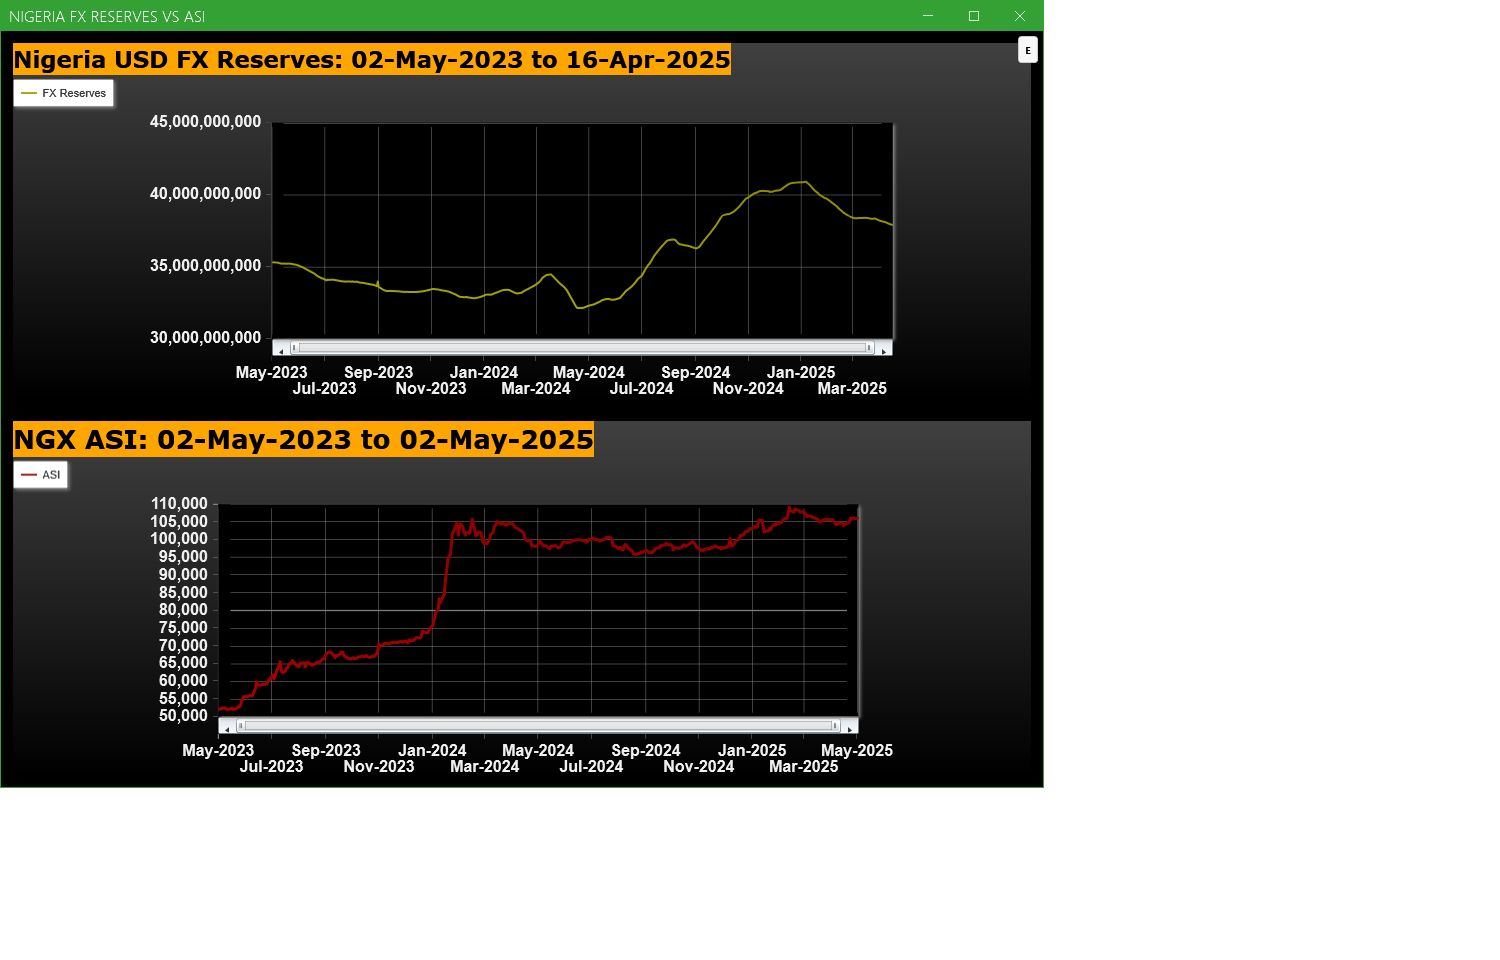
Economic Indicators - Nigeria FX Reserves Vs ASI Chart
Nigeria FX Reserves are assets held on reserve by CBN in foreign currencies. These reserves are used to back liabilities and influence monetary policy. Given the nature of the Nigeria economy, FX Reserves can appear to have an outsize influence on the economy and hence on the capital market. The chart below allows comparison of FX Reserves against the ASI to make investment decisions
For more detailed analysis,
- On InfoWARE Market Data Terminal <CI> <GO>
- On InfoWARE Finance Mobile App ( Android , iPhone & iPad and Windows 10) , "Research"
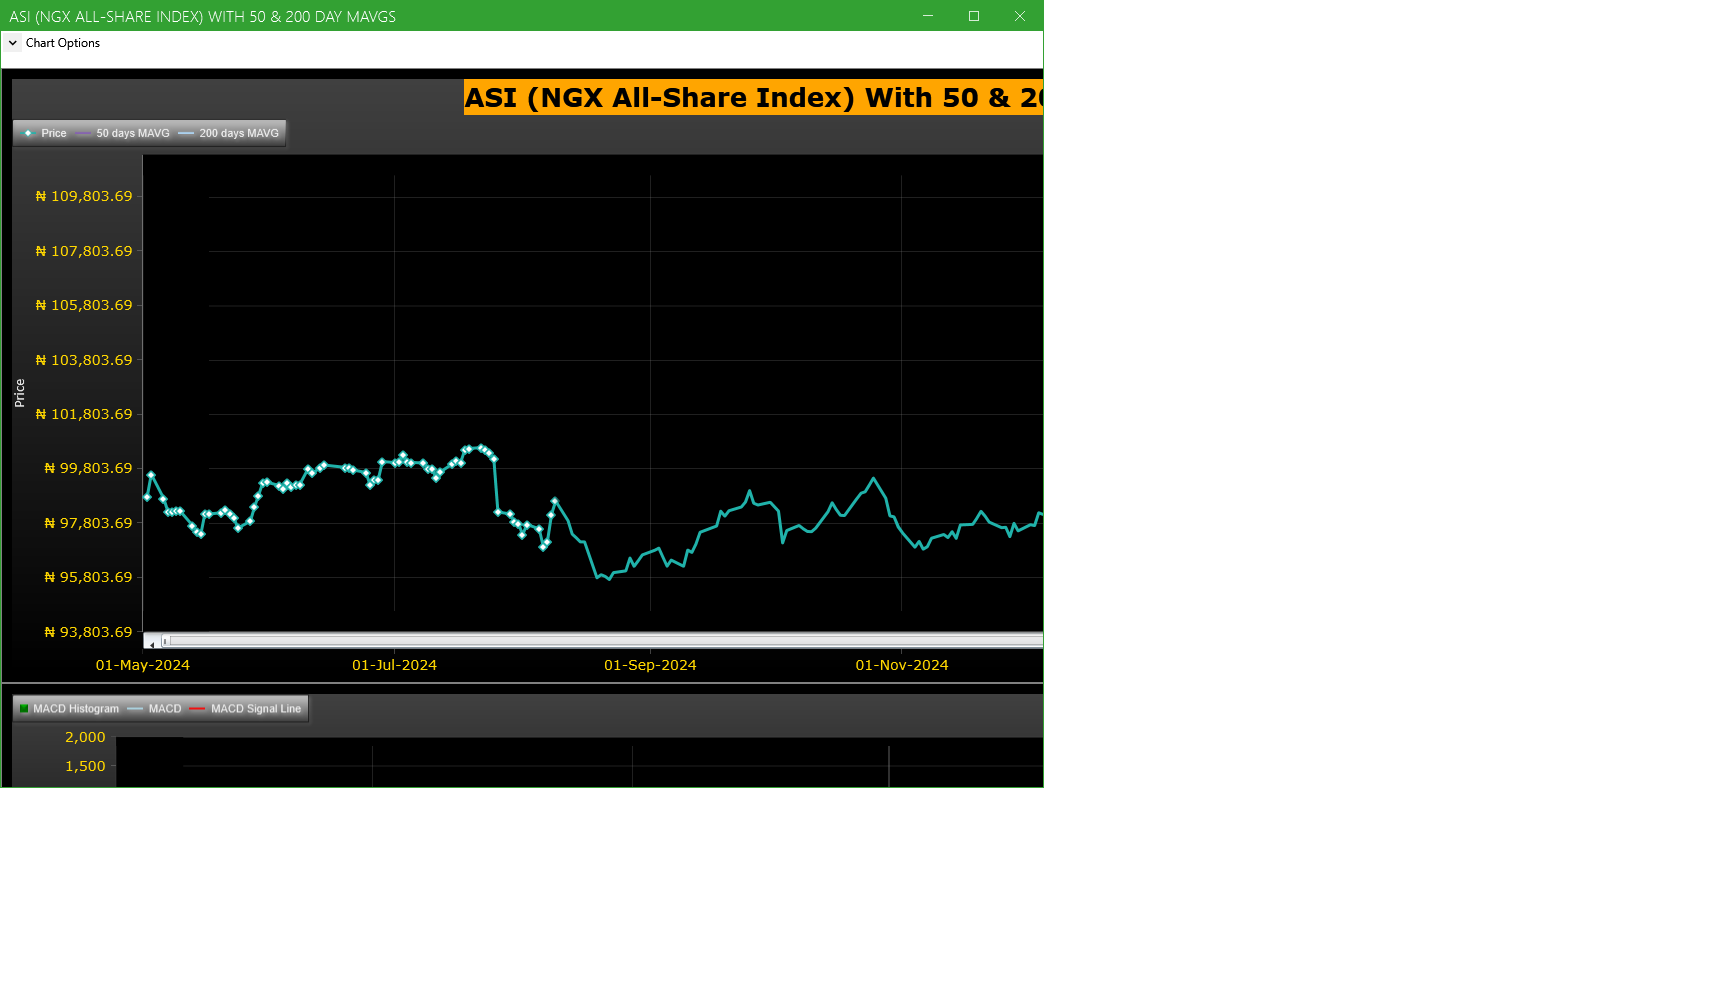
Market Trend - ASI (NGX All-Share-Index) With 50 & 200 Day MAvgs Chart
Technical traders typically use the 50 & 200 day moving averages to aid in choosing
where to enter or exit a position, which then causes these levels to act as strong
support or resistance. As a general guideline, if the price is above a moving average,
the trend is up. If the price is below a moving average, the trend is down.
It is important to note that critics of technical analysis say that moving averages act
as support and resistance because so many traders use these indicators to inform their
trading decisions. Also moving averages tend to work quite well in strong trending conditions
but poorly in choppy or ranging conditions.
Trading Strategies: Crossovers
Crossovers are one of the main moving average strategies. The first type is a price crossover,
which is when the price crosses above or below a moving average to signal a potential change
in trend. Another strategy is to apply two moving averages to a chart: one longer and one
shorter. When the shorter-term MA crosses above the longer-term MA, it is a buy signal, as
it indicates that the trend is shifting up. This is known as a golden cross. Meanwhile, when
the shorter-term MA crosses below the longer-term MA, it is a sell signal, as it indicates that
the trend is shifting down. This is known as a dead/death cross
For more detailed analysis,
- On InfoWARE Market Data Terminal <CI> <GO>
- On InfoWARE Finance Mobile App ( Android , iPhone & iPad and Windows 10) , "Research"
Unusual Volume: Volume traded is more than double the 90 day moving average (All exchanges; ASI & ASem). For more detailed analysis,
- On InfoWARE Market Data Terminal <UV> <GO>
- On InfoWARE Finance Mobile App ( Android , iPhone & iPad and Windows 10)
| Symbol | Name | Volume | 90DAvgVol | %VolChg | Price | LClose | %Chg | Trades | Value |
|---|---|---|---|---|---|---|---|---|---|
| CHAMS | CHAMS PLC | 51.56M | 8.02M | 543.32 | 2.06 | 2.10 | -1.90 | 302 | 108.86M |
| FCMB | FCMB GROUP PLC. | 34.52M | 11.64M | 196.66 | 9.55 | 9.25 | 3.24 | 427 | 314.54M |
| JAPAULGOLD | JAPAUL GOLD & VENTURES PLC | 15.59M | 5.60M | 178.49 | 1.98 | 2.14 | -7.48 | 152 | 31.38M |
| ROYALEX | ROYAL EXCHANGE PLC. | 13.82M | 3.26M | 324.21 | 0.80 | 0.87 | -8.05 | 73 | 10.95M |
| CONHALLPLC | CONSOLIDATED HALLMARK INSURANCE PLC | 11.74M | 3.60M | 225.65 | 2.89 | 3.19 | -9.40 | 108 | 34.21M |
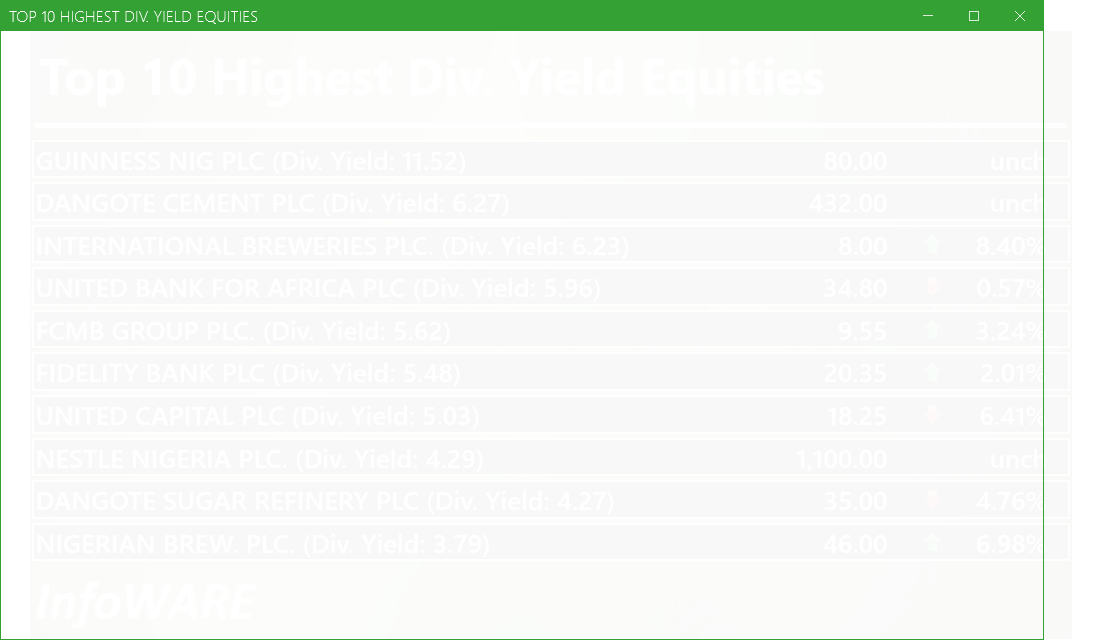
Investment Insights - High Div. Stocks
Dividend stocks distribute a portion of the company earnings to investors on a regular basis and they can a great choice for investors looking for regular income. As an investment or trading strategy, high dividend yield equities provide annual cash payments as against mostly capital gains in the price of a stock. The list in the table below represent the highest dividend paying stocks from the list of the most liquid stocks in the NSE top 30.
For more detailed analysis,
- On InfoWARE Market Data Terminal <HYIELD> <GO>
- On InfoWARE Finance Mobile App ( Android , iPhone & iPad and Windows 10) , "Research"
Investment Insights - Stocks outperforming the ASI but with approximately the same risk
These list of stocks represent equities that are less risky than the ASI but doing better than the ASI (All Shares Index) using the YTD (Year to Date) returns as the measure. The risk is measured by Beta. Beta is an assessment of a stock's tendency to undergo price changes, (its volatility), as well as its potential returns compared to the ASI. It is expressed as a ratio, where a score of 1 represents performance comparable to the ASI, and returns above or below the market may receive scores greater or lower than 1.
For a full list of both positively and negatively corelated stocks visit InfoWARE Market Data Terminal
- On InfoWARE Market Data Terminal <BANL> <GO>
- On InfoWARE Finance Mobile App ( Android , iPhone & iPad and Windows 10)
| Symbol | DivYield | PE | EPS | Beta | %ChgYTD | ASIYTDReturn | BetaDiff |
|---|---|---|---|---|---|---|---|
| HONYFLOUR | 1.40 | 16.28 | 0.31 | 0.99 | 89.31 | 2.77 | 0.01 |
| CAVERTON | 5.52 | 1.15 | 1.57 | 0.98 | 4.31 | 2.77 | 0.02 |
| FIDELITYBK | 5.48 | 13.24 | 1.17 | 0.89 | 19.71 | 2.77 | 0.11 |
| NB | 3.79 | 16.95 | 1.60 | 0.79 | 43.75 | 2.77 | 0.21 |
| UNILEVER | 2.81 | 67.09 | 0.40 | 0.75 | 19.44 | 2.77 | 0.25 |
| VETGOODS | 0.00 | 0.71 | 15.41 | 2.77 | 0.29 | ||
| VETGRIF30 | 0.00 | 0.71 | 4.64 | 2.77 | 0.29 | ||
| ABBEYBDS | 1.43 | 0.00 | 0.00 | 0.70 | 176.67 | 2.77 | 0.30 |
| NEM | 6.52 | 24.99 | 0.37 | 0.69 | 19.17 | 2.77 | 0.31 |
| TANTALIZER | 1.50 | 0.00 | 0.00 | 0.69 | 4.44 | 2.77 | 0.31 |
African Markets
| Name | LClose | Change | %Chg |
|---|---|---|---|
| BRVM Stock Exchange | 287.07 | -0.63 | -0.22 |
| Botswana Stock Exchange | 10,264.36 | 31.72 | 0.31 |
| Egyptian Exchange | 32,126.22 | 83.31 | 0.26 |
| Ghana Stock Exchange | 6,095.57 | 30.33 | 0.50 |
| Lusaka Stock Exchange | 16,649.26 | 36.55 | 0.22 |
| Casablanca Stock Exchange | 17,390.38 | 19.11 | 0.11 |
Nigeria Market Indexes
| Symbol | LClose | %Chg | WTD% | MTD% | QTD% | YTD% | MktCap | Trades |
|---|---|---|---|---|---|---|---|---|
| ASI | 106,042.57 | 0.23 | -0.08 | 0.00 | 0.47 | 2.77 | 17,291 | |
| NGX30 | 3,937.55 | 0.34 | -0.10 | 0.00 | 0.47 | 3.22 | 9,760 | |
| NGXAFRBVI | 2,555.39 | -1.46 | -1.90 | 0.00 | -4.04 | 3.01 | 4,333 | |
| NGXAFRHDYI | 17,678.31 | -1.62 | 0.08 | 0.00 | 6.21 | 3.82 | 4,429 | |
| NGXASEM | 1,591.68 | 0.00 | 0.00 | 0.00 | 0.24 | 0.50 | 4 | |
| NGXBNK | 1,125.29 | -1.49 | -1.67 | 0.00 | -3.06 | 3.48 | 4,631 | |
| NGXCG | 3,013.78 | -0.23 | -0.29 | 0.00 | 0.11 | 6.52 | 9,648 | |
| NGXCNSMRGDS | 2,045.76 | 2.03 | 0.50 | 0.00 | 12.68 | 17.95 | 1,878 | |
| NGXCOMMDTY | 991.71 | 0.61 | 0.61 | 0.00 | -1.18 | -0.83 | ||
| NGXGROWTH | 7,423.44 | 0.30 | 0.18 | 0.00 | 0.43 | -4.37 | 147 | |
| NGXINDUSTR | 3,367.36 | 0.08 | 0.09 | 0.00 | -3.51 | -5.72 | 984 | |
| NGXINS | 650.36 | -3.50 | -3.19 | 0.00 | -4.40 | -17.28 | 1,352 | |
| NGXLOTUSISLM | 7,582.55 | 0.97 | 0.56 | 0.00 | 0.38 | 8.82 | 2,370 | |
| NGXMAINBOARD | 5,174.09 | 0.23 | -0.04 | 0.00 | 2.23 | 3.40 | 12,695 | |
| NGXMERIGRW | 7,400.98 | 0.44 | 1.14 | 0.00 | 7.89 | 13.46 | 2,314 | |
| NGXMERIVAL | 10,321.78 | -1.23 | -2.18 | 0.00 | 0.28 | -1.04 | 5,183 | |
| NGXOILGAS | 2,350.70 | -0.17 | -0.03 | 0.00 | -3.92 | -13.30 | 385 | |
| NGXPENBRD | 1,907.92 | 0.14 | 0.28 | 0.00 | 1.02 | 4.17 | 14,353 | |
| NGXPENSION | 4,957.35 | 0.18 | 0.47 | 0.00 | 3.57 | 9.34 | 10,621 | |
| NGXPREMIUM | 10,057.43 | 0.23 | 0.35 | 0.00 | -1.06 | 3.33 | 4,449 | |
| NGXSOVBND | 650.00 | -0.19 | -0.19 | 0.00 | 3.69 | 8.06 | 1 |
For more detailed analysis,
- On InfoWARE Market Data Terminal <MKTINS> <GO>
- On InfoWARE Finance Mobile App ( Android, iPhone & iPad and Windows 10) , "Market Indexes"
Find the topic interesting? Will like to comment? Contact Us at solutions@infowarelimited.com
Top News

InfoWARE AI Analyst Weekly Market Report: 02-May-2025
Chart Of The Day - ASI Chart Vs ASI Advance Decline Line (YTD) (02-May-2025 15:10:05.011)
InfoWARE AI Analyst Daily Market Report: 02-May-2025

[XNSA]>> CORDROS MILESTONE FUNDS' BID & OFFER PRICES
[AIICO]>>Notice of Meeting -<AIICO INSURANCE PLC.>
[MERVALUE]>> DAILY INDICATIVE PRICES
[XNSA]>> OFF MARKET TRADE
[XNSA]>> NGX FIXED INCOME INDICATIVE PRICE LIST FOR MAY 02, 2025
[XNSA]>> WEMA BANK PLC: ACTIVATION OF CODE FOR TRADING IN RIGHTS
[XNSA]>> CLOSING GONG CEREMONY IN HONOUR OF DR. PASCAL G DOZIE, OON, CON
[XNSA]>> DAILY FUND PRICE SUBMISSION - FCMB ASSET MANAGEMENT LIMITED
[SIAMLETF40]>> DAILY INDICATIVE PRICES
[XNSA]>> NOTIFICATION OF PRICE ADJUSTMENT
[ABCTRANS]>>Corporate Disclosures-<ABC TRANSPORT PLC>
[BUAFOODS]>>Corporate Disclosures-<BUA FOODS PLC>
[MTNN]>>Corporate Disclosures-<MTN Nigeria Communications Plc>
InfoWARE AI Analyst Daily Market Report: 30-Apr-2025
Chart Of The Day - ASI Chart Vs ASI Advance Decline Line (YTD) (30-Apr-2025 15:07:14.535)
InfoWARE AI Analyst Daily Market Report: 30-Apr-2025
[ABBEYBDS]>>Notice of Meeting -<ABBEY MORTGAGE BANK PLC>
[XNSA]>> WORKERS DAY PUBLIC HOLIDAY NOTIFICATION: 01 MAY, 2025
[ETI]>>Corporate Disclosures-<ECOBANK TRANSNATIONAL INCORPORATED>
[SEPLAT]>>Corporate Disclosures-<SEPLAT ENERGY PLC>
[XNSA]>> RESIGNATION OF A DIRECTOR
[TOTAL]>>Corporate Disclosures-<TotalEnergies Marketing Nigeria Plc>
[NESTLE]>>Corporate Disclosures-<NESTLE NIGERIA PLC.>
[XNSA]>> CORDROS MILESTONE FUNDS' BID & OFFER PRICES
[XNSA]>> CLOSING GONG CEREMONY IN HONOUR OF DR. PASCAL G DOZIE, OON, CON
[NEWGOLD]>> DAILY INDICATIVE PRICES
[XNSA]>> EMERGING AFRICA DAILY MUTUAL FUND PRICES
Get IDIA - the stock trading app for the modern investor
Solutions by Business
Product Suites
Company
Contacts
- 8th Floor,
- South Atlantic Petroleum Towers,
- 1 Adeola Odeku Street,
- Victoria Island,
- Lagos, Nigeria.
- Email: solutions@infowarelimited.com
Follow Us
 |
 |
 |
 |