


InfoWARE AI Analyst Daily Market Report: 30-Apr-2025 | InfoWARE Finance
Get IDIA - the stock trading app for the modern investor


InfoWARE AI Analyst Daily Market Report: 30-Apr-2025
(Source: InfoWARE Terminal, Date: 30-Apr-2025)
Dear Investor,
NGX Market Snapshot – Wednesday, April 30, 2025
Today on the NGX, the All Share Index (ASI) eased by -0.12% to close at 105,931.18, reflecting a tepid session as investors digested recent gains. Market turnover was notably soft, plunging by -65.36% to ₦11.92bn on a much lower traded volume of 373.79mn relative to the prior session. Despite the broad index closing in red, market breadth was positive at 1.38x, with 40 advancers against 29 decliners. On the technical front, several YTD leaders sustained their momentum while high-volume activity in select bank stocks signaled sector rotation and institutional plays. Notably, some momentum names flashed contrarian signs, and huge swings in the ETF space spiced up an otherwise sideways market.
- Market Breadth: Positive (1.38x), with more advancers (40) than decliners (29) despite the negative index print. This underpins rotational strength beneath the surface.
- Market Turnover: Value dropped sharply by -65.36%, signaling a pause among institutional investors and possible risk aversion after recent run-ups.
- Top Gainers:
- LOTUS HALAL EQUITY ETF (+10.00%)—ETF saw a technical breakout with RSI 68.5 and surging MACD, reflecting broad-based interest in sharia-compliant equities.
- VITAFOAM NIG PLC. (+10.00%)—Enormous momentum as RSI spiked to 94 (deeply overbought). Strong 40% MTD & YTD return at +120% hints at exuberance—possible profit-taking risk ahead.
- LIVESTOCK FEEDS PLC. (+9.97%)—Snaps back after being a YTD laggard; still, RSI subdued at 42.2, suggesting this could be just a technical bounce.
- Top Losers:
- VETIVA S & P NIGERIA SOV. BOND ETF (-10.68%)—ETF volatility continues; despite price drop, RSI at 64.6 and positive MACD reflect a wild, somewhat non-correlated move.
- ETI (-10.00%)—Despite being in the bullish camp recently, ETI saw a dramatic selloff on high volume, with RSI at 71 (overbought), signaling a probable reversal point.
- INTBREW (-10.00%)—Pulled back after an overheated bullish run (RSI 85), likely succumbing to profit-taking.
Key Analytical Insights & Forward View
- Low Turnover Implications: The sharp drop in traded value despite decent breadth points to a less conviction-driven rally. Recent winners may be running out of new buyers; expect volatility as large hands reload or step back.
- Advancers vs Decliners: The prevalence of advancers (72 tickers up in volume) highlights speculative churn and possible retail rotation into mid- and small-caps.
- Unusual Volume Highlights:
- WEMABANK: +264% vs 90-day avg—Aggressive buying (up 9.82% today) with RSI at 86 reinforces near-term bullish momentum but is in high-risk overbought territory; caution needed.
- MTNN: +241% unusual volume—Big institutional flows (3.6bn trade value), up 4.17% day, suggests strategic accumulation possibly on positive sector data.
- UBA, TRANSCORP underscore bank-led demand, confirming banking sector's outsize institutional presence today.
- Year-To-Date (YTD) Top Gainers: Names like VITAFOAM (+120%), ETERNA (+105%), WEMABANK (+66%), LOTUSHAL15 (+47%) dominate momentum tables & are drawing both retail and institutional flow—yet all show extremely high RSI (most 70-95), suggesting exhaustion risk.
- YTD Losers & Bearish Momentum: Bearish momentum signals are clustering in illiquid/weak stocks (MERISTEM ETF, ARADEL, MULTIVERSE), often coupled with ultra-low RSI (<10). They may be ripe for technical bounces, but structural selling lingers.
- Bullish and Bearish Momentum
- Many short-term bullish signals (crosses above 15DMA) in stocks like UPL, MBENEFIT, MTNN, and FCMB—supported by strong, positive trend in RSI and MACD (especially UPL/MTNN with outsized volumes, showing conviction).
- Bearish signals clear in GUINEAINS and ETI (closing below 15DMA), both at risk of further slide; ETI's high RSI hints that the pullback could deepen as momentum is unwinding from overbought levels.
- Unusual Overlaps:
- VITAFOAM & LOTUSHAL15: Both in Top Gainers for the day and YTD, signaling persistent positive sentiment. However, their overbought territory calls for disciplined risk management.
- MERVALUE: Both in day's and YTD's top losers, with RSI of ~5—a sign of deep overselling, watch for snapback rallies but liquidity risk is high.
Contrarian Signals
- CHAMPION BREW. PLC.—Despite moderate RSI (54.4) and bullish MACD crossover, the stock is still -9.8% YTD. This mixed picture suggests it may be gearing up for a recovery, especially as sentiment rotates to second-tier consumer plays.
- LIVESTOCK FEEDS PLC. (+9.97% today, +91.6% YTD)—Fresh bounce but RSI slipped today (49 -> 42), signaling underlying weakness despite price gains.
- ETI—RSI at 71 (overbought) but a sharp negative price move (-10%). Caution: further downside likely if momentum breaks down.
Sector Heatmaps & Institutional/Retail Activity
| Sector | Key Movers | Sector Perf. (1D) | Retail Activity | Institutional Activity | Technical Trend |
|---|---|---|---|---|---|
| Banking | UBA, ACCESS, GTCO, ZENITHBANK, ETI | Mildly Positive | High | Very High | ↑↑ (15DMA>50DMA banks, strong volume) |
| Telecom | MTNN | Strong Positive | Low | High | ↑ (Institutional-led breakout) |
| Consumer | VITAFOAM, INTBREW, LIVESTOCK | Mixed | Medium | Low | ↑↑ (VITAFOAM overbought, risk of turning ↓) |
| ETF | LOTUSHAL15, VSPBONDETF, MERVALUE | Volatile | Low | Medium | ↓↑ (LOTUSHAL15 ↑, MERVALUE ↓) |
| Insurance | MBENEFIT | Positive | Low | Low | ↑ (Bullish price breakout) |
Dividend Yield & Beta Matrix: Defensive Opportunity Map
| Stock | Dividend Yield | Beta | Risk/Defensiveness | Momentum Signal |
|---|---|---|---|---|
| AFRIPRUD* (benchmark) | 1.27% | 0.64 | Low Beta (defensive) | - |
| UBA | 5.96% | 1.56 | Medium/High Beta | ↑ (Unusual volume, moderate momentum) |
| NEM | 6.52% | 0.69 | Low/Medium Beta | Mixed (recent slide, look for support) |
| VITAFOAM | 7.03% | 0.47 | Low Beta | Overbought ↑ |
| FIDSON | 4.14% | 0.25 | Low Beta (very defensive) | ↑ (Hot YTD, bullish MACD/RSI) |
| FCMB | 5.62% | 1.17 | Medium Beta | ↑ (Bullish signal, 15DMA cross, volume rising) |
*AFRIPRUD included as sector benchmark for yield vs. beta. Stocks in green show simultaneous high yield and low or modest beta—good for defensive positioning amid volatility.
Institutional Clustering Alerts
- ZENITHBANK: Institutional trade value share at 20.17% of total sector (high clustering), suggesting banks remain an institutional favorite. On the opposite end, retail flow in ZENITHBANK is just 0.89% by trade value, reflecting divergent motivations.
- MTNN: Consistent institutional dominance (27.79% of Inst. trade value), plus huge volume acceleration (+241% vs avg), confirms this is the liquidity center and potential lead indicator for sector direction.
High Dividend Yield Stocks: Overlap with Momentum Plays
- VITAFOAM (7.03% yield, RSI 94, MACD bull) — Strong total return story, but technical overextension may bring volatility. Defensive investors may look to lock in some profits.
- FCMB (5.62% yield, bullish cross above 15DMA) — Momentum plus income, but Beta is higher (1.17); suitable for balanced strategies.
- NEM (6.5% yield, RSI 55.6, mild beta) — Not in top gainer/loser spots today, but YTD winner; remains a quiet outperformer among income-seekers.
Trading Playbook & Tactical Takeaways
- Watch WEMABANK—the highest volume spike and sharp price move may be peaking (RSI 86); nimble traders can consider trailing stops to protect gains.
- MTNN—insti-led breakout with volume: could signal continuation toward previous highs. Ideal for momentum traders but watch RSI rebound confirmation.
- For defensive income, VITAFOAM and NEM screen well, but position-sizing is key due to overbought risk.
- ETFs (LOTUSHAL15, VSPBONDETF) are highly volatile; only for sophisticated traders or those hedging core exposures.
- If seeking to fade overbought rallies, watch for reversal patterns, especially in names like VITAFOAM, WEMA, INTBREW.
YTD Top 5 Gainers & Losers
| Symbol | Name | Price | %ChgYTD | RSI | Div Yield | Beta | Technical Status |
|---|---|---|---|---|---|---|---|
| VITAFOAM | VITAFOAM NIG PLC. | 48.00 | 120.46% | 94.1 | 7.03% | 0.47 | Overbought, MACD bullish, 15DMA>50DMA ↑↑ |
| ETERNA | ETERNA PLC. | 48.00 | 105.56% | 82.3 | 0.68% | 1.34 | Bullish, MACD crossover, High RSI |
| WEMABANK | WEMA BANK PLC. | 13.75 | 65.93% | 86.0 | 5.81% | 1.25 | Bullish, unusual volume, RSI overheated |
| LOTUSHAL15 | LOTUS HALAL EQUITY ETF | 44.22 | 47.40% | 68.5 | 0.00% | -0.08 | Strong bull momentum, ETF demand |
| FIDSON | FIDSON HEALTHCARE PLC | 21.00 | 39.68% | 72.9 | 4.14% | 0.25 | Bullish, high RSI, 15DMA cross |
| MERVALUE | MERISTEM VALUE ETF | 120.00 | -45.92% | 4.8 | 0.00% | 4.95 | Deeply oversold, liquidity risk |
| ARADEL | ARADEL HOLDINGS PLC | 448.00 | -25.08% | 4.0 | 1.72% | 6.33 | Bearish, macro/sector headwind |
| JOHNHOLT | JOHN HOLT PLC | 5.80 | -25.55% | 6.5 | 1.24% | -0.20 | Oversold, yield offers support |
| SUNUASSUR | SUNU ASSURANCES NIGERIA PLC | 4.90 | -58.88% | 39.1 | 0.99% | 0.27 | Bearish, minor technical bounce risk |
| MULTIVERSE | MULTIVERSE PLC | 7.05 | -12.42% | 8.9 | 0.85% | 0.21 | Deeply oversold, liquidity warning |
Market Activity & Trade Patterns: Institutional vs Retail
- Institutional presence loomed large—accumulating 64.43% of volumes and 86.43% of trade value, despite accounting for only 11.44% of trades by count. This underscores the outsized impact of large blocks—which today flooded into big caps like MTNN, ZENITHBANK, UBA, and ACCESSCORP.
- Retail traders made up 88.56% of all trades by count but captured only 13.57% of trade value, emphasizing that retail action is focused on lower ticket, often speculative names.
- Top 5 Most Traded by Institutional:
- MTNN (Telecom): Massive flow, price breakout, volume 241% above norm. Confirms sector focus and buy-side conviction.
- ZENITHBANK / UBA / ACCESSCORP (Banking): Together dominate both retail and insti-flows—sector rotation and "safety in size" theme.
- GTCO (Banking): High insti and retail activity despite mild price setback; likely setting up for mean reversion bounce.
- Top 5 Most Traded by Retail:
- Same large caps (ZENITHBANK, ACCESSCORP, GTCO, UBA, MTNN), but with a much smaller volume per trade, hinting at shadowing institutional sentiment.
-
Actionable Insight:
- Institutional clustering suggests big money prefers high-liquidity, established names for risk management—winners here often see price resilience.
- Retail is amplifying moves in already hot institutional names, but should be cautious of "late-to-the-party" risk in high-RSI stocks.
Hidden Insights & Subtle Patterns
- Institutions "buying conviction" today was on low-index day—sign of possible defensive positioning or quiet big money accumulation ahead of newsflow.
- YTD top gainers are becoming technical overbought all at once—traditionally a spot for mean reversion. Traders may find short-term reversal setups, particularly if volumes dry up on further up moves.
- Defensive value: Stocks like NEM and UBA (strong yield; lower beta) may offer cushion if broad market pulls back, especially as profit-taking intensifies in leaders.
Sparklines crossovers: ↑↑ = 15DMA above 50DMA, accelerating uptrend
↑ = Positive 15DMA cross, uptrend starting
↑↓ = Volatile, whipsaw signals
In summary: Today’s session illustrated an underlying tug-of-war—breadth remains healthy, but technicals flash caution for momentum chasers. Sectors like banking and telecom saw outsized institutional interest, while top gainers risk exhaustion. Stay tactical, and use both technical and volume signals to calibrate risk and opportunity going into Thursday.
|
Top ASI Gainers Over Last 5 Trading Days
|
Top ASI Losers Over Last 5 Trading Days
|
For more detailed analysis, on InfoWARE Market Data Terminal <NSEPERF> <GO>
On InfoWARE Finance Mobile App (Android, iPhone & iPad, Windows Phone and Windows 8/10), "Top Gainers & Losers"
LOTUS HALAL EQUITY ETF (LOTUSHAL15) topped the advancers list closing at N44.22 with a gain of 10.00% followed by UNIVERSITY PRESS PLC. (UPL) which closed at N3.74 with a gain of 10.00%.
On the flip side VETIVA S & P NIGERIA SOVEREIGN BOND ETF (VSPBONDETF) and MERISTEM VALUE EXCHANGE TRADED FUND (MERVALUE) topped the decliners log with a loss of -10.68% at a close of N251.00, and -10.00% to close the day at N108.00 respectively.
| Symbol | LClose | %Chg |
|---|---|---|
| LOTUSHAL15 | 44.22 | 10.00 |
| UPL | 3.74 | 10.00 |
| VITAFOAM | 52.80 | 10.00 |
| LIVESTOCK | 8.49 | 9.97 |
| CILEASING | 4.00 | 9.89 |
| Symbol | LClose | %Chg |
|---|---|---|
| VSPBONDETF | 251.00 | -10.68 |
| MERVALUE | 108.00 | -10.00 |
| ETI | 28.80 | -10.00 |
| INTBREW | 7.38 | -10.00 |
| Ikejahotel | 12.30 | -9.89 |
For more detailed analysis,
- On InfoWARE Market Data Terminal <TOPG> <GO>
- On InfoWARE Finance Mobile App ( Android, iPhone & iPad and Windows 10) , "Top Gainers & Losers"
NSE: Bull Signal - Price crossed above 15 Day MA
This signal implies these stocks are under buying pressure and the price might continue to rise and therefore positions should be monitored closely. Further suggested analysis include looking at the overall market (ASI) to see if the uptrend is market wide, sector wide or specific to the stock. Portfolio managers tend to use this as a signal to do more research to add to their positions or lock in some profits. Typically further analysis should be done using commands like PC and RV on the InfoWARE Market Data Terminal. Another command is ALERTS to set price triggers for possible exit or entry as necessary
For more detailed analysis,
- On InfoWARE Market Data Terminal <NSEPERF> <GO>
- On InfoWARE Finance Mobile App ( Android , iPhone & iPad and Windows 10) , "Top Gainers & Losers"
| Symbol | Price | %Chg | 15DMA | PE | EPS | DivY | MktCap | Vol | Trades | Value | LstTradeTime |
|---|---|---|---|---|---|---|---|---|---|---|---|
| UPL | 3.74 | 9.09 | 3.43 | 7.13 | 0.59 | 0.60 | 1.61B | 558.82K | 6.00 | 2.09M | 30-Apr-2025 14:30:52.863 |
| FGSUK2033S6 | 103.96 | 8.62 | 99.20 | 0.00 | 0.00 | 115.00 | 2.00 | 119.55K | 30-Apr-2025 14:31:08.587 | ||
| MBENEFIT | 0.90 | 6.67 | 0.88 | 5.43 | 0.11 | 3.28 | 18.06B | 1.10M | 38.00 | 982.42K | 30-Apr-2025 14:30:49.320 |
| MTNN | 250.00 | 4.00 | 244.56 | 16,715.80 | 0.01 | 3.29 | 5,088.63B | 14.69M | 721.00 | 3.61B | 30-Apr-2025 14:32:00.930 |
| FCMB | 9.25 | 3.24 | 9.19 | 104.31 | 0.09 | 5.62 | 183.18B | 9.56M | 322.00 | 86.30M | 30-Apr-2025 14:30:47.353 |
| STANBIC | 61.05 | 3.03 | 60.03 | 6.87 | 8.23 | 3.54 | 791.02B | 353.03K | 98.00 | 21.69M | 30-Apr-2025 14:30:51.873 |
| FIRSTHOLDCO | 24.85 | 1.21 | 24.79 | 0.00 | 0.00 | 6.85M | 371.00 | 169.96M | 30-Apr-2025 14:32:16.490 | ||
| NGXLOTUSISLM | 7,509.65 | 0.68 | 7,486.41 | 1,270.93 | 62.77 | 0.00 | 0.00 | 28.17M | 2,326.00 | 4.45B | 30-Apr-2025 14:31:20.363 |
NSE: BEAR Signal - Price crossed below 15 Day MA
This signal implies these stocks are under selling pressure and the price might continue to slide and therefore positions should be monitored closely. Further suggested analysis include looking at the overall market (ASI) to see if the downtrend is market wide, sector wide or specific to the stock. If the overal market trend is upwards, then since these stocks are heading in the opposite direction, then further analysis should be done using commands like PC and RV on the InfoWARE Market Data Terminal. Another command is ALERTS to set price triggers for possible exit is necessar
For more detailed analysis,
- On InfoWARE Market Data Terminal <BEARM> <GO>
- On InfoWARE Finance Mobile App ( Android , iPhone & iPad and Windows 10)
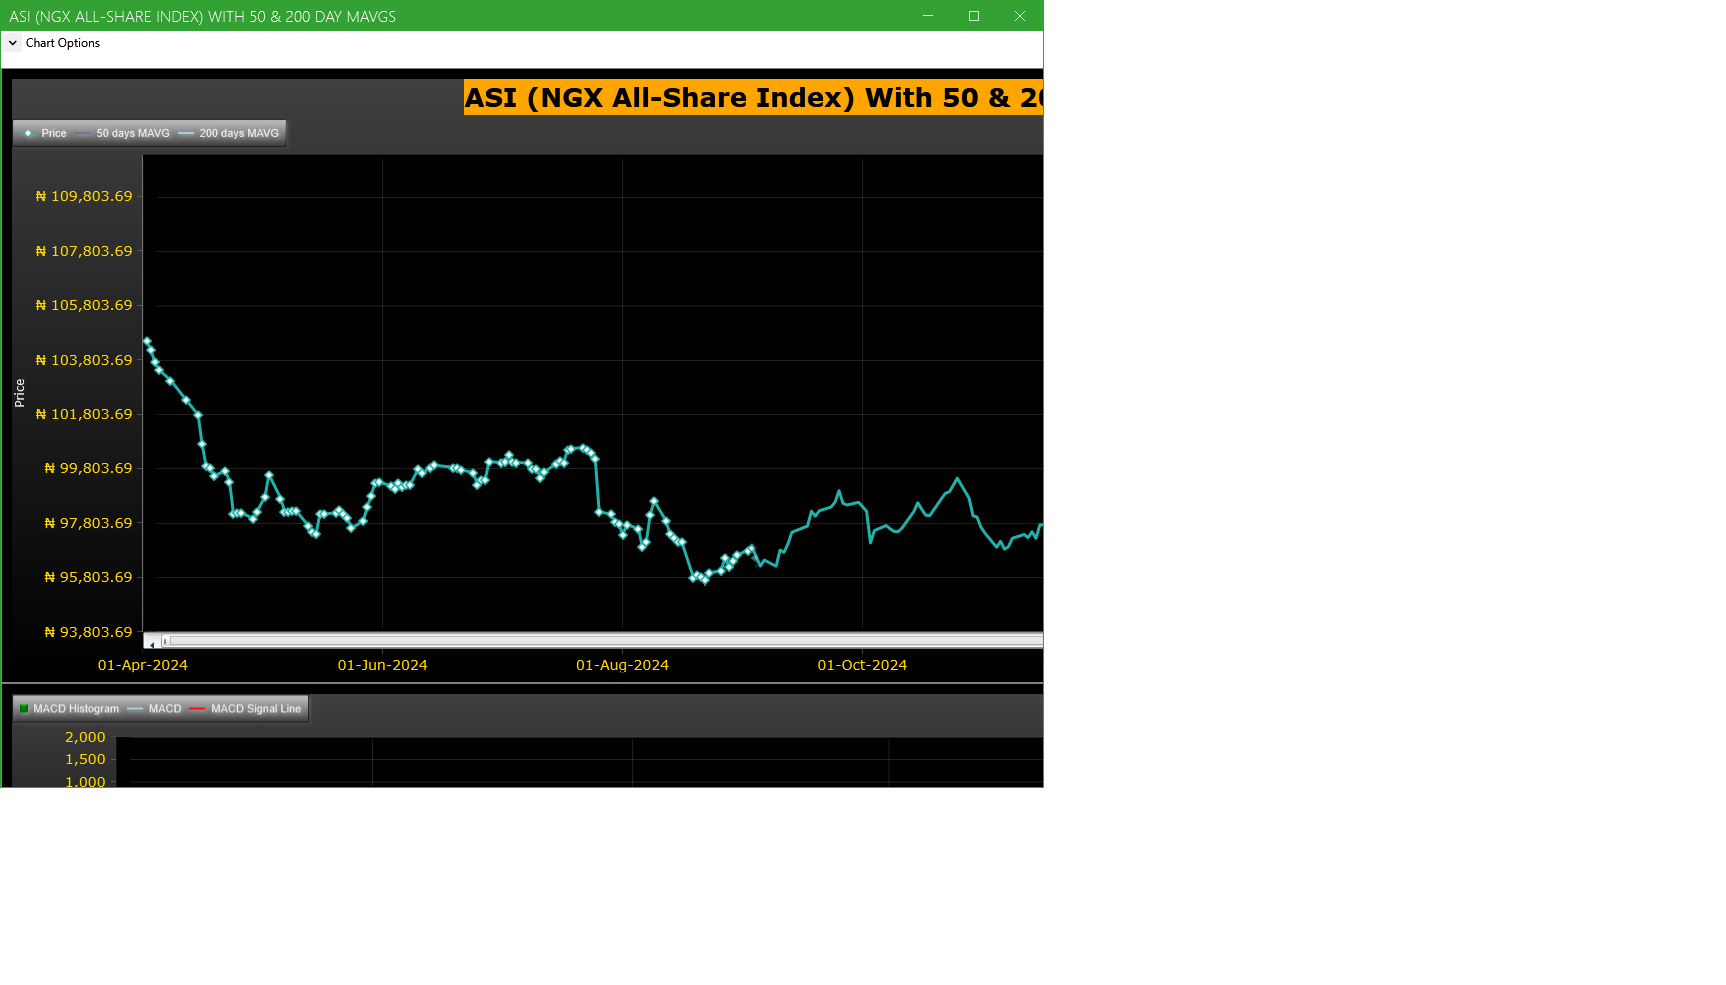
Market Trend - ASI (NGX All-Share-Index) With 50 & 200 Day MAvgs Chart
Technical traders typically use the 50 & 200 day moving averages to aid in choosing
where to enter or exit a position, which then causes these levels to act as strong
support or resistance. As a general guideline, if the price is above a moving average,
the trend is up. If the price is below a moving average, the trend is down.
It is important to note that critics of technical analysis say that moving averages act
as support and resistance because so many traders use these indicators to inform their
trading decisions. Also moving averages tend to work quite well in strong trending conditions
but poorly in choppy or ranging conditions.
Trading Strategies: Crossovers
Crossovers are one of the main moving average strategies. The first type is a price crossover,
which is when the price crosses above or below a moving average to signal a potential change
in trend. Another strategy is to apply two moving averages to a chart: one longer and one
shorter. When the shorter-term MA crosses above the longer-term MA, it is a buy signal, as
it indicates that the trend is shifting up. This is known as a golden cross. Meanwhile, when
the shorter-term MA crosses below the longer-term MA, it is a sell signal, as it indicates that
the trend is shifting down. This is known as a dead/death cross
For more detailed analysis,
- On InfoWARE Market Data Terminal <CI> <GO>
- On InfoWARE Finance Mobile App ( Android , iPhone & iPad and Windows 10) , "Research"
Unusual Volume: Volume traded is more than double the 90 day moving average (All exchanges; ASI & ASem). For more detailed analysis,
- On InfoWARE Market Data Terminal <UV> <GO>
- On InfoWARE Finance Mobile App ( Android , iPhone & iPad and Windows 10)
| Symbol | Name | Volume | 90DAvgVol | %VolChg | Price | LClose | %Chg | Trades | Value |
|---|---|---|---|---|---|---|---|---|---|
| UBA | UNITED BANK FOR AFRICA PLC | 38.86M | 17.89M | 117.21 | 35.00 | 34.95 | 0.14 | 878 | 1.36B |
| WEMABANK | WEMA BANK PLC. | 26.62M | 7.31M | 264.13 | 15.10 | 13.75 | 9.82 | 455 | 400.03M |
| MTNN | MTN NIGERIA PLC | 14.69M | 4.30M | 241.23 | 250.00 | 240.00 | 4.17 | 721 | 3.61B |
| TRANSCORP | TRANSNATIONAL CORPORATION OF NIGERIA PLC | 7.43M | 3.30M | 124.86 | 46.25 | 45.70 | 1.20 | 332 | 343.13M |
| CUSTODIAN | CUSTODIAN AND ALLIED PLC | 5.29M | 2.54M | 108.51 | 18.00 | 18.00 | 0.00 | 63 | 95.25M |
Investment Insights - High Div. Stocks
Dividend stocks distribute a portion of the company earnings to investors on a regular basis and they can a great choice for investors looking for regular income. As an investment or trading strategy, high dividend yield equities provide annual cash payments as against mostly capital gains in the price of a stock. The list in the table below represent the highest dividend paying stocks from the list of the most liquid stocks in the NSE top 30.
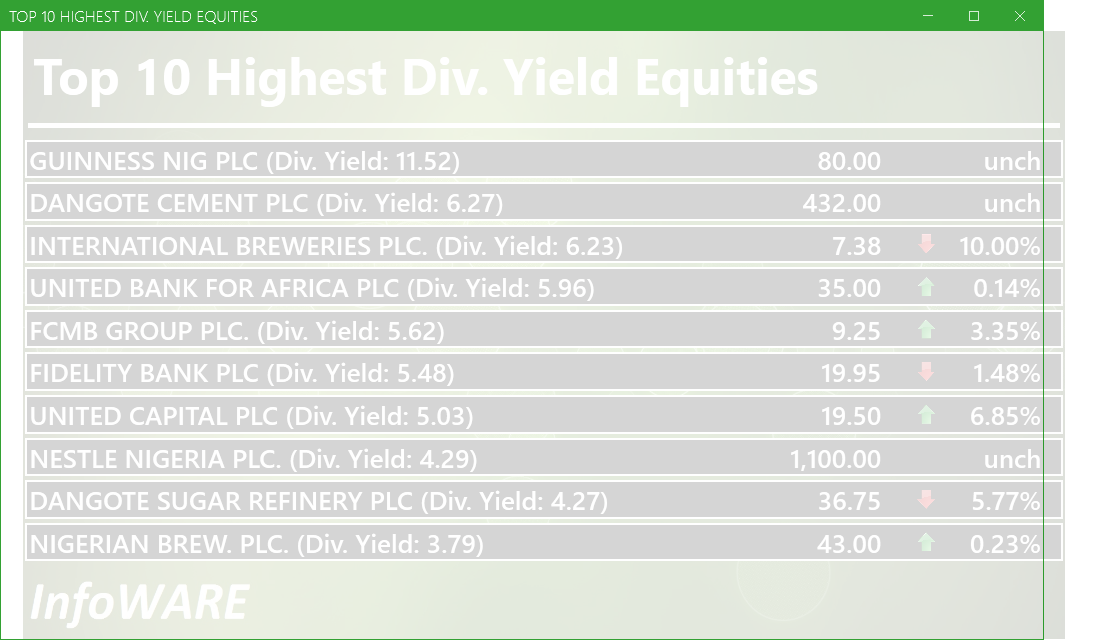
For more detailed analysis,
- On InfoWARE Market Data Terminal <HYIELD> <GO>
- On InfoWARE Finance Mobile App ( Android , iPhone & iPad and Windows 10) , "Research"
Investment Insights - Stocks outperforming the ASI but with approximately the same risk
These list of stocks represent equities that are less risky than the ASI but doing better than the ASI (All Shares Index) using the YTD (Year to Date) returns as the measure. The risk is measured by Beta. Beta is an assessment of a stock's tendency to undergo price changes, (its volatility), as well as its potential returns compared to the ASI. It is expressed as a ratio, where a score of 1 represents performance comparable to the ASI, and returns above or below the market may receive scores greater or lower than 1.
For a full list of both positively and negatively corelated stocks visit InfoWARE Market Data Terminal
- On InfoWARE Market Data Terminal <BANL> <GO>
- On InfoWARE Finance Mobile App ( Android , iPhone & iPad and Windows 10)
| Symbol | DivYield | PE | EPS | Beta | %ChgYTD | ASIYTDReturn | BetaDiff |
|---|---|---|---|---|---|---|---|
| HONYFLOUR | 1.40 | 16.28 | 0.31 | 0.99 | 87.86 | 2.54 | 0.01 |
| FIDELITYBK | 5.48 | 13.24 | 1.17 | 0.89 | 17.35 | 2.54 | 0.11 |
| NB | 3.79 | 16.95 | 1.60 | 0.79 | 34.38 | 2.54 | 0.21 |
| UNILEVER | 2.81 | 67.09 | 0.40 | 0.75 | 19.44 | 2.54 | 0.25 |
| VETGOODS | 0.00 | 0.71 | 15.41 | 2.54 | 0.29 | ||
| VETGRIF30 | 0.00 | 0.71 | 4.64 | 2.54 | 0.29 | ||
| ABBEYBDS | 1.43 | 0.00 | 0.00 | 0.70 | 176.67 | 2.54 | 0.30 |
| NEM | 6.52 | 24.99 | 0.37 | 0.69 | 16.67 | 2.54 | 0.31 |
| TANTALIZER | 1.50 | 0.00 | 0.00 | 0.69 | 3.56 | 2.54 | 0.31 |
| NAHCO | 6.66 | 92.98 | 0.41 | 0.65 | 56.25 | 2.54 | 0.35 |
African Markets
| Name | LClose | Change | %Chg |
|---|---|---|---|
| BRVM Stock Exchange | 287.27 | -0.60 | -0.21 |
| Botswana Stock Exchange | 10,233.06 | 5.11 | 0.05 |
| Egyptian Exchange | 31,855.12 | 215.15 | 0.68 |
Nigeria Market Indexes
| Symbol | LClose | %Chg | WTD% | MTD% | QTD% | YTD% | MktCap | Trades |
|---|---|---|---|---|---|---|---|---|
| ASI | 105,800.85 | -0.12 | -0.30 | 0.24 | 0.24 | 2.54 | 16,031 | |
| NGX30 | 3,924.19 | -0.16 | -0.44 | 0.13 | 0.13 | 2.87 | 8,786 | |
| NGXAFRBVI | 2,593.19 | -2.24 | -0.45 | -2.63 | -2.63 | 4.53 | 3,932 | |
| NGXAFRHDYI | 17,968.67 | 0.33 | 1.72 | 7.96 | 7.96 | 5.53 | 4,043 | |
| NGXASEM | 1,591.68 | 0.00 | 0.00 | 0.24 | 0.24 | 0.50 | 5 | |
| NGXBNK | 1,142.35 | -1.46 | -0.18 | -1.59 | -1.59 | 5.05 | 4,354 | |
| NGXCG | 3,020.85 | -0.56 | -0.06 | 0.35 | 0.35 | 6.77 | 8,818 | |
| NGXCNSMRGDS | 2,004.98 | -1.98 | -1.51 | 10.43 | 10.43 | 15.60 | 2,187 | |
| NGXCOMMDTY | 985.67 | 0.00 | 0.00 | -1.78 | -1.78 | -1.44 | ||
| NGXGROWTH | 7,400.95 | 0.13 | -0.12 | 0.12 | 0.12 | -4.66 | 116 | |
| NGXINDUSTR | 3,364.65 | 0.01 | 0.01 | -3.59 | -3.59 | -5.80 | 961 | |
| NGXINS | 673.97 | 0.87 | 0.32 | -0.93 | -0.93 | -14.27 | 1,205 | |
| NGXLOTUSISLM | 7,509.65 | 0.69 | -0.40 | -0.59 | -0.59 | 7.78 | 2,326 | |
| NGXMAINBOARD | 5,162.30 | -0.51 | -0.27 | 1.99 | 1.99 | 3.16 | 11,654 | |
| NGXMERIGRW | 7,368.51 | 0.71 | 0.70 | 7.41 | 7.41 | 12.96 | 2,260 | |
| NGXMERIVAL | 10,449.80 | -2.31 | -0.96 | 1.52 | 1.52 | 0.19 | 4,923 | |
| NGXOILGAS | 2,354.67 | 0.04 | 0.13 | -3.76 | -3.76 | -13.15 | 491 | |
| NGXPENBRD | 1,905.24 | 0.27 | 0.14 | 0.87 | 0.87 | 4.02 | 13,329 | |
| NGXPENSION | 4,948.61 | 0.01 | 0.30 | 3.39 | 3.39 | 9.14 | 9,994 | |
| NGXPREMIUM | 10,034.48 | 1.13 | 0.12 | -1.29 | -1.29 | 3.10 | 4,261 | |
| NGXSOVBND | 651.24 | 0.00 | 0.00 | 3.89 | 3.89 | 8.26 | 0 |
For more detailed analysis,
- On InfoWARE Market Data Terminal <MKTINS> <GO>
- On InfoWARE Finance Mobile App ( Android, iPhone & iPad and Windows 10) , "Market Indexes"
Find the topic interesting? Will like to comment? Contact Us at solutions@infowarelimited.com
Top News

Chart Of The Day - ASI Chart Vs ASI Advance Decline Line (YTD) (30-Apr-2025 15:07:14.535)
InfoWARE AI Analyst Daily Market Report: 30-Apr-2025

[ABBEYBDS]>>Notice of Meeting -<ABBEY MORTGAGE BANK PLC>
[XNSA]>> WORKERS DAY PUBLIC HOLIDAY NOTIFICATION: 01 MAY, 2025
[ETI]>>Corporate Disclosures-<ECOBANK TRANSNATIONAL INCORPORATED>
[SEPLAT]>>Corporate Disclosures-<SEPLAT ENERGY PLC>
[XNSA]>> RESIGNATION OF A DIRECTOR
[TOTAL]>>Corporate Disclosures-<TotalEnergies Marketing Nigeria Plc>
[NESTLE]>>Corporate Disclosures-<NESTLE NIGERIA PLC.>
[XNSA]>> CORDROS MILESTONE FUNDS' BID & OFFER PRICES
[XNSA]>> CLOSING GONG CEREMONY IN HONOUR OF DR. PASCAL G DOZIE, OON, CON
[NEWGOLD]>> DAILY INDICATIVE PRICES
[XNSA]>> EMERGING AFRICA DAILY MUTUAL FUND PRICES
[XNSA]>> DAILY FUND PRICE SUBMISSION - FCMB ASSET MANAGEMENT LIMITED
[XNSA]>> SUPPLEMENTARY LISTING - MULTI-TREX INTEGRATED FOODS PLC
[XNSA]>> NGX FIXED INCOME INDICATIVE PRICE LIST FOR APR 30, 2025
[LOTUSHAL15]>> DAILY INDICATIVE PRICES
[VETGOODS]>> DAILY INDICATIVE PRICES
[XNSA]>> WEMA BANK PLC: ACTIVATION OF CODE FOR TRADING IN RIGHTS
[UACN]>>Corporate Disclosures-<UAC OF NIGERIA PLC.>
[MEYER]>>Corporate Disclosures-<MEYER PLC>
[SIAMLETF40]>> DAILY INDICATIVE PRICES
[XNSA]>> NOTIFICATION OF PRICE ADJUSTMENT
[NEIMETH]>>Corporate Disclosures-<NEIMETH INTERNATIONAL PHARMACEUTICALS PLC>
[FCMB]>>Corporate Disclosures-<FCMB GROUP PLC>
Chart Of The Day - ASI Chart Vs ASI Advance Decline Line (YTD) (29-Apr-2025 15:06:46.508)
InfoWARE AI Analyst Daily Market Report: 29-Apr-2025
[VITAFOAM]>>Corporate Disclosures-<VITAFOAM NIG PLC.>
Breaking News! Unusual Volume Alert (29-Apr-2025 14:21:09.830)
Breaking News! Bulls Momentum Alert (29-Apr-2025 14:21:07.065)
Get IDIA - the stock trading app for the modern investor
Solutions by Business
Product Suites
Company
Contacts
- 8th Floor,
- South Atlantic Petroleum Towers,
- 1 Adeola Odeku Street,
- Victoria Island,
- Lagos, Nigeria.
- Email: solutions@infowarelimited.com
Follow Us
 |
 |
 |
 |