


InfoWARE AI Analyst Daily Market Report: 22-Jul-2025 | InfoWARE Finance
Get IDIA - the stock trading app for the modern investor


InfoWARE AI Analyst Daily Market Report: 22-Jul-2025
(Source: InfoWARE Terminal, Date: 22-Jul-2025)
Dear Investor,
NGX Daily Market Summary – Tuesday, July 22, 2025
The Nigerian Exchange (NGX) saw a 0.47% lift in the All Share Index (ASI), closing at 131,826.77, a healthy sign with YTD returns now sitting at an impressive 28.37%. Today’s trading session was marked by a notable surge in value traded—up by 27.50% to 24.77 billion Naira—suggesting renewed institutional interest and heightened activity in select sectors. Market breadth was tepid at 1.05x with 39 advancers to 37 decliners, indicating a modestly bullish undertone. Noteworthy moves were seen in DANGSUGAR (+10.00%), while TIP led the losers, down 9.97%. The day also witnessed a spike in volumes across 69 companies, reflected in some outsized moves for both institutional and retail favorites, especially in the banking and building materials sectors.
1. Significant Market Breadth Trends
- Market Breadth: Advancers slightly edged decliners at 1.05x. A balanced breadth, but with 69 stocks seeing volume upticks (vs. 73 with volume down), the momentum is fairly widespread, though not overwhelmingly bullish.
- Turnover Jump: Trading value up 27.5% from the previous session—reflects strong institutional entries or exits, especially with institutional investors accounting for 89.61% of total trade value.
- Volume Surge: Total volume up today (703.41M vs. 604.91M). This aligns with the increased value, reinforcing the presence of block trades and possible portfolio rebalancing.
2. Top Gainers and Losers – Daily Highlights
| Gainer | Price | % Change | RSI | MACD | Sector |
|---|---|---|---|---|---|
| DANGSUGAR | 56.10 | +10.00% | 65.70 | 2.56 | Consumer Goods |
| TIP | 12.13 | +9.97% | 80.28 ⚠️ | 0.96 | Industrial |
| VETGOODS | 32.75 | +9.90% | 99.23 🔥 | 1.44 | ETF |
| SOVRENINS | 1.34 | +9.84% | 47.27 | 0.05 | Insurance |
| ENAMELWA | 22.35 | +9.83% | 61.94 | -0.02 | Manufacturing |
| Loser | Price | % Change | RSI | MACD | Sector |
|---|---|---|---|---|---|
| VSPBONDETF | 575.00 | -17.86% | 71.95 | 32.83 | ETF |
| ELLAHLAKES | 9.90 | -10.00% | 65.99 | 1.57 | Agriculture |
| LEGENDINT | 5.31 | -10.00% | 38.17 | -0.47 | Tech/Internet |
| FTNCOCOA | 6.09 | -9.91% | 67.15 | 1.09 | Agriculture |
| MEYER | 17.05 | -9.79% | 64.33 | 3.09 | Building Materials |
- DANGSUGAR posted stellar gains with a breakout and shows robust momentum (RSI 65.7); not yet overbought, but caution as it's approaching those levels.
- VSPBONDETF reversed sharply today (-17.86%) but remains a YTD outperformer; bears are clearly seizing initiative short-term.
- TIP’s RSI hit 80.3—firmly in overbought territory; short-term traders should stay vigilant as reversal risks escalate.
- VETGOODS ETF extreme RSI at 99.2 signals a classic overextension—potential pullback ahead.
- ELLAHLAKES sees high negative price action and extremely high volume—a signal of strong capitulation or perhaps forced selling.
3. Insights, Patterns & Predictions
- Turnover Spike: +27.5% turnover signals fresh institutional positioning; such activity usually foreshadows directional moves in index-heavyweights (WAPCO, ACCESSCORP, ZENITHBANK).
- Advancers vs. Decliners: With advancers barely ahead, the rally is broad but lacks exuberance—investors are rotating, not chasing after everything.
-
Unusual Volume:
- WAPCO: Volume +777% above 90-day avg, price up 8.62%. Major institutional inflow (top institutional traded stock) likely.
- ELLAHLAKES: Volume +167.6% above average, -10.00% price. Extreme selloff, likely margin calls or panic selling—often a watchlist for mean-reversion traders.
- CONHALLPLC, WEMABANK, LEGENDINT: All printing >100% volume spikes, suggesting fresh interest or forced exits—watch for spill-over effects in related stocks.
-
Bullish Momentum Crossovers (above 15DMA):
- SOVRENINS (Insurance): Strong move above 15DMA with 8.96% gain. RSI 47.3 signals more room to run.
- LIVESTOCK: Also a 15DMA crossover, strong momentum, appears across both volume and price gainers’ lists.
- UPL and GREENWETF ETF showing up as fresh momentum buys.
-
Bearish Momentum Breakdowns (below 15DMA):
- MEYER and ELLAHLAKES: Both present in YTD loser table and now breaking down technically—investors should exercise caution unless playing for a technical rebound.
- UCAP, CUTIX, GUINEAINS, LASACO, REGALINS, HONYFLOUR: Trend in Insurance and Finance stocks seeing renewed pressure—likely institutions reallocating out of riskier microcaps.
-
Bullish & Bearish RSI Anomalies:
- VETGOODS, TIP: Outright overheating! May be primed for sharp corrections.
- LEGENDINT, MEYER: Bearish, but RSI not deeply oversold, suggesting selloff might not be done.
-
Watchlist: Overlaps
- TIP, VETGOODS: Appear in both top gainers and YTD momentum tables, but current RSI indicates caution—momentum could reverse at the first sign of profit-taking.
- MEYER, LEGENDINT: In both loss and momentum breakdown tables—bargain-hunting could soon begin if longer-term support holds.
4. Contrarian Signals
- VSPBONDETF: Despite a +76.92% 5-day surge, today's -17.86% collapse with an RSI 72 shows overheating—contrarians may eye for a tactical bounce but should wait for RSI to cool off.
- MEYER: Has a negative beta (-0.08), yet remains in strong downtrend. With a history of sharp rebounds, bottom-fishers could see bounce potential on any sign of capitulation.
- SOVRENINS: Crossed above 15DMA but RSI only mid-40s, not overbought—suggests room for continuation despite recent small-cap volatility.
5. Sector Heatmaps
| Sector | YTD Change | Top Mover | RSI Outlier | Institutional Flow | Technical |
|---|---|---|---|---|---|
| Banking | +24%~ | ZENITHBANK, UBA, ACCESSCORP | None extreme | High (WAPCO, UBA, ZENITHBANK heavily traded institutionally) | Mixed (ZENITHBANK slight pullback, but strong flows) |
| Building Materials | +35%~ | WAPCO +8.62% | WAPCO RSI mid-80s (very strong) | Very High | Bullish (breakouts + volume) |
| Insurance | Flat/Weak | SOVRENINS, CONHALLPLC | None extreme | Low | Mixed |
| Consumer Goods | +20%+ | DANGSUGAR | VETGOODS RSI 99, DANGSUGAR 65.7 | Stable | Uptrend |
| ETF | +50%+ | VETGOODS, VSPBONDETF | RSI 99, 72. Extreme overbought– correction risk imminent | Significant Retail Activity | Overheated |
| Agriculture | +10%+ | ELLAHLAKES | RSI ~66 | None Notable | Bearish (heavy vol, large selloff) |
| Tech/Internet | -14.3% YTD | LEGENDINT | RSI 38 (weak) | Unusual Volume spike | Bearish (downtrend) |
6. Dividend-Beta Matrix
| Stock | Dividend Yield | Beta | Risk/Defensive Note |
|---|---|---|---|
| SOVRENINS | 2.86% | 1.12 | High yield, moderate risk; actionable for income-focused traders seeking momentum. |
| REGALINS | 6.52% | 0.47 | Attractive yield, very low beta; could be a defensive pick unless the downtrend deepens. |
| UCAP | 5.03% | 0.74 | Solid yield and sub-1 beta—good for cautious investors; watch for a technical turnaround. |
| LASACO | 4.05% | 0.71 | Potential defensive play if price stabilizes. |
| ENAMELWA | 0.71% | 0.00 | Low beta, low yield; best for pure price speculators. |
→ Stocks like REGALINS and UCAP may appeal to yield-seeking investors in a turbulent market, with REGALINS offering both high yield and low beta—ideal for low-risk, income-focused strategies if technicals stabilize.
7. Institutional Clustering Alerts
- WAPCO: ~3.8% of institutional volume, 13.9% of trade value—clear institutional focus driving up price and volume.
- ACCESSCORP, ZENITHBANK, UBA: Heavy institutional presence, suggesting continued interest in banking sector bellwethers.
- ZENITHBANK: 3.18% of institutional volume, 6.53% of value. Defensive large-cap pick for institutions.
8. High Dividend Stocks in Bullish/Bearish Tables
- REGALINS (Bearish Table): Despite a standout yield (6.52%), price is breaking down. Danger of "dividend trap" where yield is high only due to falling price—vigilant monitoring needed.
- SOVRENINS (Bullish Table): Both high yield and bullish price action—an attractive dual-momentum play for both income and capital gain seekers.
- UCAP, LASACO (Bearish Table): Good yields, but short-term technical weakness; opportunistic entries possible on confirmed reversal signals.
9. Actionable Suggestions for Traders
- Momentum followers: Consider partial profits or tight trailing stops on overbought all-stars (VETGOODS, TIP). Look for emerging breakouts in stocks crossing above 15DMA (SOVRENINS, UPL, LIVESTOCK).
- Contrarians: Monitor oversold or high-volume washouts (ELLAHLAKES, LEGENDINT, MEYER). Do not catch falling knives unless you see signs of volume drying up and reversal confirmation.
- Income hunters: Watch for stabilization in REGALINS and UCAP for selective accumulation.
- Sector rotation strategists: Remain overweight on banking and building materials, where institutional flows are consistent.
- Risk warning: Avoid chasing ETFs with extreme RSI readings; these often reverse sharply with minimal liquidity for exits.
10. Top YTD Gainers and Losers (Tuesday Spotlight)
| Gainer | Symbol | Price | YTD Change | RSI | Comment |
|---|---|---|---|---|---|
| TIP | TIP | 12.13 | +385.20% | 80.28 | Potential exhaustion but huge momentum |
| ABCTRANS | ABCTRANS | 5.50 | +314.63% | 85.23 | Still hot, but risk of turn |
| REDSTAREX | REDSTAREX | 12.92 | +192.97% | 74.23 | RSI suggests caution |
| Loser | Symbol | Price | YTD Change | RSI | Comment |
|---|---|---|---|---|---|
| LEGENDINT | LEGENDINT | 5.31 | -14.35% | 38.17 | Bearish, volume spike—a capitulation? |
| DEAPCAP | DEAPCAP | 1.20 | 0.83% | 50.87 | Tepid |
| UNIONDICON | UNIONDICON | 10.00 | +38.89% | 57.42 | Not deeply oversold; more downside? |
11. Market Activity & Trade Summary Analysis
-
Institutional vs. Retail Domination:
- Institutional: 39.8% of trade count, but a commanding 67.97% of the volume and 89.61% of the trade value.
- Retail: 60.2% of trade count, but only 32.03% of volume and 10.39% of value—suggests retail playing in smaller lots, mostly in less volatile/cheaper names.
-
Top 5 Institutional Trades:
- WAPCO (Building Materials): 29.6M shares, +8.62% price. Strong sector re-rating and institutional clustering.
- ACCESSCORP, ZENITHBANK, UBA: Banks remain institutional darlings, indicating sectoral faith. Banking sector likely to remain resilient.
- ARADEL (Oil & Gas): Emerging interest—watch for cross-sector spillovers.
-
Top 5 Retail Trades:
- ACCESSCORP, GTCO, UBA, ZENITHBANK, MTNN: Retail traders are increasingly gravitating towards large liquid lenders and telecom blue chips. This overlap with institutional focus means retail is "swimming with the whales”—usually a trend confirmation signal.
- Hidden Insight: Both retail and institutions are doubling down on the same banking giants. When this happens with a rising value traded, it strongly suggests that both short-term (retail) and longer-term (institutional) investors see value or short-term momentum in these names. Expect further range expansion or directional moves in these "bellwether” stocks.
12. Key Insights & Competitive Edge Takeaways
- Institutional clustering—especially in Building Materials and Banks—heralds further upside for sector leaders like WAPCO and ZENITHBANK.
- Extreme RSI readings (over 80 in TIP, VETGOODS, etc.) almost always precede pullbacks; nimble traders should lock in gains, while patient investors might wait for a shakeout before entering.
- Unusual volume and price collapses (ELLAHLAKES, LEGENDINT) often signal large holders exiting—avoid until volatility subsides.
- Yield + Stability: REGALINS, UCAP, SOVRENINS for defensive positioning, but only if price finds support.
- Bullish 15DMA Crossovers: Early signals for swing trades—watch SOVRENINS, LIVESTOCK.
Summary for Traders
- Momentum: Trail profits on overbought winners (TIP, VETGOODS).
- Bounce Watching: Don’t try to catch falling knives in heavy decliners until you see stabilization.
- Sector Focus: Stay engaged with sector-leaders (Banks, Cement, Building Materials) where both retail and institutional flows are aligned.
- Defensive Allocation: Blend high-yield/low-beta names into portfolios, but avoid those in technical downtrends until reversal clues emerge.
Data as of July 22, 2025. All numbers subject to final NGX reconciliation.
|
Top ASI Gainers Over Last 5 Trading Days
|
Top ASI Losers Over Last 5 Trading Days
|
For more detailed analysis, on InfoWARE Market Data Terminal <NSEPERF> <GO>
On InfoWARE Finance Mobile App (Android, iPhone & iPad, Windows Phone and Windows 8/10), "Top Gainers & Losers"
DANGOTE SUGAR REFINERY PLC (DANGSUGAR) topped the advancers list closing at N56.10 with a gain of 10.00% followed by THE INITIATES PLC (TIP) which closed at N12.13 with a gain of 9.97%.
On the flip side VETIVA S & P NIGERIA SOVEREIGN BOND ETF (VSPBONDETF) and ELLAH LAKES PLC. (ELLAHLAKES) topped the decliners log with a loss of -17.86% at a close of N575.00, and -10.00% to close the day at N9.90 respectively.
| Symbol | LClose | %Chg |
|---|---|---|
| DANGSUGAR | 56.10 | 10.00 |
| TIP | 12.13 | 9.97 |
| VETGOODS | 32.75 | 9.90 |
| SOVRENINS | 1.34 | 9.84 |
| ENAMELWA | 22.35 | 9.83 |
| Symbol | LClose | %Chg |
|---|---|---|
| VSPBONDETF | 575.00 | -17.86 |
| ELLAHLAKES | 9.90 | -10.00 |
| LEGENDINT | 5.31 | -10.00 |
| FTNCOCOA | 6.09 | -9.91 |
| MEYER | 17.05 | -9.79 |
For more detailed analysis,
- On InfoWARE Market Data Terminal <TOPG> <GO>
- On InfoWARE Finance Mobile App ( Android, iPhone & iPad and Windows 10) , "Top Gainers & Losers"
Currency Market
In the currency market, the Naira was unchanged against the dollar at 1 to 1NSE: Bull Signal - Price crossed above 15 Day MA
This signal implies these stocks are under buying pressure and the price might continue to rise and therefore positions should be monitored closely. Further suggested analysis include looking at the overall market (ASI) to see if the uptrend is market wide, sector wide or specific to the stock. Portfolio managers tend to use this as a signal to do more research to add to their positions or lock in some profits. Typically further analysis should be done using commands like PC and RV on the InfoWARE Market Data Terminal. Another command is ALERTS to set price triggers for possible exit or entry as necessary
For more detailed analysis,
- On InfoWARE Market Data Terminal <NSEPERF> <GO>
- On InfoWARE Finance Mobile App ( Android , iPhone & iPad and Windows 10) , "Top Gainers & Losers"
| Symbol | Price | %Chg | 15DMA | PE | EPS | DivY | MktCap | Vol | Trades | Value | LstTradeTime |
|---|---|---|---|---|---|---|---|---|---|---|---|
| SOVRENINS | 1.34 | 8.96 | 1.33 | 27.95 | 0.03 | 3.75 | 15.23B | 3.44M | 92.00 | 4.60M | 22-Jul-2025 14:30:51.757 |
| UPL | 6.15 | 8.94 | 5.97 | 7.13 | 0.59 | 0.60 | 2.65B | 604.46K | 69.00 | 3.60M | 22-Jul-2025 14:30:53.747 |
| LIVESTOCK | 9.60 | 6.25 | 9.16 | 0.00 | 0.00 | 2.94 | 28.80B | 3.24M | 248.00 | 31.39M | 22-Jul-2025 14:30:48.273 |
| GREENWETF | 220.00 | 0.00 | 216.68 | 0.00 | 0.00 | 0.00 | 0.00 | 0.00 | 22-Jul-2025 14:31:53.443 |
NSE: BEAR Signal - Price crossed below 15 Day MA
This signal implies these stocks are under selling pressure and the price might continue to slide and therefore positions should be monitored closely. Further suggested analysis include looking at the overall market (ASI) to see if the downtrend is market wide, sector wide or specific to the stock. If the overal market trend is upwards, then since these stocks are heading in the opposite direction, then further analysis should be done using commands like PC and RV on the InfoWARE Market Data Terminal. Another command is ALERTS to set price triggers for possible exit is necessar
For more detailed analysis,
- On InfoWARE Market Data Terminal <BEARM> <GO>
- On InfoWARE Finance Mobile App ( Android , iPhone & iPad and Windows 10)
| Symbol | Price | %Chg | 15DMA | PE | EPS | DivY | MktCap | Vol | Trades | Value | LstTradeTime |
|---|---|---|---|---|---|---|---|---|---|---|---|
| UNIONDICON | 10.00 | 0.00 | 10.11 | 0.00 | 0.00 | 6.25 | 2.73B | 99.26K | 21.00 | 991.28K | 22-Jul-2025 14:30:53.243 |
| UCAP | 20.40 | -0.25 | 20.53 | 19.15 | 0.93 | 5.03 | 122.40B | 7.61M | 288.00 | 156.78M | 22-Jul-2025 14:30:53.087 |
| CAVERTON | 7.00 | -1.29 | 7.05 | 1.15 | 1.57 | 5.52 | 23.45B | 3.48M | 235.00 | 24.24M | 22-Jul-2025 14:30:38.857 |
| CUTIX | 4.00 | -1.75 | 4.01 | 8.81 | 0.26 | 6.52 | 14.09B | 12.02M | 410.00 | 49.32M | 22-Jul-2025 14:30:39.220 |
| GUINEAINS | 0.99 | -2.02 | 1.01 | 66.79 | 0.01 | 1.96 | 6.08B | 3.88M | 113.00 | 3.79M | 22-Jul-2025 14:30:40.683 |
| LASACO | 3.07 | -2.93 | 3.13 | 21.56 | 0.11 | 4.05 | 5.63B | 1.29M | 91.00 | 3.97M | 22-Jul-2025 14:30:48.013 |
| REGALINS | 0.77 | -5.19 | 0.81 | 4.35 | 0.11 | 6.52 | 5.13B | 14.10M | 106.00 | 10.82M | 22-Jul-2025 14:30:51.397 |
| HONYFLOUR | 26.25 | -6.10 | 26.59 | 16.28 | 0.31 | 1.40 | 208.17B | 4.86M | 493.00 | 133.45M | 22-Jul-2025 14:30:47.573 |
| TANTALIZER | 2.70 | -8.15 | 2.74 | 0.00 | 0.00 | 1.50 | 8.67B | 3.44M | 146.00 | 10.01M | 22-Jul-2025 14:30:52.293 |
| NEWGOLD | 52,001.00 | -9.61 | 54,327.67 | 0.00 | 0.00 | 0.00 | 0.00 | 5.00 | 1.00 | 260.01K | 22-Jul-2025 14:31:53.570 |
| MEYER | 17.05 | -10.85 | 18.11 | 0.00 | 0.00 | 3.91 | 9.06B | 551.43K | 57.00 | 9.69M | 22-Jul-2025 14:30:48.780 |
| ELLAHLAKES | 9.90 | -11.11 | 10.06 | 0.00 | 0.00 | 0.00 | 19.80B | 56.73M | 869.00 | 586.40M | 22-Jul-2025 14:30:39.783 |
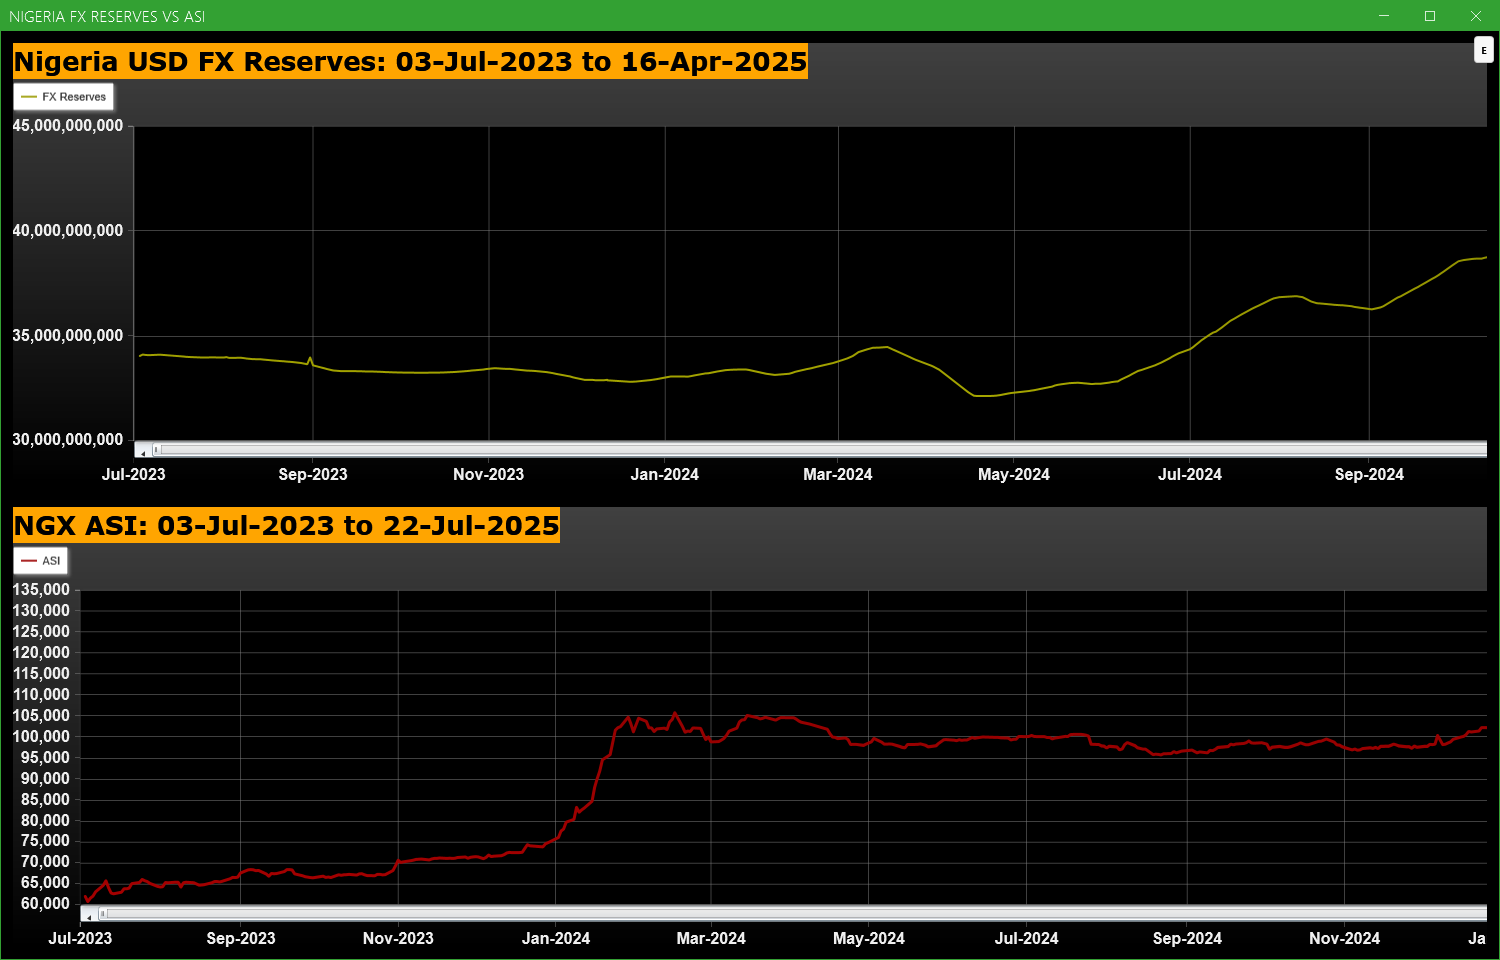
Economic Indicators - Nigeria FX Reserves Vs ASI Chart
Nigeria FX Reserves are assets held on reserve by CBN in foreign currencies. These reserves are used to back liabilities and influence monetary policy. Given the nature of the Nigeria economy, FX Reserves can appear to have an outsize influence on the economy and hence on the capital market. The chart below allows comparison of FX Reserves against the ASI to make investment decisions
For more detailed analysis,
- On InfoWARE Market Data Terminal <CI> <GO>
- On InfoWARE Finance Mobile App ( Android , iPhone & iPad and Windows 10) , "Research"
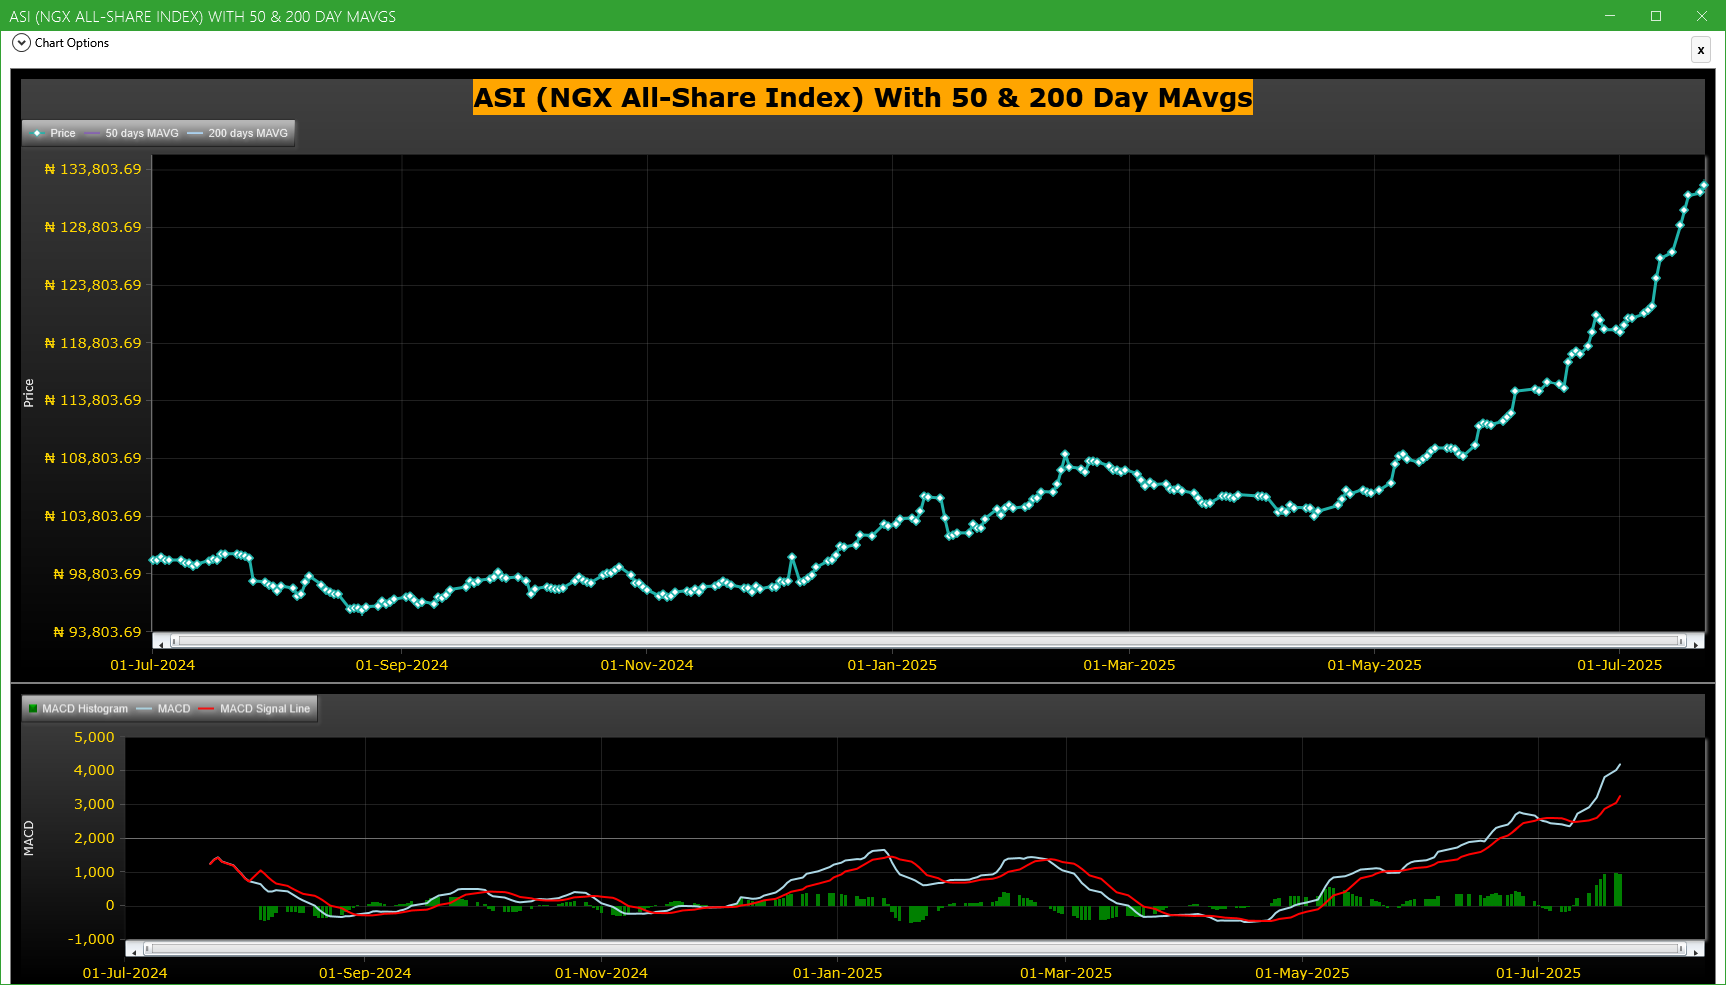
Market Trend - ASI (NGX All-Share-Index) With 50 & 200 Day MAvgs Chart
Technical traders typically use the 50 & 200 day moving averages to aid in choosing
where to enter or exit a position, which then causes these levels to act as strong
support or resistance. As a general guideline, if the price is above a moving average,
the trend is up. If the price is below a moving average, the trend is down.
It is important to note that critics of technical analysis say that moving averages act
as support and resistance because so many traders use these indicators to inform their
trading decisions. Also moving averages tend to work quite well in strong trending conditions
but poorly in choppy or ranging conditions.
Trading Strategies: Crossovers
Crossovers are one of the main moving average strategies. The first type is a price crossover,
which is when the price crosses above or below a moving average to signal a potential change
in trend. Another strategy is to apply two moving averages to a chart: one longer and one
shorter. When the shorter-term MA crosses above the longer-term MA, it is a buy signal, as
it indicates that the trend is shifting up. This is known as a golden cross. Meanwhile, when
the shorter-term MA crosses below the longer-term MA, it is a sell signal, as it indicates that
the trend is shifting down. This is known as a dead/death cross
For more detailed analysis,
- On InfoWARE Market Data Terminal <CI> <GO>
- On InfoWARE Finance Mobile App ( Android , iPhone & iPad and Windows 10) , "Research"
Unusual Volume: Volume traded is more than double the 90 day moving average (All exchanges; ASI & ASem). For more detailed analysis,
- On InfoWARE Market Data Terminal <UV> <GO>
- On InfoWARE Finance Mobile App ( Android , iPhone & iPad and Windows 10)
| Symbol | Name | Volume | 90DAvgVol | %VolChg | Price | LClose | %Chg | Trades | Value |
|---|---|---|---|---|---|---|---|---|---|
| ELLAHLAKES | ELLAH LAKES PLC. | 56.73M | 21.20M | 167.64 | 9.90 | 11.00 | -10.00 | 869 | 586.40M |
| WAPCO | LAFARGE WAPCO PLC. | 30.53M | 3.48M | 777.20 | 126.00 | 116.00 | 8.62 | 1,183 | 3.87B |
| CONHALLPLC | CONSOLIDATED HALLMARK INSURANCE PLC | 24.95M | 5.65M | 341.63 | 3.00 | 3.02 | -0.66 | 383 | 75.26M |
| WEMABANK | WEMA BANK PLC. | 20.86M | 7.75M | 169.20 | 17.95 | 17.10 | 4.97 | 515 | 371.61M |
| LEGENDINT | LEGEND INTERNET PLC | 14.46M | 5.19M | 178.60 | 5.31 | 5.90 | -10.00 | 242 | 79.13M |
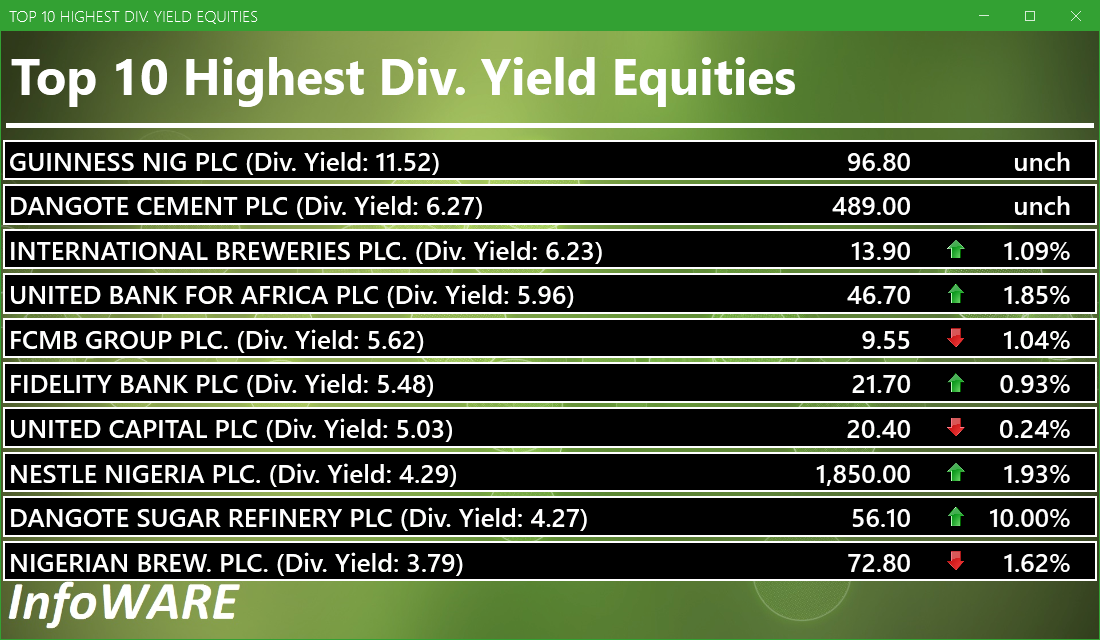
Investment Insights - High Div. Stocks
Dividend stocks distribute a portion of the company earnings to investors on a regular basis and they can a great choice for investors looking for regular income. As an investment or trading strategy, high dividend yield equities provide annual cash payments as against mostly capital gains in the price of a stock. The list in the table below represent the highest dividend paying stocks from the list of the most liquid stocks in the NSE top 30.
For more detailed analysis,
- On InfoWARE Market Data Terminal <HYIELD> <GO>
- On InfoWARE Finance Mobile App ( Android , iPhone & iPad and Windows 10) , "Research"
African Markets
| Name | LClose | Change | %Chg |
|---|---|---|---|
| BRVM Stock Exchange | 306.95 | 0.61 | 0.20 |
| Botswana Stock Exchange | 10,430.23 | 2.09 | 0.02 |
| Egyptian Exchange | 33,821.03 | 348.12 | 1.04 |
| Ghana Stock Exchange | 6,386.76 | -50.86 | -0.79 |
| Johannesburg Stock Exchange | 98,687.06 | 1,333.74 | 1.37 |
| Lusaka Stock Exchange | 20,943.18 | 281.01 | 1.36 |
| Casablanca Stock Exchange | 19,168.83 | 246.00 | 1.30 |
| Malawi Stock Exchange | 367,465.79 | 0.00 | 0.00 |
| Nigeria Stock Exchange | 131,585.66 | 1,302.83 | 1.00 |
| Nairobi Securities Exchange | 157.93 | 0.14 | 0.09 |
| Namibian Stock Exchange | 1,803.03 | 28.57 | 1.61 |
| Rwanda Stock Exchange | 150.43 | 0.00 | 0.00 |
| Tunis Stock Exchange | 11,796.33 | 8.25 | 0.07 |
Nigeria Market Indexes
| Symbol | LClose | %Chg | WTD% | MTD% | QTD% | YTD% | MktCap | Trades |
|---|---|---|---|---|---|---|---|---|
| ASI | 132,451.73 | 0.47 | 0.47 | 10.62 | 10.62 | 28.37 | 29,614 | |
| NGX30 | 4,863.59 | 0.46 | 0.46 | 2.96 | 2.96 | 27.49 | 15,620 | |
| NGXAFRBVI | 3,614.36 | 0.60 | 0.60 | 2.00 | 2.00 | 45.69 | 6,348 | |
| NGXAFRHDYI | 22,500.02 | 0.86 | 0.86 | 7.58 | 7.58 | 32.14 | 7,011 | |
| NGXASEM | 1,446.38 | 0.00 | 0.00 | -9.32 | -9.32 | -8.67 | 7 | |
| NGXBNK | 1,532.14 | 0.12 | 0.12 | 1.41 | 1.41 | 40.90 | 7,069 | |
| NGXCG | 4,034.94 | 0.32 | 0.32 | 17.34 | 17.34 | 42.62 | 15,004 | |
| NGXCNSMRGDS | 2,834.21 | 0.50 | 0.50 | -18.29 | -18.29 | 63.42 | 3,785 | |
| NGXCOMMDTY | 1,061.06 | -0.70 | -0.70 | 1.32 | 1.32 | 6.10 | ||
| NGXGROWTH | 9,487.07 | -0.98 | -0.98 | -0.24 | -0.24 | 22.21 | 257 | |
| NGXINDUSTR | 4,580.53 | 2.87 | 2.87 | 30.02 | 30.02 | 28.25 | 3,699 | |
| NGXINS | 861.56 | 0.25 | 0.25 | 16.65 | 16.65 | 9.59 | 1,944 | |
| NGXLOTUSISLM | 10,528.23 | 1.18 | 1.18 | 9.96 | 9.96 | 51.10 | 5,433 | |
| NGXMAINBOARD | 6,355.49 | 0.40 | 0.40 | 7.74 | 7.74 | 27.01 | 21,680 | |
| NGXMERIGRW | 9,282.80 | 0.20 | 0.20 | -3.83 | -3.83 | 42.30 | 3,631 | |
| NGXMERIVAL | 13,558.19 | 1.61 | 1.61 | 13.48 | 13.48 | 29.99 | 8,869 | |
| NGXOILGAS | 2,399.57 | -1.04 | -1.04 | 0.31 | 0.31 | -11.49 | 423 | |
| NGXPENBRD | 2,429.23 | 0.45 | 0.45 | 5.65 | 5.65 | 32.63 | 23,290 | |
| NGXPENSION | 6,518.78 | 0.02 | 0.02 | 2.58 | 2.58 | 43.77 | 17,674 | |
| NGXPREMIUM | 13,346.70 | 0.62 | 0.62 | 16.36 | 16.36 | 37.13 | 7,677 | |
| NGXSOVBND | 665.26 | 0.00 | 0.00 | 1.80 | 1.80 | 10.59 | 0 |
For more detailed analysis,
- On InfoWARE Market Data Terminal <MKTINS> <GO>
- On InfoWARE Finance Mobile App ( Android, iPhone & iPad and Windows 10) , "Market Indexes"
Find the topic interesting? Will like to comment? Contact Us at solutions@infowarelimited.com
Top News

Chart Of The Day - ASI Chart Vs ASI Advance Decline Line (YTD) (22-Jul-2025 15:07:40.102)
InfoWARE AI Analyst Daily Market Report: 22-Jul-2025

[VSPBONDETF]>> DAILY INDICATIVE PRICES
[XNSA]>> CORDROS MILESTONE FUNDS' BID & OFFER PRICES
[MERGROWTH]>> DAILY INDICATIVE PRICES
[XNSA]>> NGX FIXED INCOME INDICATIVE PRICE LIST FOR JUL 22, 2025
[AIRTELAFRI]>>Corporate Disclosures-<Airtel Africa Plc>
[ETERNA]>>Notice of Meeting -<ETERNA PLC.>
[GUINNESS]>>Notice of Meeting -<GUINNESS NIG PLC>
[JAIZBANK]>>Notice of Meeting -<JAIZ BANK PLC>
[STANBICETF30]>> DAILY INDICATIVE PRICES
CSL Nigeria Daily - 22 July 2025
LAFARGE AFRICA - H1 2025 QUICK TAKE

Daily Business News Brief
Chart Of The Day - ASI Chart Vs ASI Advance Decline Line (YTD) (21-Jul-2025 15:20:48.618)
InfoWARE Analyst Daily Market Report (21-Jul-2025 15:20:43.582)
[XNSA]>> DAILY FUND PRICE SUBMISSION - FCMB ASSET MANAGEMENT LIMITED
[XNSA]>> NGX FIXED INCOME INDICATIVE PRICE LIST FOR JULY 21, 2025
Breaking News! Unusual Volume Alert (21-Jul-2025 13:21:15.597)
Breaking News! Bulls Momentum Alert (21-Jul-2025 13:21:15.019)
Breaking News! Bears Momentum Alert (21-Jul-2025 13:21:14.900)
InfoWARE Analyst Daily Market Report (21-Jul-2025 13:21:14.317)
[ENAMELWA]>>Corporate Disclosures-<NIGERIAN ENAMELWARE PLC.>
[WAPIC]>>Notice of Meeting -<CORONATION INSURANCE PLC>
[XNSA]>> CORDROS MILESTONE FUNDS' BID & OFFER PRICES
[MERGROWTH]>> DAILY INDICATIVE PRICES
[XNSA]>> NEW BOND LISTING CRANEBURG EKSG MOTORWAY COMPANY PLC
[OANDO]>>Notice of Meeting -<OANDO PLC>
[OANDO]>>Notice of Meeting -<OANDO PLC>
[AIRTELAFRI]>>Corporate Disclosures-<Airtel Africa Plc>
Get IDIA - the stock trading app for the modern investor
Solutions by Business
Product Suites
Company
Contacts
- 8th Floor,
- South Atlantic Petroleum Towers,
- 1 Adeola Odeku Street,
- Victoria Island,
- Lagos, Nigeria.
- Email: solutions@infowarelimited.com
Follow Us
 |
 |
 |
 |