


InfoWARE AI Analyst Daily Market Report: 28-Jul-2025 | InfoWARE Finance
Get IDIA - the stock trading app for the modern investor


InfoWARE AI Analyst Daily Market Report: 28-Jul-2025
(Source: InfoWARE Terminal, Date: 28-Jul-2025)
Dear Investor,
NGX Daily Market Wrap
Monday, July 28, 2025Market Overview
The NGX All Share Index (ASI) started the week on a positive note, rising 0.53% to close at 134,452.93, building on its impressive 31.00% YTD return. Despite a marginal 0.05% dip in turnover, trading activity surged with volumes jumping 18.35% compared to the previous session. Advancers outpaced decliners 47 to 28 (breadth 1.68x), underlining persistent bullish sentiment. Notably, GREENWICH ASSET ETF (GREENWETF) led the gainers, soaring 10.00%, while ACADEMY PRESS PLC. (ACADEMY) reversed course as the worst performer, tumbling 9.99% after a massive recent rally.
Last Week in Review
Last week’s robust performance spilled into today’s session, with the market sustaining its uptrend as heavyweights and momentum stocks continued to attract institutional interest. Volatility remains high in select momentum names—particularly those in financials, brewers, and packaging—while investors persist in rotating towards sectors with earnings resilience and technical breakouts.
Market Breadth & Key Trends
- Advancers vs. Decliners: 47 advancers vs 28 decliners (1.68x breadth)—bullish follow-through from last week as more than half the market moved higher.
- Volume Action: Traded volume increased for 67 companies versus 74 decliners in volume, suggesting select buying while turnover value was flat (-0.05%).
- Unusual Volumes: Five stocks—FIDELITYBK (+115%), ROYALEX (+125%), NSLTECH (+195%), INTBREW (+111%), SOVRENINS (+143%)—saw volumes at least double their 90-day average, signaling fresh interest and potentially emerging trends.
- Sector Rotation: Financials, brewers, and select insurance saw aggressive accumulation; ETF and some consumer names saw profit-taking and corrections.
Top Performers: Gainers & Losers
Today's Top 5 Gainers:| Stock | Price | Chg (%) | RSI | MACD | Beta |
|---|---|---|---|---|---|
| GREENWETF | 266.20 | +10.00 | 44.5 | -25.52 | 0.83 |
| ACADEMY | 10.24 | +9.99 | 73.2 | 0.86 | 0.45 |
| CHAMPION | 13.55 | +9.98 | 56.6 | 0.74 | 0.16 |
| TRIPPLEG | 3.86 | +9.97 | 57.0 | 0.46 | 0.60 |
| MAYBAKER | 18.80 | +9.94 | 56.2 | 0.58 | 0.78 |
| Stock | Price | Chg (%) | RSI | MACD | Beta |
|---|---|---|---|---|---|
| LIVESTOCK | 8.10 | -10.00 | 49.6 | 0.07 | 0.46 |
| TIP | 14.52 | -9.98 | 92.4 | 1.75 | 0.00 |
| ELLAHLAKES | 8.91 | -9.08 | 56.3 | 1.08 | 0.32 |
| NEWGOLD | 52,100 | -6.63 | 51.2 | 108.6 | 0.23 |
| NGXGROUP | 75.00 | -6.02 | 87.7 | 9.33 | 0.31 |
- ACADEMY: Surging RSI (73.2, overbought), but a sharp -9.99% drop after recent huge gains. Caution: Pullback could extend if momentum fades.
- TIP & NGXGROUP: Very high RSI (>87) and price decline—potential short-term exhaustion.
- CHAMPION, TRIPPLEG, MAYBAKER: Gains supported by rising RSI and positive MACD—momentum has not yet overheated.
- LIVESTOCK: Continues YTD slide, -10% today, remains on the YTD losers list.
YTD Top 5 Gainers & Losers
| Stock | Price | 5Dys % | YTD % | RSI | DivY | Beta |
|---|---|---|---|---|---|---|
| ACADEMY | 9.31 | 32.99 | 225.08 | 73.2 | 3.51 | 0.45 |
| FTNCOCOA | 7.24 | 16.67 | 272.34 | 66.8 | 1.60 | 0.79 |
| INTBREW | 15.20 | 18.25 | 194.55 | 68.2 | 6.23 | 1.04 |
| UACN | 54.95 | 20.80 | 83.31 | 98.4 | 1.00 | 0.53 |
| UNILEVER | 68.20 | 16.94 | 101.39 | 98.2 | 2.81 | 0.75 |
| Stock | Price | 5Dys % | YTD % | RSI | DivY | Beta |
|---|---|---|---|---|---|---|
| VSPBONDETF | 320.00 | -39.05 | -8.57 | 47.1 | 0.00 | -3.08 |
| LIVESTOCK | 9.00 | -15.63 | -10.00 | 49.6 | 2.94 | 0.46 |
| HMCALL | 4.30 | -8.51 | -11.70 | 44.6 | 0.00 | -0.74 |
| JOHNHOLT | 8.10 | -10.00 | 3.98 | 47.3 | 1.25 | 0.90 |
| NSLTECH | 0.92 | -13.59 | 28.99 | 53.0 | 15.87 | 0.68 |
- ACADEMY, INTBREW, FTNCOCOA—Top YTD momentum names, with very high RSI. Correction risk increases; traders should monitor for exhaustion or reversal.
- LIVESTOCK—Persistently negative YTD (-10.0%), also top loser today; momentum is weak.
- JOHNHOLT & NSLTECH stand out for their volatility and swings between loss and recovery.
Bullish & Bearish Momentum Plays
- CHAMPION: ↑9.08%, Price above 15DMA; MACD remains positive. RSI low 50s—trend has more room before overbought territory.
- TRIPPLEG: ↑9.07%, price action supported by bullish crossover; not yet overbought (RSI 57).
- ROYALEX: ↑8.76%, marked by unusual volume (+126%), positive momentum and close above 15DMA.
- DAARCOMM, RTBRISCOE, LEGENDINT: All showing strong closing above 15DMA amid high volume and price appreciation; some have attractive dividend yield (e.g., ROYALEX 7.81%).
- HONYFLOUR, REDSTAREX: Flat to slightly negative, as price dips below 15DMA.
- NEWGOLD: Large decline today (-6.63%), price now well below 15DMA—ETF outflow risk; RSI at 51 (neutral, but momentum suggests further downside possible).
- TRANSCORP, CUTIX: Now in corrective mode, price dipping below recent averages, signaling cooling sentiment.
Contrarian Signals
- CHAMPION: RSI is mid-50s (not overbought), but MACD is bullish and the stock jumped 9.98% today despite a -9.8% YTD performance—a classic "turnaround” setup. This may attract short-term momentum traders watching for reversals from YTD laggards.
- TIP, NGXGROUP: Overbought RSI (>87), but suffered sharp daily declines. Caution: Quick pullbacks may be imminent—a setup for short-term mean reversion.
- NSLTECH: Extreme volume and still negative price change today, with YTD performance swinging into the positive. Indicates speculative churn or accumulation at lows.
Sector Heatmaps
| Sector | Advancers | Decliners | Net Change | Notables |
|---|---|---|---|---|
| Financials | 13 | 5 | +8 | FIDELITYBK (↑21M shares), ZENITHBANK (Trading, institutional focus) |
| Insurance | 5 | 3 | +2 | SOVRENINS (Unusual volume, up 9.55%), ROYALEX (Unusual volume, ↑8.76%) |
| Brewers | 2 | 1 | +1 | INTBREW (YTD gainer, unusual volume), CHAMPION (Bullish turnaround) |
| Packaging | 1 | 0 | +1 | TRIPPLEG (Top gainer, momentum play) |
| ETF / Bonds | 1 | 2 | -1 | Profit-taking in NEWGOLD and VSPBONDETF |
| Others | 5 | 4 | +1 | DAARCOMM, LEGENDINT (momentum, volume moves) |
Dividend-Beta Matrix (Defensive Opportunities)
| Stock | Dividend Yield (%) | Beta | Momentum Status |
|---|---|---|---|
| ROYALEX | 7.81 | 0.96 | Bullish (above 15DMA) |
| ETI | 2.00 | 0.39 | Bullish (above 15DMA) |
| AFRIPRUD | 1.27 | 0.64 | — |
| NNFM | 1.44 | 0.27 | Neutral |
| REDSTAREX | 6.12 | 0.21 | Bearish (below 15DMA) |
| CUTIX | 6.52 | 0.70 | Bearish (below 15DMA) |
Insight: High dividend/Low beta stocks currently showing bullish momentum (e.g., ROYALEX, ETI) offer relatively defensive upside for income-seeking investors, while those in bearish momentum (REDSTAREX, CUTIX) warrant monitoring for potential mean-reversion.
Institutional Clustering Alerts
- ZENITHBANK: Institutional investors dominated value traded (over 20% of total institutional trade value).
- OKOMUOIL: Nearly 90% of today's trading by institutions; price flat but high value turnover—watch for accumulation signs.
- DANGCEM: Accounted for N1.36B in institutional trades, steady price, potential for further big block moves.
- ACCESSCORP: Traded by both retail and institutional segments but institutional trade value far exceeds retail. Heavy flows often precede bigger moves.
Market Activity & Trade Summary Insights
- Institutional vs Retail: Institutions drove 64.2% of total volumes and 86.5% of trade value despite just 8% of total trade count (3,088 of 35,586). Institutions focused their firepower on high-value/capitalization banks and blue chips (especially ZENITHBANK, OKOMUOIL, DANGCEM, ACCESSCORP, UBA).
- Top 5 Most Traded (Institutional): OKOMUOIL, ACCESSCORP, ZENITHBANK, DANGCEM, UBA.
-
Top 5 Most Traded (Retail): ACCESSCORP, UBA, ZENITHBANK, GTCO, MTNN.
Note: Overlap in ACCESSCORP, ZENITHBANK, UBA points to broad-based trading interest; watch for possible "follow the flow” effects or post-trade volatility. - Volume/Trade Count Disparity: Retail trades are 59.9% of deals but only 13.5% of daily traded value—points to institutional dominance in the market’s direction for now.
- Unusual volume stocks like FIDELITYBK, ROYALEX (also bullish above 15DMA), and INTBREW (momentum YTD gainer) deserve further monitoring for new trend formation or institutional positioning.
Hidden Insights & Tactical Suggestions
- Watch for consolidation or pullback in overheated YTD gainers—especially those with high RSI (e.g., ACADEMY, FTNCOCOA, INTBREW).
- Monitor "momentum upgrades" (stocks just crossing above 15DMA): CHAMPION, TRIPPLEG, ROYALEX, RTBRISCOE are actionable for swing traders, particularly with supporting volume surges.
- Defensive/high dividend bets showing momentum: ROYALEX (7.8% yield), ETI (2%)—possible core holdings for cautious bulls.
- Overbought/contrarian short-term plays: Consider mean reversion shorts in TIP, NGXGROUP (both have RSI >87 and suffered losses).
- Bears with high dividend yields (e.g., REDSTAREX, CUTIX, CUTIX): Wait for reversal/baselining signals before considering entry for income strategies.
- Liquidity alert: High institutional activity in the banks could presage block trade-driven moves or index-linked portfolio shifts.
Trading Suggestions
- Opportunistic entries: Look for momentum continuations in stocks with persistent volume surges & price above 15DMA (e.g., ROYALEX, INTBREW, CHAMPION, TRIPPLEG).
- Risk management: High RSI names may soon stall or correct. Protect gains in top YTD winners via stops/trailing orders.
- Rotation strategy: Watch for funds moving from overheated ETFs and overcrowded YTD winners into underappreciated names with new technical breakouts.
- Defensive Positioning: Income seekers could consider ROYALEX (defensive, high-yield, now bullish); avoid blindly catching falling knives among high growth names flashing fresh bearish signals.
- Monitor top retail/institutional overlap symbols: These are potential day trading targets due to guaranteed liquidity and volatility (ACCESSCORP, ZENITHBANK, UBA).
- Naira Watch: With the naira dipping 0.07% against the USD, exporters, importers, and companies with FX exposure remain at risk/reward inflection points.
|
Top ASI Gainers Over Last 5 Trading Days
|
Top ASI Losers Over Last 5 Trading Days
|
For more detailed analysis, on InfoWARE Market Data Terminal <NSEPERF> <GO>
On InfoWARE Finance Mobile App (Android, iPhone & iPad, Windows Phone and Windows 8/10), "Top Gainers & Losers"
GREENWICH ASSET ETF (GREENWETF) topped the advancers list closing at N266.20 with a gain of 10.00% followed by ACADEMY PRESS PLC. (ACADEMY) which closed at N10.24 with a gain of 9.99%.
On the flip side LIVESTOCK FEEDS PLC. (LIVESTOCK) and THE INITIATES PLC (TIP) topped the decliners log with a loss of -10.00% at a close of N8.10, and -9.98% to close the day at N14.52 respectively.
| Symbol | LClose | %Chg |
|---|---|---|
| GREENWETF | 266.20 | 10.00 |
| ACADEMY | 10.24 | 9.99 |
| CHAMPION | 13.55 | 9.98 |
| TRIPPLEG | 3.86 | 9.97 |
| MAYBAKER | 18.80 | 9.94 |
| Symbol | LClose | %Chg |
|---|---|---|
| LIVESTOCK | 8.10 | -10.00 |
| TIP | 14.52 | -9.98 |
| ELLAHLAKES | 8.91 | -9.08 |
| NEWGOLD | 52,100.00 | -6.63 |
| NGXGROUP | 75.00 | -6.02 |
For more detailed analysis,
- On InfoWARE Market Data Terminal <TOPG> <GO>
- On InfoWARE Finance Mobile App ( Android, iPhone & iPad and Windows 10) , "Top Gainers & Losers"
Currency Market
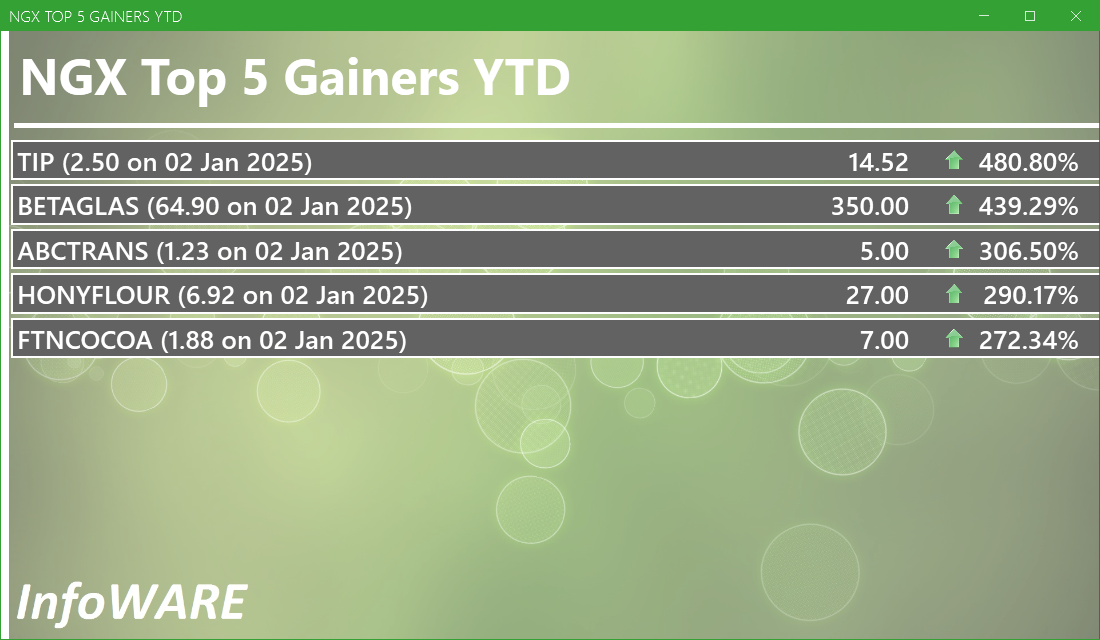
In the currency market, the Naira fell 0.07%(-1.01) against the Dollar to settle at 1 to 1Investment Insights - Top 5 Gainers YTD
These stocks are the best performers whose price has risen faster than the market as a whole with the best returns year to date. Momentum investors believe that stocks that have outperformed the market will often continue to do so because the factors that caused them to outperform will not suddenly disappear. In addition, other investors seeking to benefit from the stock’s outperformance will often purchase the stock, further bidding its price higher and pushing the stock higher still
For more detailed analysis,
- On InfoWARE Market Data Terminal <T5YTD2> <GO>
- On InfoWARE Finance Mobile App ( Android , iPhone & iPad and Windows 10) , "Research"
NSE: Bull Signal - Price crossed above 15 Day MA
This signal implies these stocks are under buying pressure and the price might continue to rise and therefore positions should be monitored closely. Further suggested analysis include looking at the overall market (ASI) to see if the uptrend is market wide, sector wide or specific to the stock. Portfolio managers tend to use this as a signal to do more research to add to their positions or lock in some profits. Typically further analysis should be done using commands like PC and RV on the InfoWARE Market Data Terminal. Another command is ALERTS to set price triggers for possible exit or entry as necessary
For more detailed analysis,
- On InfoWARE Market Data Terminal <NSEPERF> <GO>
- On InfoWARE Finance Mobile App ( Android , iPhone & iPad and Windows 10) , "Top Gainers & Losers"
| Symbol | Price | %Chg | 15DMA | PE | EPS | DivY | MktCap | Vol | Trades | Value | LstTradeTime |
|---|---|---|---|---|---|---|---|---|---|---|---|
| CHAMPION | 13.55 | 9.08 | 13.13 | 412.83 | 0.01 | 0.41 | 106.09B | 2.86M | 173.00 | 38.76M | 28-Jul-2025 14:30:20.457 |
| TRIPPLEG | 3.86 | 9.07 | 3.78 | 215.00 | 0.01 | 5.32 | 1.91B | 496.81K | 33.00 | 1.87M | 28-Jul-2025 14:30:29.917 |
| DAARCOMM | 0.89 | 8.99 | 0.86 | 0.00 | 0.00 | 0.00 | 10.68B | 7.11M | 187.00 | 6.29M | 28-Jul-2025 14:30:21.030 |
| ROYALEX | 1.37 | 8.76 | 1.27 | 0.00 | 0.00 | 7.81 | 7.05B | 27.62M | 174.00 | 37.08M | 28-Jul-2025 14:31:23.387 |
| RTBRISCOE | 3.91 | 8.44 | 3.73 | 0.00 | 0.00 | 4.35 | 4.60B | 3.02M | 147.00 | 11.63M | 28-Jul-2025 14:30:29.283 |
| LEGENDINT | 6.90 | 6.67 | 6.60 | 0.00 | 0.00 | 3.41M | 146.00 | 23.06M | 28-Jul-2025 14:31:23.220 | ||
| ETI | 34.00 | 5.88 | 33.48 | 5.00 | 5.10 | 2.00 | 623.88B | 1.21M | 157.00 | 40.62M | 28-Jul-2025 14:30:21.397 |
| NNFM | 103.50 | 0.00 | 103.44 | 63.46 | 0.55 | 1.44 | 18.44B | 268.13K | 89.00 | 26.28M | 28-Jul-2025 14:30:28.470 |
NSE: BEAR Signal - Price crossed below 15 Day MA
This signal implies these stocks are under selling pressure and the price might continue to slide and therefore positions should be monitored closely. Further suggested analysis include looking at the overall market (ASI) to see if the downtrend is market wide, sector wide or specific to the stock. If the overal market trend is upwards, then since these stocks are heading in the opposite direction, then further analysis should be done using commands like PC and RV on the InfoWARE Market Data Terminal. Another command is ALERTS to set price triggers for possible exit is necessar
For more detailed analysis,
- On InfoWARE Market Data Terminal <BEARM> <GO>
- On InfoWARE Finance Mobile App ( Android , iPhone & iPad and Windows 10)
| Symbol | Price | %Chg | 15DMA | PE | EPS | DivY | MktCap | Vol | Trades | Value | LstTradeTime |
|---|---|---|---|---|---|---|---|---|---|---|---|
| FG202033S6 | 111.00 | 0.00 | 111.00 | 0.00 | 0.00 | 0.00 | 0.00 | 0.00 | 28-Jul-2025 14:30:34.337 | ||
| HONYFLOUR | 27.00 | 0.00 | 27.04 | 16.28 | 0.31 | 1.40 | 214.12B | 3.40M | 575.00 | 91.88M | 28-Jul-2025 14:30:21.927 |
| REDSTAREX | 12.42 | 0.00 | 12.46 | 5.93 | 0.74 | 6.12 | 11.85B | 160.29K | 42.00 | 1.98M | 28-Jul-2025 14:30:29.197 |
| TRANSCORP | 49.50 | -2.83 | 49.52 | 0.00 | 0.00 | 0.23 | 2,012.08B | 4.06M | 495.00 | 201.19M | 28-Jul-2025 14:30:29.797 |
| CILEASING | 7.10 | -4.93 | 7.34 | 6.50 | 0.64 | 1.20 | 5.55B | 1.65M | 87.00 | 11.79M | 28-Jul-2025 14:30:20.540 |
| CUTIX | 3.90 | -5.13 | 4.04 | 8.81 | 0.26 | 6.52 | 13.74B | 15.17M | 530.00 | 58.85M | 28-Jul-2025 14:30:21.000 |
| NEWGOLD | 52,100.00 | -7.10 | 54,407.67 | 0.00 | 0.00 | 0.00 | 0.00 | 8.00 | 4.00 | 436.42K | 28-Jul-2025 14:31:24.487 |
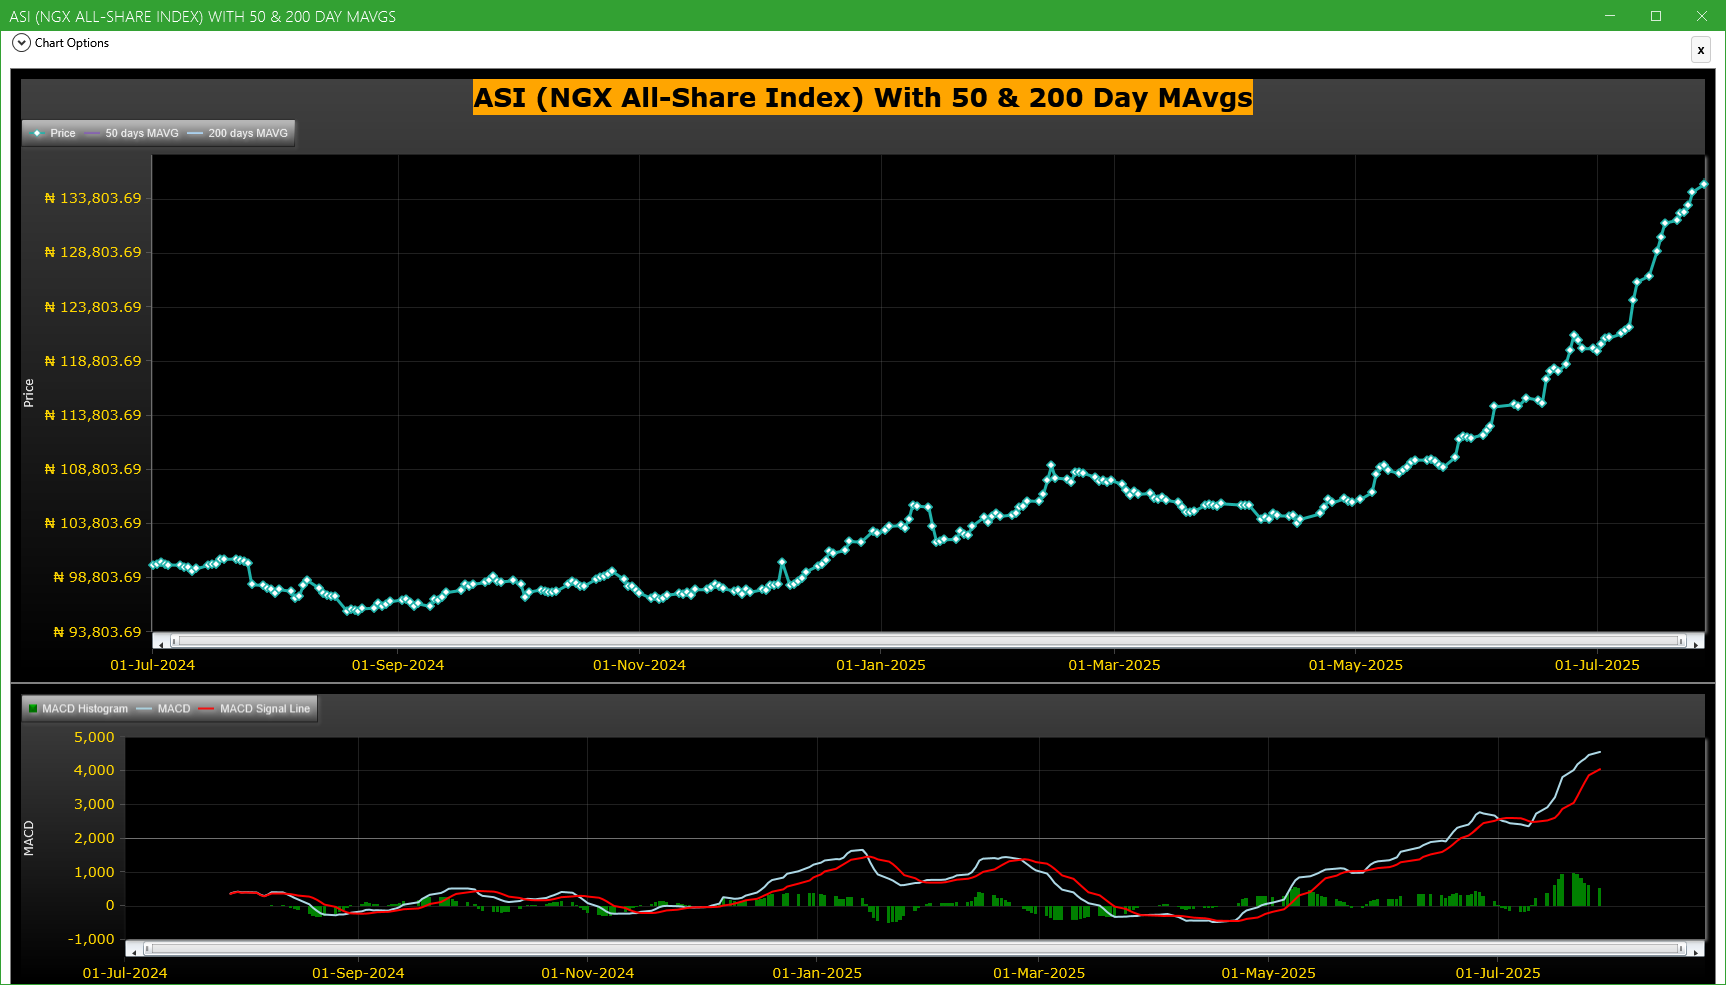
Market Trend - ASI (NGX All-Share-Index) With 50 & 200 Day MAvgs Chart
Technical traders typically use the 50 & 200 day moving averages to aid in choosing
where to enter or exit a position, which then causes these levels to act as strong
support or resistance. As a general guideline, if the price is above a moving average,
the trend is up. If the price is below a moving average, the trend is down.
It is important to note that critics of technical analysis say that moving averages act
as support and resistance because so many traders use these indicators to inform their
trading decisions. Also moving averages tend to work quite well in strong trending conditions
but poorly in choppy or ranging conditions.
Trading Strategies: Crossovers
Crossovers are one of the main moving average strategies. The first type is a price crossover,
which is when the price crosses above or below a moving average to signal a potential change
in trend. Another strategy is to apply two moving averages to a chart: one longer and one
shorter. When the shorter-term MA crosses above the longer-term MA, it is a buy signal, as
it indicates that the trend is shifting up. This is known as a golden cross. Meanwhile, when
the shorter-term MA crosses below the longer-term MA, it is a sell signal, as it indicates that
the trend is shifting down. This is known as a dead/death cross
For more detailed analysis,
- On InfoWARE Market Data Terminal <CI> <GO>
- On InfoWARE Finance Mobile App ( Android , iPhone & iPad and Windows 10) , "Research"
Unusual Volume: Volume traded is more than double the 90 day moving average (All exchanges; ASI & ASem). For more detailed analysis,
- On InfoWARE Market Data Terminal <UV> <GO>
- On InfoWARE Finance Mobile App ( Android , iPhone & iPad and Windows 10)
| Symbol | Name | Volume | 90DAvgVol | %VolChg | Price | LClose | %Chg | Trades | Value |
|---|---|---|---|---|---|---|---|---|---|
| FIDELITYBK | FIDELITY BANK PLC | 123.01M | 57.14M | 115.27 | 21.00 | 21.20 | -0.94 | 1,061 | 2.58B |
| ROYALEX | ROYAL EXCHANGE PLC. | 27.62M | 12.23M | 125.79 | 1.37 | 1.25 | 9.60 | 174 | 37.08M |
| NSLTECH | SECURE ELECTRONIC TECHNOLOGY PLC | 15.64M | 5.29M | 195.73 | 0.89 | 0.92 | -3.26 | 216 | 13.65M |
| INTBREW | INTERNATIONAL BREWERIES PLC. | 12.26M | 5.78M | 111.98 | 16.20 | 15.20 | 6.58 | 318 | 195.88M |
| SOVRENINS | SOVEREIGN TRUST INSURANCE PLC | 11.42M | 4.70M | 143.19 | 1.72 | 1.57 | 9.55 | 234 | 19.51M |
Investment Insights - High Div. Stocks
Dividend stocks distribute a portion of the company earnings to investors on a regular basis and they can a great choice for investors looking for regular income. As an investment or trading strategy, high dividend yield equities provide annual cash payments as against mostly capital gains in the price of a stock. The list in the table below represent the highest dividend paying stocks from the list of the most liquid stocks in the NSE top 30.
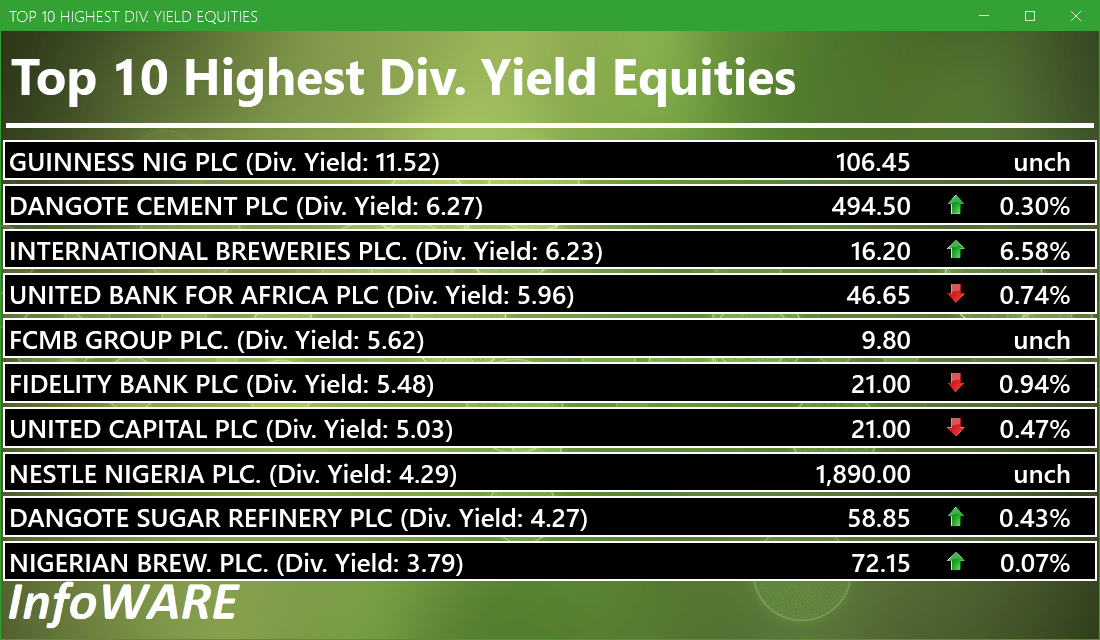
For more detailed analysis,
- On InfoWARE Market Data Terminal <HYIELD> <GO>
- On InfoWARE Finance Mobile App ( Android , iPhone & iPad and Windows 10) , "Research"
Investment Insights - Stocks outperforming the ASI but with approximately the same risk
These list of stocks represent equities that are less risky than the ASI but doing better than the ASI (All Shares Index) using the YTD (Year to Date) returns as the measure. The risk is measured by Beta. Beta is an assessment of a stock's tendency to undergo price changes, (its volatility), as well as its potential returns compared to the ASI. It is expressed as a ratio, where a score of 1 represents performance comparable to the ASI, and returns above or below the market may receive scores greater or lower than 1.
For a full list of both positively and negatively corelated stocks visit InfoWARE Market Data Terminal
- On InfoWARE Market Data Terminal <BANL> <GO>
- On InfoWARE Finance Mobile App ( Android , iPhone & iPad and Windows 10)
| Symbol | DivYield | PE | EPS | Beta | %ChgYTD | ASIYTDReturn | BetaDiff |
|---|---|---|---|---|---|---|---|
| HONYFLOUR | 1.40 | 16.28 | 0.31 | 0.99 | 290.17 | 31.00 | 0.01 |
| CAVERTON | 5.52 | 1.15 | 1.57 | 0.98 | 176.86 | 31.00 | 0.02 |
| FTNCOCOA | 1.60 | 0.00 | 0.00 | 0.79 | 272.34 | 31.00 | 0.21 |
| NB | 3.79 | 16.95 | 1.60 | 0.79 | 125.47 | 31.00 | 0.21 |
| MAYBAKER | 3.75 | 58.94 | 0.14 | 0.78 | 100.00 | 31.00 | 0.22 |
| UNILEVER | 2.81 | 67.09 | 0.40 | 0.75 | 101.39 | 31.00 | 0.25 |
| VETGOODS | 0.00 | 0.71 | 75.58 | 31.00 | 0.29 | ||
| CUTIX | 6.52 | 8.81 | 0.26 | 0.70 | 54.15 | 31.00 | 0.30 |
| Ikejahotel | 0.94 | 51.55 | 0.16 | 0.70 | 87.04 | 31.00 | 0.30 |
| ABBEYBDS | 1.43 | 0.00 | 0.00 | 0.70 | 166.67 | 31.00 | 0.30 |
African Markets
| Name | LClose | Change | %Chg |
|---|---|---|---|
| BRVM Stock Exchange | 311.40 | 1.30 | 0.42 |
| Botswana Stock Exchange | 10,496.81 | 1.05 | 0.01 |
| Egyptian Exchange | 34,125.12 | 321.14 | 0.95 |
| Ghana Stock Exchange | 6,673.11 | 236.85 | 3.68 |
| Johannesburg Stock Exchange | 98,918.88 | -1,049.67 | -1.05 |
| Lusaka Stock Exchange | 21,050.27 | 102.64 | 0.49 |
| Casablanca Stock Exchange | 19,404.80 | 138.72 | 0.72 |
| Malawi Stock Exchange | 331,801.40 | 0.00 | 0.00 |
| Nigeria Stock Exchange | 134,452.93 | 1,252.09 | 0.94 |
| Nairobi Securities Exchange | 160.53 | 0.30 | 0.19 |
| Namibian Stock Exchange | 1,792.11 | -21.40 | -1.18 |
| Rwanda Stock Exchange | 150.43 | 0.00 | 0.00 |
| Uganda Securities Exchange | 1,336.24 | 7.84 | 0.59 |
Nigeria Market Indexes
| Symbol | LClose | %Chg | WTD% | MTD% | QTD% | YTD% | MktCap | Trades |
|---|---|---|---|---|---|---|---|---|
| ASI | 135,166.51 | 0.53 | 0.00 | 12.88 | 12.88 | 31.00 | 35,186 | |
| NGX30 | 4,954.07 | 0.44 | 0.00 | 4.88 | 4.88 | 29.86 | 18,292 | |
| NGXAFRBVI | 3,641.64 | -0.84 | 0.00 | 2.77 | 2.77 | 46.79 | 6,566 | |
| NGXAFRHDYI | 22,744.36 | -0.33 | 0.00 | 8.75 | 8.75 | 33.57 | 7,810 | |
| NGXASEM | 1,446.38 | 0.00 | 0.00 | -9.32 | -9.32 | -8.67 | 34 | |
| NGXBNK | 1,553.53 | -0.69 | 0.00 | 2.83 | 2.83 | 42.86 | 7,924 | |
| NGXCG | 4,097.42 | -0.28 | 0.00 | 19.16 | 19.16 | 44.82 | 16,373 | |
| NGXCNSMRGDS | 2,934.93 | 1.29 | 0.00 | -15.39 | -15.39 | 69.22 | 4,327 | |
| NGXCOMMDTY | 1,087.21 | 0.01 | 0.00 | 3.82 | 3.82 | 8.72 | ||
| NGXGROWTH | 10,025.53 | 1.69 | 0.00 | 5.43 | 5.43 | 29.15 | 768 | |
| NGXINDUSTR | 4,620.36 | 0.64 | 0.00 | 31.15 | 31.15 | 29.36 | 3,458 | |
| NGXINS | 920.72 | 2.54 | 0.00 | 24.66 | 24.66 | 17.11 | 2,127 | |
| NGXLOTUSISLM | 10,840.59 | 0.87 | 0.00 | 13.22 | 13.22 | 55.58 | 6,287 | |
| NGXMAINBOARD | 6,490.75 | 0.50 | 0.00 | 10.03 | 10.03 | 29.71 | 26,344 | |
| NGXMERIGRW | 9,624.06 | -0.06 | 0.00 | -0.29 | -0.29 | 47.53 | 5,374 | |
| NGXMERIVAL | 13,763.35 | -0.48 | 0.00 | 15.20 | 15.20 | 31.95 | 9,404 | |
| NGXOILGAS | 2,453.71 | 0.22 | 0.00 | 2.57 | 2.57 | -9.50 | 488 | |
| NGXPENBRD | 2,467.16 | 0.33 | 0.00 | 7.30 | 7.30 | 34.70 | 27,454 | |
| NGXPENSION | 6,620.67 | -0.07 | 0.00 | 4.19 | 4.19 | 46.02 | 20,495 | |
| NGXPREMIUM | 13,599.38 | 0.58 | 0.00 | 18.57 | 18.57 | 39.73 | 8,074 | |
| NGXSOVBND | 669.79 | 0.24 | 0.00 | 2.49 | 2.49 | 11.35 | 0 |
For more detailed analysis,
- On InfoWARE Market Data Terminal <MKTINS> <GO>
- On InfoWARE Finance Mobile App ( Android, iPhone & iPad and Windows 10) , "Market Indexes"
Find the topic interesting? Will like to comment? Contact Us at solutions@infowarelimited.com
Top News

[SIAMLETF40]>> DAILY INDICATIVE PRICES
[MERVALUE]>> DAILY INDICATIVE PRICES
[ETRANZACT]>> Earning Forcast - <Q3-2025> ?-<E-TRANZACT INTERNATIONAL PLC>
[RONCHESS]>>Corporate Disclosures-<RONCHESS GLOBAL RESOURCES PLC>
[VETBANK]>> DAILY INDICATIVE PRICES
[XNSA]>> CORDROS MILESTONE FUNDS' BID & OFFER PRICES
[ETI]>>Corporate Disclosures-<ECOBANK TRANSNATIONAL INCORPORATED>
[XNSA]>> NGX FIXED INCOME INDICATIVE PRICE LIST FOR JUL 29, 2025
[XNSA]>> EMERGING AFRICA DAILY FUND PRICES
[ELLAHLAKES]>>Corporate Disclosures-<ELLAH LAKES PLC.>
[JAIZBANK]>>Notice of Meeting -<JAIZ BANK PLC>

Chart Of The Day - ASI Chart Vs ASI Advance Decline Line (YTD) (28-Jul-2025 15:07:32.746)
InfoWARE AI Analyst Daily Market Report: 28-Jul-2025
[MERGROWTH]>> DAILY INDICATIVE PRICES
[TRANSPOWER]>>Corporate Disclosures-<TRANSCORP POWER PLC>
[TRANSPOWER]>>Corporate Disclosures-<TRANSCORP POWER PLC>
[TRANSPOWER]>>Corporate Disclosures-<TRANSCORP POWER PLC>
[XNSA]>> CIS ACADEMY TRAINING ON
[UCAP]>>Corporate Disclosures-<UNITED CAPITAL PLC>
[DANGCEM]>>Corporate Disclosures-<DANGOTE CEMENT PLC>
[XNSA]>> RECLASSIFICATION OF NCR NIGERIA PLC FROM LOW PRICE STOCK GROUP TO MEDIU
[XNSA]>> RECLASSIFICATION OF CHELLARAMS PLC FROM LOW PRICE STOCK GROUP TO MEDIUM
[VETGOODS]>> DAILY INDICATIVE PRICES
[XNSA]>> NGX FIXED INCOME INDICATIVE PRICE LIST FOR JUL 28, 2025
[ROYALEX]>> Earning Forcast - <Q2-2025> ?-<ROYAL EXCHANGE PLC.>
[UCAP]>>Corporate Disclosures-<UNITED CAPITAL PLC>
[UNILEVER]>>Corporate Disclosures-<UNILEVER NIGERIA PLC.>
[PRESTIGE]>>Corporate Disclosures-<PRESTIGE ASSURANCE PLC>
[XNSA]>> DELISTING OF THE SHARES OF MRS OIL NIGERIA PLC
[XNSA]>> CORDROS MILESTONE FUNDS' BID & OFFER PRICES
Get IDIA - the stock trading app for the modern investor
Solutions by Business
Product Suites
Company
Contacts
- 8th Floor,
- South Atlantic Petroleum Towers,
- 1 Adeola Odeku Street,
- Victoria Island,
- Lagos, Nigeria.
- Email: solutions@infowarelimited.com
Follow Us
 |
 |
 |
 |