


InfoWARE AI Analyst Daily Market Report: 25-Aug-2025 | InfoWARE Finance
Get IDIA - the stock trading app for the modern investor


InfoWARE AI Analyst Daily Market Report: 25-Aug-2025
(Source: InfoWARE Terminal, Date: 25-Aug-2025)
Dear Investor,
NGX Daily Market Summary – Monday, August 25, 2025
Market Recap: The NGX All Share Index (ASI) finished +0.31% higher at 141,004.14, pushing its stellar Year-To-Date return to +37.08%. However, today’s upbeat close was tempered by a significant decline in turnover (traded value down -38.23% to ₦9.47B vs. ₦15.33B prior), and a narrower volume of 568.76M shares traded (-18.5% vs. previous day). Nonetheless, market breadth was positive at 1.79x, with 43 advancers to 24 decliners, suggesting a moderately strong underlying sentiment as we pick up from last week.
Previous Week Highlights Snapshot
Last week, the market maintained a bullish bias, with the ASI recording a string of positive closes, driven largely by momentum in financials and insurance sectors. Volatility picked up in select large-caps while sectoral divergence remained, maintaining a robust YTD trajectory. This continued upward momentum is notable against a backdrop of profit-taking in some previous hot-spots and a cautious uptrend in new favorites, signaling a possible "sector rotation" in play.
Significant Trends in Market Breadth
- Positive breadth: 43 advancers vs. 24 decliners (1.79x breadth), signaling an overall bullish undertone in this session.
- However, trade turnover and volume fell notably, indicating that today’s bounce lacked conviction from larger players—a flag for possible indecision or wait-and-see among institutions.
- Of 140+ stocks, volumes were up in 61 and down in 79 stocks, showing selective participation—this is important to monitor as it may precede a breadth contraction if the trend persists.
Top Gainers & Losers – Stock-Specific Highlights
| Top 5 Gainers | Top 5 Losers | ||||
|---|---|---|---|---|---|
| Stock | Close | % Change | Stock | Close | % Change |
| THE SIAML PENSION ETF 40 | 651.21 | +10.00% | VETIVA S&P NIG SOV BOND ETF | 211.02 | -19.15% |
| JULIUS BERGER NIG. PLC. | 146.10 | +9.93% | UNIVERSITY PRESS PLC. | 5.54 | -9.92% |
| CUTIX PLC. | 3.90 | +9.86% | MERISTEM GROWTH ETF | 726.00 | -9.70% |
| REGENCY ALLIANCE INS. | 1.47 | +9.70% | CADBURY NIGERIA PLC. | 57.85 | -9.61% |
| VERITAS KAPITAL ASSURANCE | 2.17 | +9.60% | GREENWICH ASSET ETF | 315.90 | -9.09% |
- SIAMLETF40: Top gainer today (+10.00%), RSI 79.8 (highly overbought), ongoing momentum for both today and rolling 5 days.
- JULIUS BERGER: Not only a price leader today, but also saw +619% surge in traded volume (vs. 90D average)—a potential institutionally backed breakout.
- MERGROWTH ETF: The biggest loser both today (-9.70%) and on a YTD basis (-84.03%), indicating deep-rooted selling.
- CADBURY & UPL: Both among top losers today and also feature on the YTD losers table—signaling sustained negative momentum that warrants caution.
- VERITASKAP: Strong price gain (+9.60%), huge volume increase (+148% of 90-day average), and bullish momentum crossover—all point toward rising speculative interest.
Momentum and Pattern Analysis
- Bullish momentum (15DMA cross ↑): JBERGER, CUTIX, VERITASKAP, AFRIPRUD and others triggered new short-term "buy" signals. Especially notable: JBERGER and VERITASKAP, both also with unusual volumes and price spikes—clear institutional footprints.
- Bearish momentum (15DMA cross ↓): CADBURY, UPL, ABBEYBDS, TANTALIZER, NEWGOLD slipped below key moving averages with weak volume, confirming their spot in top declining lists.
-
RSI Extremes: SIAMLETF40’s RSI 79.8 confirms, with its monthly performance, that it is potentially overextended—caution for new buyers.
On bearish side: No stocks triggered deeply oversold RSI (<30), suggesting bear pressure is more gradual, not panicked. - Unusual Volumes: Stocks like AUSTINLAZ (+843%), JBERGER (+619%), VERITASKAP (+148%), and AFRIPRUD (+114%) all experienced volume surges, often telegraphing major interest shifts. Many of these align with bullish momentum signals.
- Currency Headwind: The naira slipped -0.18% against the USD to 1,537—potentially supportive for exporters and multinational earnings but may cloud investor sentiment toward consumer sectors.
YTD Top 5 Gainers & Losers (Monday Recap)
| Top 5 YTD Gainers | |||||
|---|---|---|---|---|---|
| Stock | Price | YTD % | RSI | Div. Yield | PE Ratio |
| THE SIAML PENSION ETF 40 | 651.21 | +123.0% | 79.8 | 0.0 | - |
| AIICO INSURANCE PLC. | 4.18 | +184.7% | 66.5 | 4.13 | 2.01 |
| N.E.M INSURANCE CO (NIG) PLC. | 26.60 | +141.3% | 47.8 | 6.52 | 24.99 |
| SECURE ELECTRONIC TECH | 1.10 | +56.5% | 61.3 | 15.87 | - |
| OMATEK VENTURES PLC | 1.49 | +87.5% | 58.8 | 0.0 | 6.82 |
| Top 5 YTD Losers | |||||
| Stock | Price | YTD % | RSI | Div. Yield | PE Ratio |
| MERISTEM GROWTH ETF | 726.00 | -84.0% | 52.4 | 0.00 | - |
| UNIVERSITY PRESS PLC | 5.54 | -43.9% | 51.2 | 0.60 | 7.13 |
| THOMAS WYATT NIG. PLC. | 3.00 | -57.9% | 41.7 | 1.05 | - |
| DAAR COMMUNICATIONS | 1.21 | -64.7% | 67.4 | 0.00 | - |
| BUA CEMENT PLC | 151.80 | -63.2% | 52.3 | 2.10 | - |
Contrarian Signals: Hidden/Conflicting Indicators
- JULIUS BERGER – While its RSI is below overbought (49.2), today's bullish MACD crossover and extraordinary volume suggest that the uptrend is gaining new legs. This could be a classic "breakout from consolidation"—valuable for traders seeking big moves, though profit-taking risk rises if volume fades.
- AFRIPRUD – With high dividend yield (1.27%), an unusually large volume day, and a new short-term bullish signal (15DMA ↗), yet with a relatively low beta (0.64). Defensive, yield-oriented, but with enough technical/flow momentum to interest swing traders.
- MERGROWTH ETF – Despite huge price drops (-84% YTD), its RSI and MACD are not deeply oversold—hints that a short-term reversion pop is possible for risk-seeking contrarians, but long-term trend remains negative.
- VERITASKAP – Already well above its 15DMA and with ballooning volume, but only modestly above neutral RSI (54.9), suggesting it’s at the early phase of a trend—might have further room, especially if speculative flows continue.
- High-yield defensive in momentum table: AFRIPRUD and CUTIX (Div yields: 1.27% & 6.52%)—both in bullish momentum signals list. Defensive plays starting to draw flows amid volatility.
Sector Heatmaps
| Sector | Top Movers | Momentum Signal | Retail vs Inst. Act. |
|---|---|---|---|
| Insurance | VERITASKAP, AIICO, NEM | Bullish (price, RSI, vol. spikes) | Active retail, growing instl. volume (AIICO likely target) |
| Financial Institutions | AFRIPRUD, ACCESSCORP, FCMB | Mixed – AFRIPRUD (bullish vol. & signal) | Instl. dominated flows in top banks (ZENITHBANK, UBA, FCMB) |
| Construction/Infra | JBERGER | Bullish breakout (price & vol.) | Strong institutional action (see below) |
| Consumer Goods | CADBURY | Bearish (breaking 15DMA and vol. drop) | Low retail/institutional interest today |
| ETFs | SIAMLETF40, MERGROWTH, VSPBONDETF | SIAMLETF40 strong up; others deeply negative | Speculative flows, low fundamental anchor |
Dividend-Beta Matrix: Defensive Yield Opportunities
| Stock | Dividend Yield | Beta | Momentum Signal |
|---|---|---|---|
| AFRIPRUD | 1.27% | 0.64 | Bullish (price, vol.) |
| CUTIX | 6.52% | 0.70 | Bullish (gains & 15DMA) |
| NEM | 6.52% | 0.69 | Stable/neutral |
| AIICO | 4.13% | 1.33 | Strong YTD, RSI high |
| INTBREW | 6.23% | 1.04 | Bullish (15DMA up) |
Comment: AFRIPRUD and CUTIX display unusually defensive yield with fresh bullish signals, attractive for yield-seeking investors wanting measured NGX risk.
Institutional Clustering Alerts
- ZENITHBANK: Accounted for 20.17% of all institutional trade value, with both retail and institutional investors actively trading. This stock is the focal point for institutional flows; watch for clues of asset allocation or sector rotation.
- FCMB: Institutional trades also surged (104/total 1580), with trade value over ₦1.1B and double normal volume, suggesting fund flows or block trades.
- JBERGER: Caught institutional attention—volume today was over 6x its 90D average. Price surge was likely fund-driven and not simply retail speculation.
- ACCESSCORP, UBA: Rounded out top institutional trades. All five institutional "favorites” are major financials or infra-plays.
- Retail flows: Heavy on MTNN, ZENITHBANK, UBA, ACCESSCORP, GTCO – largely financials and telecoms, with banks as clear liquidity hot spots.
Retail vs. Institutional Market Activity Insights
| Investor Type | Trade Count | Volume | Gross Trade Value (₦) | % of Trade Count | % of Volume | % of Value |
|---|---|---|---|---|---|---|
| Institutional | 1,580 | 337.93M | 8.89B | 37.2% | 57.3% | 79.2% |
| Retail | 31,807 | 251.83M | 2.34B | 62.8% | 42.7% | 20.8% |
- Though retail accounts for most trade count, institutional investors dominate volume and value, driving direction.
-
Top 5 Most Traded (Institutional):
- ZENITHBANK (nearly ₦600M; 8.4M shares)
- UBA
- FCMB (standout: 100M+ shares, ₦1.1B, huge block-like trades)
- ARADEL
- ACCESSCORP
-
Top 5 Most Traded (Retail):
- MTNN
- ZENITHBANK (again—broad appeal!)
- UBA
- ACCESSCORP
- GTCO
- Pattern: Banks dominate both retail and institutional trade interest, but institutions set the tone for block trade direction.
- Unusual institutional activity (JBERGER, FCMB, ZENITHBANK) often preceded strong price moves, a useful tell for traders to watch order flows, not just prices!
Trader Guidance & Hidden Insights
- Momentum buys: Monitor SIAMLETF40, VERITASKAP, JULIUS BERGER—each with fundamental support from volume, coupled with bullish technical patterns. However, SIAMLETF40’s overbought RSI suggests only advanced, high-conviction traders should chase.
- Bullish dividend yields: AFRIPRUD and CUTIX offer potential "low beta + income” setups with fresh momentum breakouts. Compelling for defensive traders seeking participation without heavy beta risk.
- Bears beware: UPL, CADBURY, GREENWETF, NEWGOLD, ABBEYBDS—linked by price declines, bearish technical moves (15DMA breakdowns), and no compelling counter-flows. Potential short/avoid zones unless a reversal signal emerges.
- Contrarian edge: Watch JBERGER’s next sessions. Today’s breakout is "textbook” post-consolidation, yet volume and MACD combo indicate room for further extension before overbought exhaustion.
- For short-term swing traders: Stocks with outsized volume moves and fresh technical overlays (like JULIUS BERGER, VERITASKAP) often extend for 1–3 days before reverting—consider trailing stops to lock profit.
- Sector rotation watch: Evidence of capital shuffling between consumer/ETF names (losing steam) and insurance, financials, and infra names (ascending) — a classic late-stage bull market phenomenon.
- Macro risk: The naira's continued slide might prompt foreign investor caution, but exporters and USD-earning stocks could be insulated.
- Caution flag: Market-wide breadth is healthy but turnover/volume is falling—if institutional volume does not return, this rally could stall.
|
Top ASI Gainers Over Last 5 Trading Days
|
Top ASI Losers Over Last 5 Trading Days
|
For more detailed analysis, on InfoWARE Market Data Terminal <NSEPERF> <GO>
On InfoWARE Finance Mobile App (Android, iPhone & iPad, Windows Phone and Windows 8/10), "Top Gainers & Losers"
THE SIAML PENSION ETF 40 (SIAMLETF40) topped the advancers list closing at N651.21 with a gain of 10.00% followed by JULIUS BERGER NIG. PLC. (JBERGER) which closed at N146.10 with a gain of 9.93%.
On the flip side VETIVA S & P NIGERIA SOVEREIGN BOND ETF (VSPBONDETF) and LOTUS HALAL EQUITY ETF (LOTUSHAL15) topped the decliners log with a loss of -19.15% at a close of N211.02, and -10.00% to close the day at N95.58 respectively.
| Symbol | LClose | %Chg |
|---|---|---|
| SIAMLETF40 | 651.21 | 10.00 |
| JBERGER | 146.10 | 9.93 |
| CUTIX | 3.90 | 9.86 |
| REGALINS | 1.47 | 9.70 |
| VERITASKAP | 2.17 | 9.60 |
| Symbol | LClose | %Chg |
|---|---|---|
| VSPBONDETF | 211.02 | -19.15 |
| LOTUSHAL15 | 95.58 | -10.00 |
| UPL | 5.54 | -9.92 |
| MERGROWTH | 726.00 | -9.70 |
| CADBURY | 57.85 | -9.61 |
For more detailed analysis,
- On InfoWARE Market Data Terminal <TOPG> <GO>
- On InfoWARE Finance Mobile App ( Android, iPhone & iPad and Windows 10) , "Top Gainers & Losers"
Currency Market
In the currency market, the Naira fell 0.18%(-2.70) against the Dollar to settle at 1 to 1Investment Insights - Top 5 Gainers YTD
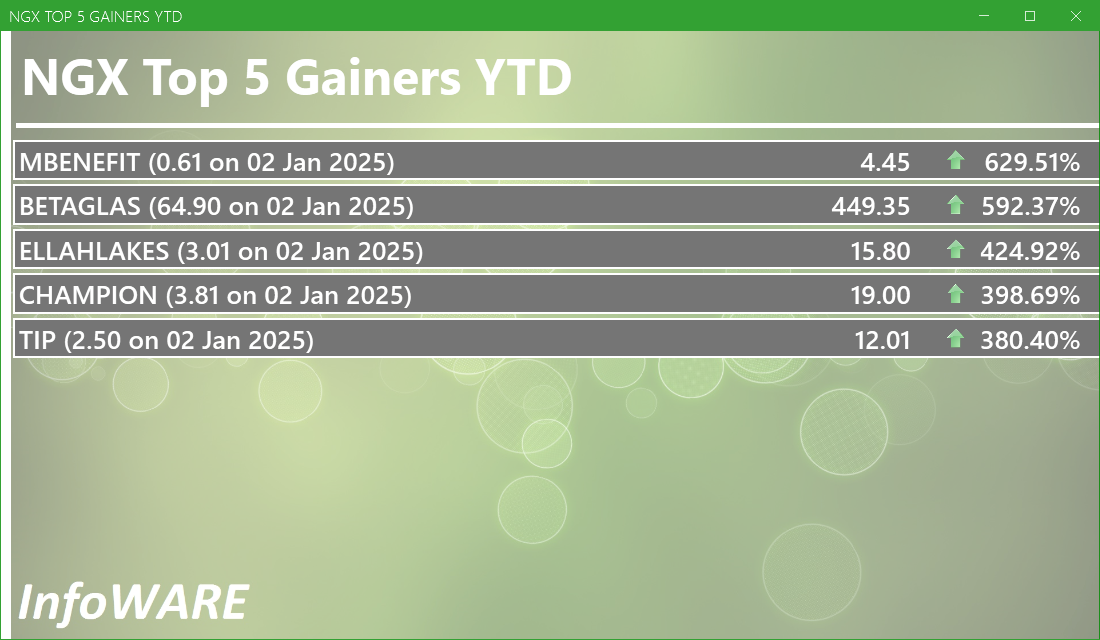
These stocks are the best performers whose price has risen faster than the market as a whole with the best returns year to date. Momentum investors believe that stocks that have outperformed the market will often continue to do so because the factors that caused them to outperform will not suddenly disappear. In addition, other investors seeking to benefit from the stock’s outperformance will often purchase the stock, further bidding its price higher and pushing the stock higher still
For more detailed analysis,
- On InfoWARE Market Data Terminal <T5YTD2> <GO>
- On InfoWARE Finance Mobile App ( Android , iPhone & iPad and Windows 10) , "Research"
NSE: Bull Signal - Price crossed above 15 Day MA
This signal implies these stocks are under buying pressure and the price might continue to rise and therefore positions should be monitored closely. Further suggested analysis include looking at the overall market (ASI) to see if the uptrend is market wide, sector wide or specific to the stock. Portfolio managers tend to use this as a signal to do more research to add to their positions or lock in some profits. Typically further analysis should be done using commands like PC and RV on the InfoWARE Market Data Terminal. Another command is ALERTS to set price triggers for possible exit or entry as necessary
For more detailed analysis,
- On InfoWARE Market Data Terminal <NSEPERF> <GO>
- On InfoWARE Finance Mobile App ( Android , iPhone & iPad and Windows 10) , "Top Gainers & Losers"
| Symbol | Price | %Chg | 15DMA | PE | EPS | DivY | MktCap | Vol | Trades | Value | LstTradeTime |
|---|---|---|---|---|---|---|---|---|---|---|---|
| JBERGER | 146.10 | 9.03 | 138.89 | 16.73 | 10.31 | 1.74 | 233.76B | 2.15M | 350.00 | 297.59M | 25-Aug-2025 14:30:08.113 |
| CUTIX | 3.90 | 8.97 | 3.84 | 8.81 | 0.26 | 6.52 | 13.74B | 2.13M | 122.00 | 8.27M | 25-Aug-2025 14:30:07.700 |
| VERITASKAP | 2.17 | 8.76 | 2.16 | 48.77 | 0.02 | 4.17 | 30.09B | 59.57M | 561.00 | 128.81M | 25-Aug-2025 14:30:23.283 |
| VETGOODS | 35.00 | 7.14 | 33.13 | 0.00 | 0.00 | 57.00 | 1.00 | 2.00K | 25-Aug-2025 14:30:23.527 | ||
| AFRIPRUD | 16.20 | 5.86 | 15.69 | 19.57 | 0.61 | 1.27 | 32.40B | 5.10M | 312.00 | 81.48M | 25-Aug-2025 14:30:07.377 |
| CHAMS | 2.89 | 5.54 | 2.79 | 27.02 | 0.07 | 1.56 | 13.57B | 9.19M | 410.00 | 26.49M | 25-Aug-2025 14:30:07.613 |
| LEGENDINT | 6.00 | 5.00 | 5.80 | 0.00 | 0.00 | 2.48M | 81.00 | 14.85M | 25-Aug-2025 14:30:08.167 | ||
| INTBREW | 13.35 | 2.62 | 13.16 | 0.00 | 0.00 | 6.23 | 358.61B | 2.79M | 168.00 | 37.01M | 25-Aug-2025 14:30:08.077 |
| JAPAULGOLD | 2.85 | 2.11 | 2.84 | 0.19 | 12.01 | 0.90 | 17.85B | 4.65M | 175.00 | 13.17M | 25-Aug-2025 14:30:08.100 |
| CWG | 16.70 | 1.80 | 16.52 | 0.00 | 0.00 | 2.46 | 42.16B | 1.18M | 155.00 | 19.46M | 25-Aug-2025 14:30:23.233 |
| GEREGU | 1,141.50 | 0.00 | 1,133.89 | 0.00 | 0.00 | 0.70 | 2,853.75B | 6.89K | 74.00 | 7.08M | 25-Aug-2025 14:30:07.940 |
NSE: BEAR Signal - Price crossed below 15 Day MA
This signal implies these stocks are under selling pressure and the price might continue to slide and therefore positions should be monitored closely. Further suggested analysis include looking at the overall market (ASI) to see if the downtrend is market wide, sector wide or specific to the stock. If the overal market trend is upwards, then since these stocks are heading in the opposite direction, then further analysis should be done using commands like PC and RV on the InfoWARE Market Data Terminal. Another command is ALERTS to set price triggers for possible exit is necessar
For more detailed analysis,
- On InfoWARE Market Data Terminal <BEARM> <GO>
- On InfoWARE Finance Mobile App ( Android , iPhone & iPad and Windows 10)
| Symbol | Price | %Chg | 15DMA | PE | EPS | DivY | MktCap | Vol | Trades | Value | LstTradeTime |
|---|---|---|---|---|---|---|---|---|---|---|---|
| FGS202760 | 99.00 | 0.00 | 99.00 | 0.00 | 0.00 | 0.00 | 0.00 | 0.00 | 25-Aug-2025 14:30:10.867 | ||
| LEARNAFRCA | 7.00 | 0.00 | 7.05 | 5.79 | 0.51 | 8.53 | 5.40B | 218.97K | 50.00 | 1.60M | 25-Aug-2025 14:30:08.153 |
| FGSUK2033S6 | 97.00 | -2.89 | 98.50 | 0.00 | 0.00 | 6.50K | 2.00 | 6.31M | 25-Aug-2025 14:30:25.707 | ||
| CAVERTON | 7.00 | -4.29 | 7.05 | 1.15 | 1.57 | 5.52 | 23.45B | 713.64K | 102.00 | 5.04M | 25-Aug-2025 14:30:07.590 |
| TANTALIZER | 2.50 | -6.00 | 2.63 | 0.00 | 0.00 | 1.50 | 8.03B | 4.86M | 135.00 | 12.32M | 25-Aug-2025 14:30:08.707 |
| NEWGOLD | 51,500.01 | -7.79 | 54,753.46 | 0.00 | 0.00 | 0.00 | 0.00 | 7.00 | 4.00 | 382.01K | 25-Aug-2025 14:30:23.483 |
| ABBEYBDS | 6.55 | -9.16 | 6.61 | 0.00 | 0.00 | 1.43 | 66.51B | 254.88K | 60.00 | 1.70M | 25-Aug-2025 14:30:07.323 |
| CADBURY | 57.85 | -10.63 | 62.40 | 33.25 | 0.64 | 1.88 | 108.65B | 660.41K | 252.00 | 39.23M | 25-Aug-2025 14:30:07.563 |
| UPL | 5.54 | -11.01 | 6.32 | 7.13 | 0.59 | 0.60 | 2.39B | 681.46K | 65.00 | 4.05M | 25-Aug-2025 14:30:08.900 |
| FGSUK2027S3 | 80.00 | -18.50 | 87.43 | 0.00 | 0.00 | 2.00 | 1.00 | 1.60K | 25-Aug-2025 14:30:25.683 | ||
| VSPBONDETF | 211.02 | -23.68 | 237.15 | 0.00 | 0.00 | 185.00 | 3.00 | 47.61K | 25-Aug-2025 14:30:23.550 |
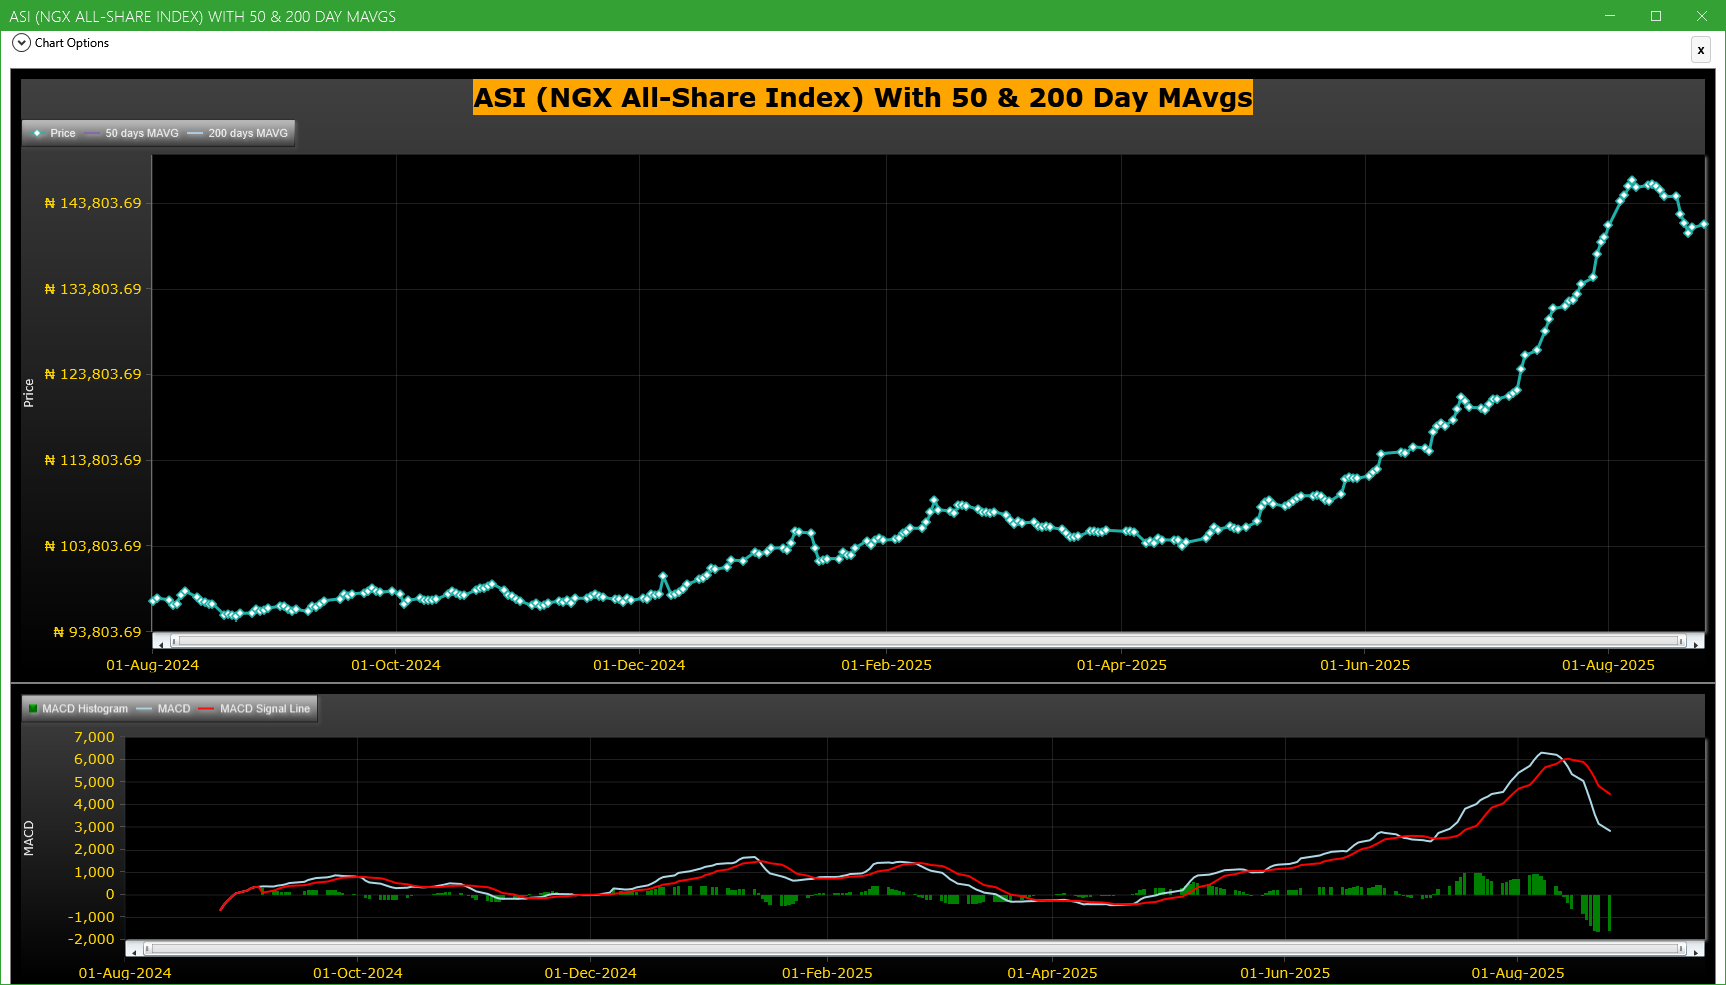
Market Trend - ASI (NGX All-Share-Index) With 50 & 200 Day MAvgs Chart
Technical traders typically use the 50 & 200 day moving averages to aid in choosing
where to enter or exit a position, which then causes these levels to act as strong
support or resistance. As a general guideline, if the price is above a moving average,
the trend is up. If the price is below a moving average, the trend is down.
It is important to note that critics of technical analysis say that moving averages act
as support and resistance because so many traders use these indicators to inform their
trading decisions. Also moving averages tend to work quite well in strong trending conditions
but poorly in choppy or ranging conditions.
Trading Strategies: Crossovers
Crossovers are one of the main moving average strategies. The first type is a price crossover,
which is when the price crosses above or below a moving average to signal a potential change
in trend. Another strategy is to apply two moving averages to a chart: one longer and one
shorter. When the shorter-term MA crosses above the longer-term MA, it is a buy signal, as
it indicates that the trend is shifting up. This is known as a golden cross. Meanwhile, when
the shorter-term MA crosses below the longer-term MA, it is a sell signal, as it indicates that
the trend is shifting down. This is known as a dead/death cross
For more detailed analysis,
- On InfoWARE Market Data Terminal <CI> <GO>
- On InfoWARE Finance Mobile App ( Android , iPhone & iPad and Windows 10) , "Research"
Unusual Volume: Volume traded is more than double the 90 day moving average (All exchanges; ASI & ASem). For more detailed analysis,
- On InfoWARE Market Data Terminal <UV> <GO>
- On InfoWARE Finance Mobile App ( Android , iPhone & iPad and Windows 10)
| Symbol | Name | Volume | 90DAvgVol | %VolChg | Price | LClose | %Chg | Trades | Value |
|---|---|---|---|---|---|---|---|---|---|
| FCMB | FCMB GROUP PLC. | 105.13M | 48.71M | 115.81 | 10.90 | 11.00 | -0.91 | 1,144 | 1.14B |
| VERITASKAP | VERITAS KAPITAL ASSURANCE PLC | 59.57M | 23.94M | 148.85 | 2.17 | 1.98 | 9.60 | 561 | 128.81M |
| AFRIPRUD | AFRICA PRUDENTIAL REGISTRARS PLC | 5.10M | 2.38M | 114.20 | 16.20 | 15.25 | 6.23 | 312 | 81.48M |
| AUSTINLAZ | AUSTIN LAZ & COMPANY PLC | 2.59M | 274.78K | 843.05 | 2.71 | 2.90 | -6.55 | 118 | 7.60M |
| JBERGER | JULIUS BERGER NIG. PLC. | 2.15M | 299.43K | 619.12 | 146.10 | 132.90 | 9.93 | 350 | 297.59M |
Investment Insights - High Div. Stocks
Dividend stocks distribute a portion of the company earnings to investors on a regular basis and they can a great choice for investors looking for regular income. As an investment or trading strategy, high dividend yield equities provide annual cash payments as against mostly capital gains in the price of a stock. The list in the table below represent the highest dividend paying stocks from the list of the most liquid stocks in the NSE top 30.
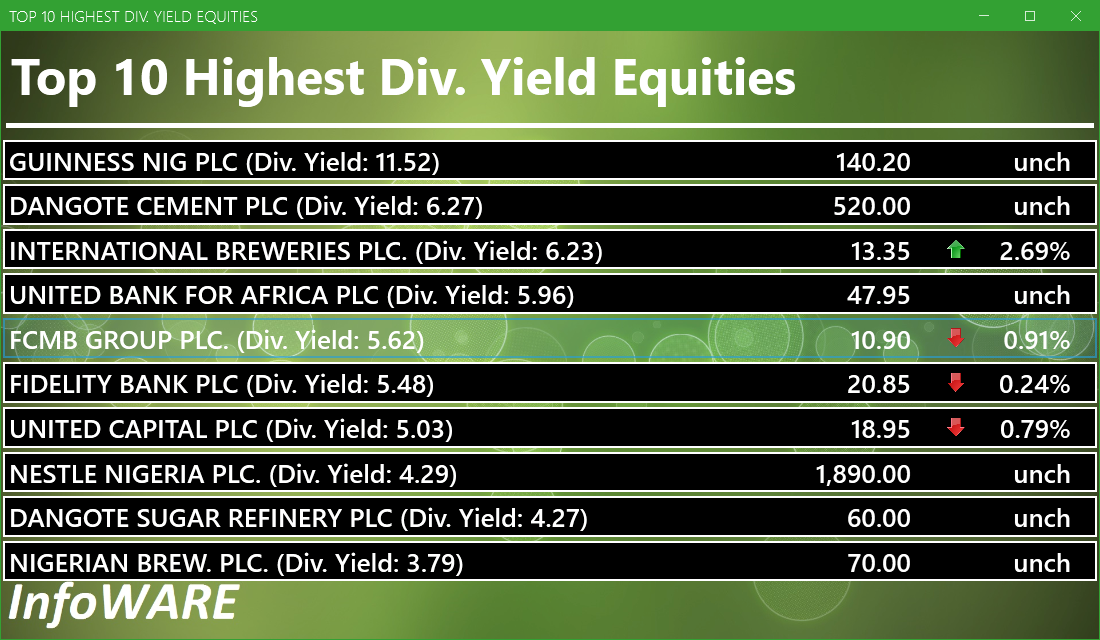
For more detailed analysis,
- On InfoWARE Market Data Terminal <HYIELD> <GO>
- On InfoWARE Finance Mobile App ( Android , iPhone & iPad and Windows 10) , "Research"
Investment Insights - Stocks outperforming the ASI but with approximately the same risk
These list of stocks represent equities that are less risky than the ASI but doing better than the ASI (All Shares Index) using the YTD (Year to Date) returns as the measure. The risk is measured by Beta. Beta is an assessment of a stock's tendency to undergo price changes, (its volatility), as well as its potential returns compared to the ASI. It is expressed as a ratio, where a score of 1 represents performance comparable to the ASI, and returns above or below the market may receive scores greater or lower than 1.
For a full list of both positively and negatively corelated stocks visit InfoWARE Market Data Terminal
- On InfoWARE Market Data Terminal <BANL> <GO>
- On InfoWARE Finance Mobile App ( Android , iPhone & iPad and Windows 10)
| Symbol | DivYield | PE | EPS | Beta | %ChgYTD | ASIYTDReturn | BetaDiff |
|---|---|---|---|---|---|---|---|
| HONYFLOUR | 1.40 | 16.28 | 0.31 | 0.99 | 232.37 | 37.08 | 0.01 |
| CAVERTON | 5.52 | 1.15 | 1.57 | 0.98 | 174.51 | 37.08 | 0.02 |
| ROYALEX | 7.81 | 0.00 | 0.00 | 0.96 | 114.55 | 37.08 | 0.04 |
| CORNERST | 5.28 | 8.62 | 0.35 | 0.93 | 79.29 | 37.08 | 0.07 |
| DEAPCAP | 13.76 | 188.84 | 0.01 | 0.89 | 50.83 | 37.08 | 0.11 |
| VERITASKAP | 4.17 | 48.77 | 0.02 | 0.88 | 45.64 | 37.08 | 0.12 |
| UNIVINSURE | 0.00 | 0.00 | 0.00 | 0.83 | 83.33 | 37.08 | 0.17 |
| FTNCOCOA | 1.60 | 0.00 | 0.00 | 0.79 | 272.34 | 37.08 | 0.21 |
| NB | 3.79 | 16.95 | 1.60 | 0.79 | 118.75 | 37.08 | 0.21 |
| MAYBAKER | 3.75 | 58.94 | 0.14 | 0.78 | 92.02 | 37.08 | 0.22 |
African Markets
| Name | LClose | Change | %Chg |
|---|---|---|---|
| BRVM Stock Exchange | 319.04 | 0.45 | 0.14 |
| Botswana Stock Exchange | 10,559.88 | 0.00 | 0.00 |
| Egyptian Exchange | 35,622.26 | -110.77 | -0.31 |
| Ghana Stock Exchange | 7,346.69 | 10.27 | 0.14 |
| Johannesburg Stock Exchange | 102,723.50 | 976.77 | 0.96 |
| Lusaka Stock Exchange | 23,060.44 | 187.56 | 0.82 |
| Casablanca Stock Exchange | 19,982.27 | 362.96 | 1.85 |
| Malawi Stock Exchange | 490,201.45 | 1,368.73 | 0.28 |
| Nigeria Stock Exchange | 141,004.14 | 673.59 | 0.48 |
| Nairobi Securities Exchange | 170.03 | 1.17 | 0.69 |
| Namibian Stock Exchange | 1,835.40 | 28.90 | 1.60 |
| Rwanda Stock Exchange | 178.88 | 0.00 | 0.00 |
| Tunis Stock Exchange | 11,820.59 | 27.13 | 0.23 |
| Uganda Securities Exchange | 1,430.43 | 15.00 | 1.06 |
Nigeria Market Indexes
| Symbol | LClose | %Chg | WTD% | MTD% | QTD% | YTD% | MktCap | Trades |
|---|---|---|---|---|---|---|---|---|
| ASI | 141,439.75 | 0.31 | 0.00 | 0.13 | 18.12 | 37.08 | 31,379 | |
| NGX30 | 5,152.99 | 0.25 | 0.00 | -0.63 | 9.09 | 35.08 | 15,677 | |
| NGXAFRBVI | 3,645.35 | 1.29 | 0.00 | -4.42 | 2.87 | 46.94 | 5,781 | |
| NGXAFRHDYI | 23,009.60 | 2.11 | 0.00 | -0.93 | 10.02 | 35.13 | 7,134 | |
| NGXASEM | 1,538.10 | 0.00 | 0.00 | 6.34 | -3.57 | -2.88 | 13 | |
| NGXBNK | 1,564.71 | 1.12 | 0.00 | -3.35 | 3.57 | 43.89 | 6,702 | |
| NGXCG | 4,132.14 | 0.67 | 0.00 | -3.94 | 20.17 | 46.05 | 14,686 | |
| NGXCNSMRGDS | 3,228.39 | 0.29 | 0.00 | 8.46 | -6.93 | 86.14 | 3,620 | |
| NGXCOMMDTY | 1,066.84 | -0.30 | 0.00 | -2.65 | 1.87 | 6.68 | ||
| NGXGROWTH | 11,169.23 | -3.90 | 0.00 | 0.92 | 17.45 | 43.88 | 420 | |
| NGXINDUSTR | 4,993.34 | 0.02 | 0.00 | -1.23 | 41.74 | 39.81 | 2,384 | |
| NGXINS | 1,346.25 | 3.81 | 0.00 | 51.78 | 82.27 | 71.24 | 4,513 | |
| NGXLOTUSISLM | 11,546.80 | -0.12 | 0.00 | -0.68 | 20.60 | 65.72 | 5,480 | |
| NGXMAINBOARD | 6,853.76 | 0.43 | 0.00 | 3.23 | 16.19 | 36.97 | 23,967 | |
| NGXMERIGRW | 10,115.62 | 0.82 | 0.00 | -1.88 | 4.80 | 55.07 | 4,533 | |
| NGXMERIVAL | 13,923.67 | 0.26 | 0.00 | -4.15 | 16.54 | 33.49 | 8,002 | |
| NGXOILGAS | 2,378.30 | -0.31 | 0.00 | -2.39 | -0.58 | -12.28 | 499 | |
| NGXPENBRD | 2,617.84 | 0.24 | 0.00 | 0.45 | 13.85 | 42.92 | 25,315 | |
| NGXPENSION | 6,742.84 | 0.49 | 0.00 | -2.48 | 6.11 | 48.72 | 17,899 | |
| NGXPREMIUM | 13,995.68 | 0.08 | 0.00 | -5.22 | 22.02 | 43.80 | 6,992 | |
| NGXSOVBND | 659.52 | 0.00 | 0.00 | -1.98 | 0.92 | 9.64 | 0 |
For more detailed analysis,
- On InfoWARE Market Data Terminal <MKTINS> <GO>
- On InfoWARE Finance Mobile App ( Android, iPhone & iPad and Windows 10) , "Market Indexes"
Find the topic interesting? Will like to comment? Contact Us at solutions@infowarelimited.com
Top News

Chart Of The Day - ASI Chart Vs ASI Advance Decline Line (YTD) (25-Aug-2025 15:13:34.656)
InfoWARE AI Analyst Daily Market Report: 25-Aug-2025

[XNSA]>> CORDROS MILESTONE FUNDS' BID & OFFER PRICES
[RONCHESS]>>Corporate Disclosures-<RONCHESS GLOBAL RESOURCES PLC>
[XNSA]>> DAILY FUND PRICE SUBMISSION - FCMB ASSET MANAGEMENT LIMITED
[XNSA]>> LISTING OF CORONATION INFRASTRUCTURE FUND - SERIES 1
[XNSA]>> DAILY INDICATIVE PRICES
[XNSA]>> OFF MARKET TRADE
[XNSA]>> LISTING OF THE NIGERIAN INFRASTRUCTURE DEBT FUND SCRIP UNIT ISSUES FOR
[XNSA]>> NGX FIXED INCOME INDICATIVE PRICE LIST FOR AUG 25, 2025
[VSPBONDETF]>> DAILY INDICATIVE PRICES.
[XNSA]>> REGISTRATION FOR BATCH TWO- 2025 DEALING CLERKSHIP CERTIFICATION PROGRA
[XNSA]>> NGX NON-INTEREST FINANCE BOARD LAUNCH COMMUNIQUE
[XNSA]>> NOTIFICATION OF PRICE ADJUSTMENT
[XNSA]>> UPDATED- SAVE THE DATE: 29TH ANNUAL STOCKBROKERS CONFERENCE
[JBERGER]>>Corporate Disclosures-<JULIUS BERGER NIGERIA PLC>
InfoWARE AI Analyst Weekly Market Report: 22-Aug-2025
Chart Of The Day - ASI Chart Vs ASI Advance Decline Line (YTD) (22-Aug-2025 15:06:53.357)
InfoWARE AI Analyst Daily Market Report: 22-Aug-2025
[XNSA]>> NORRENBERGER MUTUAL FUNDS WEEKLY UPDATE
[XNSA]>> OFF MARKET TRADE
[XNSA]>> CORDROS MILESTONE FUNDS' BID & OFFER PRICES
[XNSA]>> APPOINTMENT OF A DIRECTOR
[XNSA]>> OFF MARKET TRADE
[PRESCO]>>Corporate Disclosures-<PRESCO PLC>
[XNSA]>> DAILY FUND PRICE SUBMISSION - FCMB ASSET MANAGEMENT LIMITED
[XNSA]>> RECLASSIFICATION OF STERLING FINANCIAL HOLDINGS COMPANY PLC
[XNSA]>> RECLASSIFICATION OF ABBEY MORTGAGE BANK PLC
[VETGOODS]>> DAILY INDICATIVE PRICES
[XNSA]>> REGISTRATION FOR BATCH TWO- 2025 DEALING CLERKSHIP CERTIFICATION PROGRA
Get IDIA - the stock trading app for the modern investor
Solutions by Business
Product Suites
Company
Contacts
- 8th Floor,
- South Atlantic Petroleum Towers,
- 1 Adeola Odeku Street,
- Victoria Island,
- Lagos, Nigeria.
- Email: solutions@infowarelimited.com
Follow Us
 |
 |
 |
 |